| Param | Original file | Final file |
|---|---|---|
| Filename | modeM0/AS1G08_027T06_9000001594_10988cztM0_level2.evt | modeM0/AS1G08_027T06_9000001594_10988cztM0_level2_quad_clean.evt |
| Size (bytes) | 508,152,960 | 95,166,720 |
| Size | 484.6 MB | 90.8 MB |
| Events in quadrant A | 4,055,872 | 618,453 |
| Events in quadrant B | 4,358,385 | 612,632 |
| Events in quadrant C | 3,083,208 | 608,873 |
| Events in quadrant D | 3,441,732 | 579,586 |
| Mode M9 | |||
|---|---|---|---|
| Quadrant | BADHDUFLAG | Total packets | Discarded packets |
| A | 0 | 8 | 0 |
| B | 0 | 8 | 0 |
| C | 0 | 8 | 0 |
| D | 0 | 8 | 0 |
| Mode M0 | |||
|---|---|---|---|
| Quadrant | BADHDUFLAG | Total packets | Discarded packets |
| A | 0 | 16262 | 2 |
| B | 0 | 17261 | 1 |
| C | 0 | 13796 | 1 |
| D | 0 | 14689 | 1 |
| Mode SS | |||
|---|---|---|---|
| Quadrant | BADHDUFLAG | Total packets | Discarded packets |
| A | 0 | 136 | 0 |
| B | 0 | 136 | 0 |
| C | 0 | 136 | 0 |
| D | 0 | 136 | 0 |
| Quadrant | Total seconds | Saturated seconds | Saturation percentage |
|---|---|---|---|
| A | 6627 | 214 | 3.229214% |
| B | 6627 | 424 | 6.398069% |
| C | 6627 | 86 | 1.297721% |
| D | 6627 | 126 | 1.901313% |
Noise dominated data is calculated using 1-second bins in cleaned event files. If a bin has >2000 counts, and if more than 50% of those come from <1% of pixels, then it is considered to be noise-dominated and hence unusable.
| Quadrant | # 1 sec bins | Bins with >0 counts | Bins with >2000 counts | High rate bins dominated by noise | Noise dominated (total time) | Noise dominated (detector-on time) | Marked lightcurve |
|---|---|---|---|---|---|---|---|
| A | 7467 | 6627 | 107 | 107 | 1.43% | 1.61% |  |
| B | 7467 | 6628 | 220 | 220 | 2.95% | 3.32% |  |
| C | 7467 | 6628 | 23 | 23 | 0.31% | 0.35% |  |
| D | 7467 | 6628 | 58 | 58 | 0.78% | 0.88% | 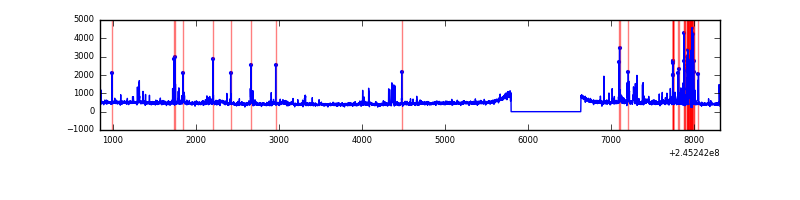 |
Top three noisy pixels from each quadrant. If the there are fewer than three noisy pixels in the level2.evt file, extra rows are filled as -1
| Pixel properties | Quadrant properties | ||||||
|---|---|---|---|---|---|---|---|
| Quadrant | DetID | PixID | Counts | Sigma | Mean | Median | Sigma |
| A | 8 | 5 | 637324 | 3916.32 | 804 | 789 | 162.5 |
| A | 15 | 223 | 161989 | 991.79 | 804 | 789 | 162.5 |
| A | 8 | 15 | 78359 | 477.25 | 804 | 789 | 162.5 |
| B | 4 | 239 | 1078431 | 7111.61 | 792 | 774 | 151.5 |
| B | 0 | 214 | 55107 | 358.55 | 792 | 774 | 151.5 |
| B | 0 | 229 | 36022 | 232.61 | 792 | 774 | 151.5 |
| C | 4 | 254 | 73206 | 406.63 | 768 | 772 | 178.1 |
| C | 1 | 3 | 10258 | 53.25 | 768 | 772 | 178.1 |
| C | 13 | 61 | 5652 | 27.4 | 768 | 772 | 178.1 |
| D | 1 | 52 | 249344 | 1337.33 | 773 | 750 | 185.9 |
| D | 8 | 195 | 85636 | 456.65 | 773 | 750 | 185.9 |
| D | 13 | 104 | 71381 | 379.96 | 773 | 750 | 185.9 |
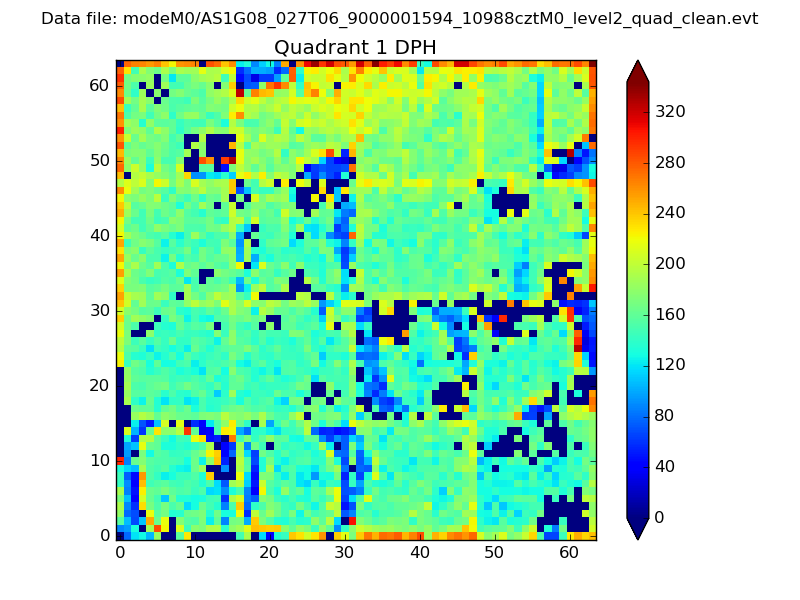
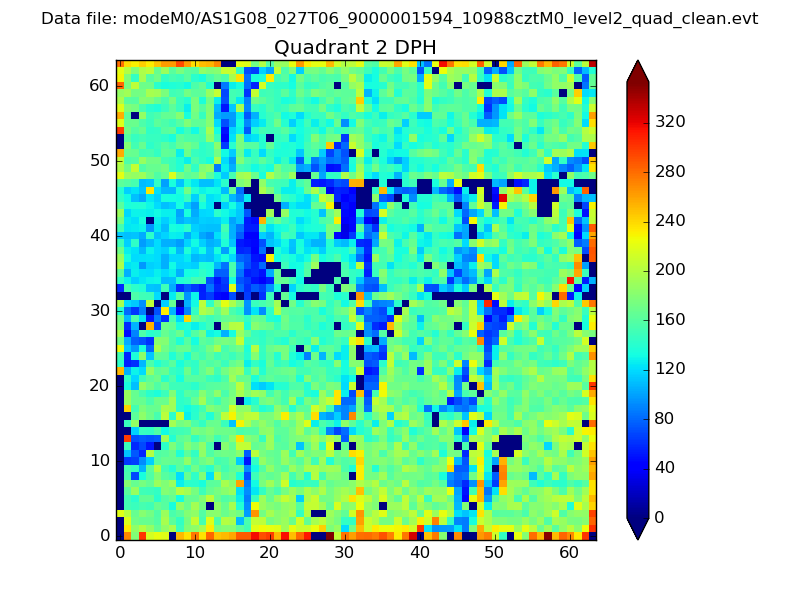
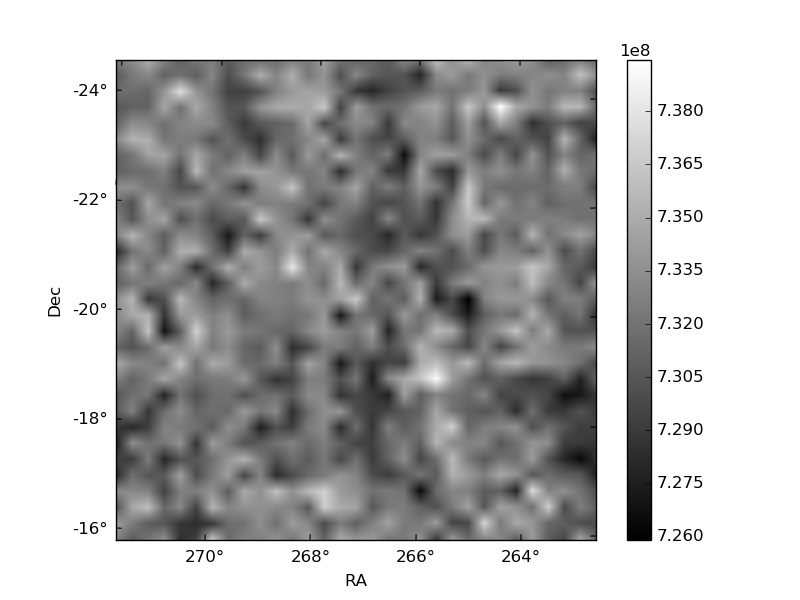
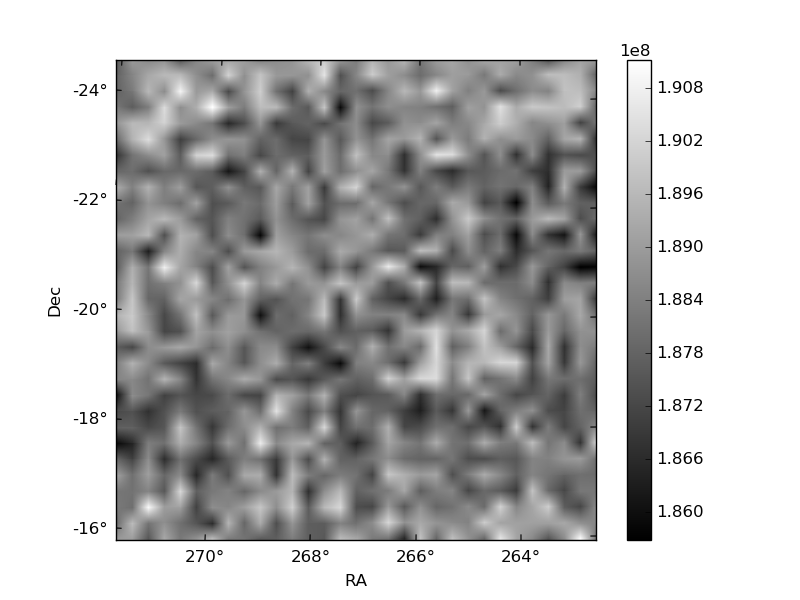
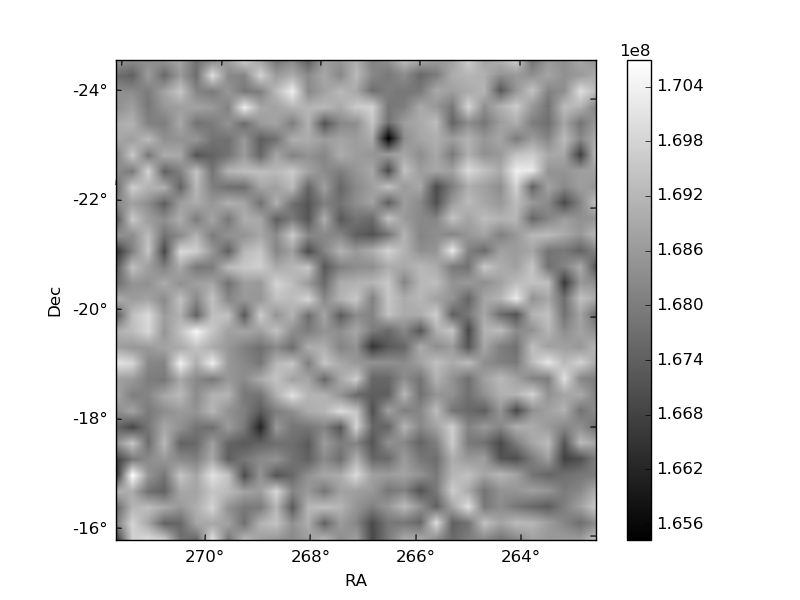
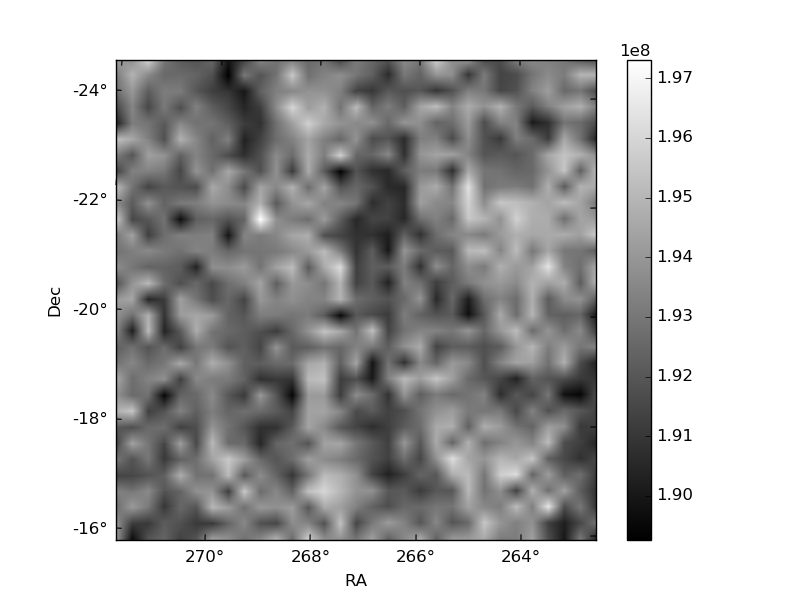
Histogram calculated using DETX and DETY for each event in the final _common_clean file
| Quadrant A |  |
 |
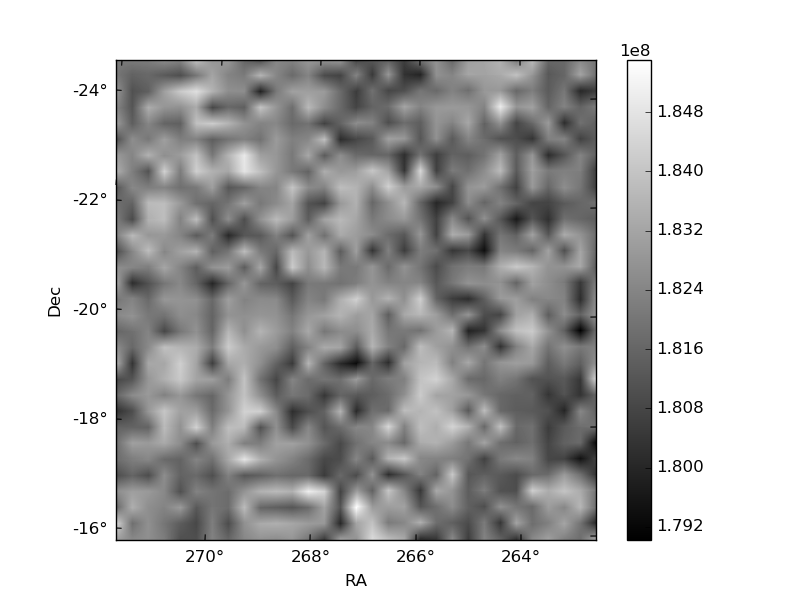
Quadrant B |
|---|---|---|---|
| Quadrant D | 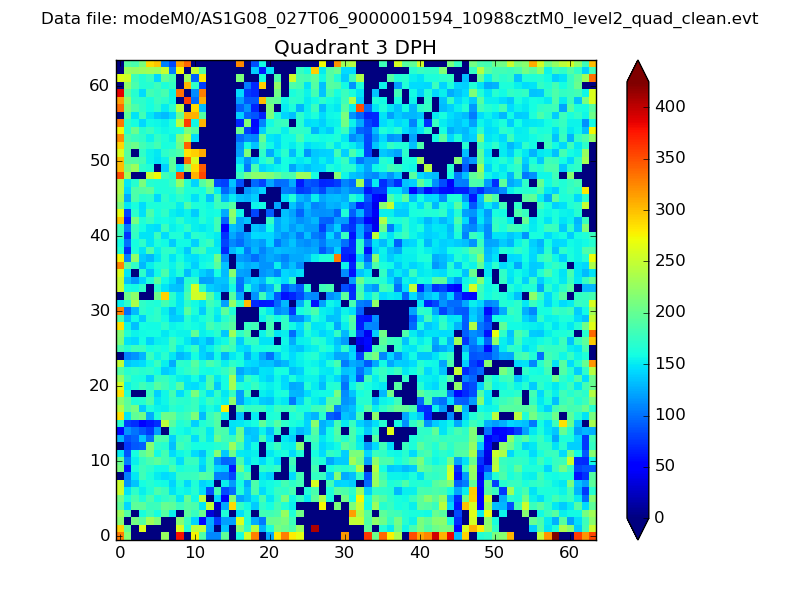 |
 |
Quadrant C |
| Plot type | Count rate plots | Images |
|---|---|---|
| Comparison with Poisson distribution Blue bars denote a histogram of data divided into 1 sec bins. Red curve is a Poisson curve with rate = median count rate of data. |
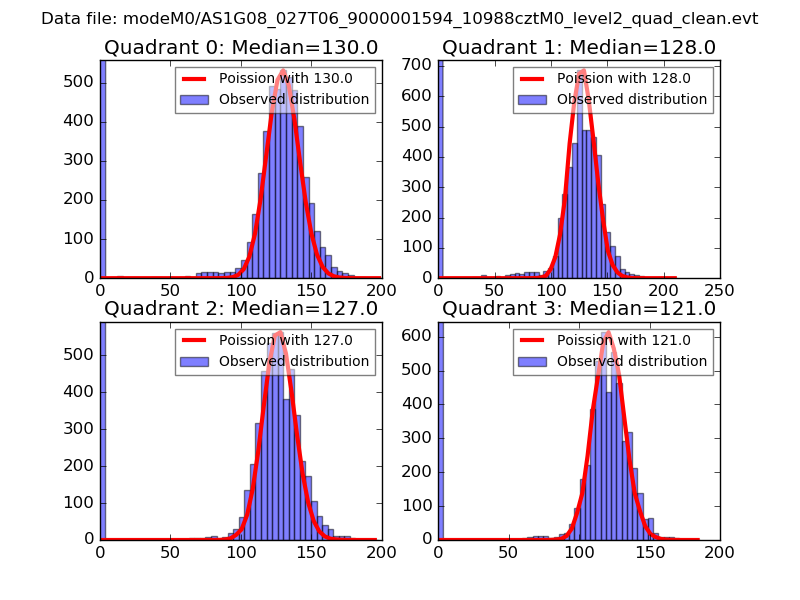 |
 |
| Quadrant-wise count rates Data is divided into 100 sec bins |
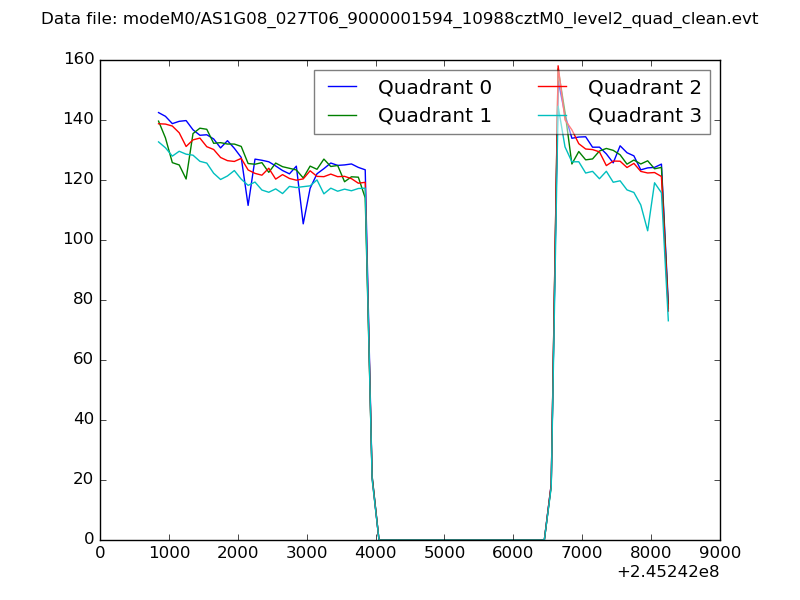 |
|
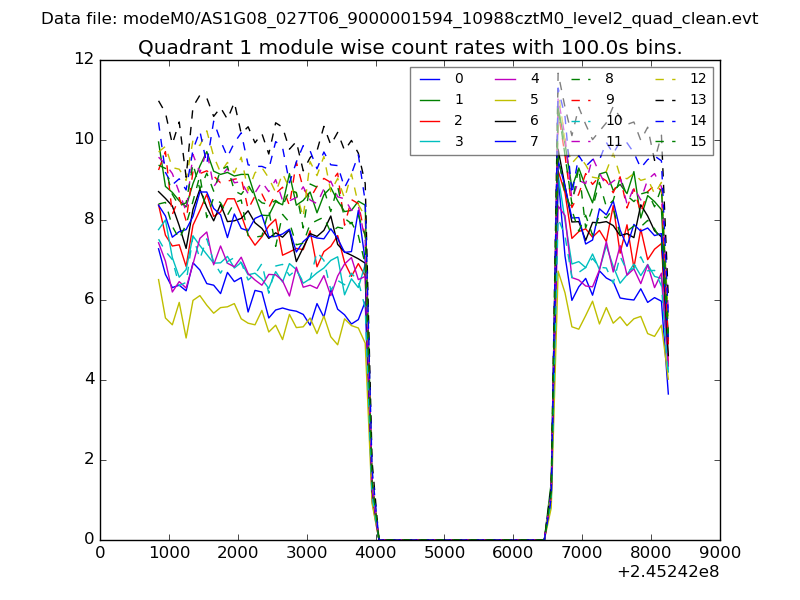
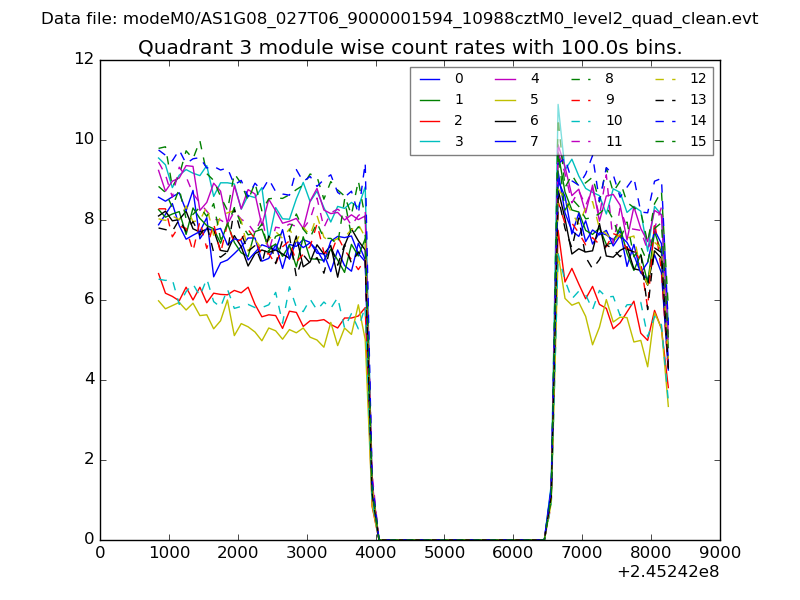
| Module-wise count rates for Quadrant A Data is divided into 100 sec bins |
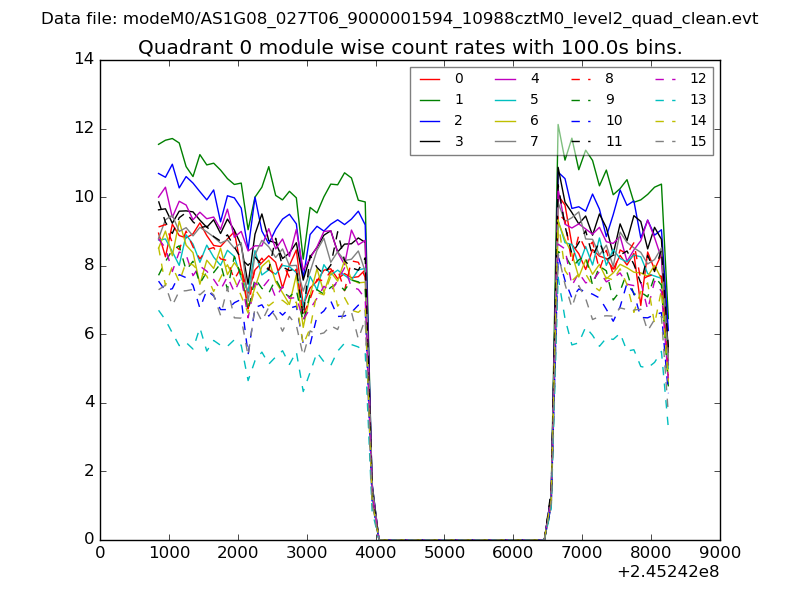 |
 |
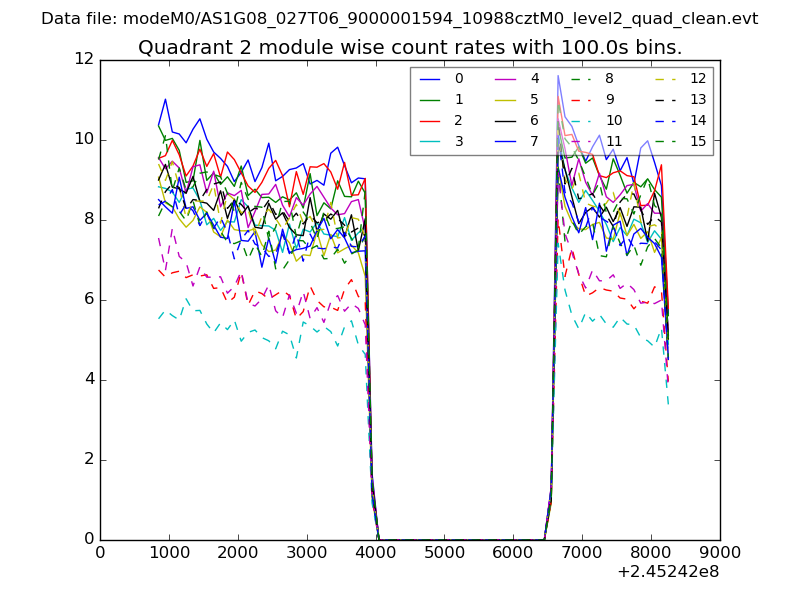
| Module-wise count rates for Quadrant B Data is divided into 100 sec bins |
 |
 |
| Module-wise count rates for Quadrant C Data is divided into 100 sec bins |
 |
 |
| Module-wise count rates for Quadrant D Data is divided into 100 sec bins |
 |
 |
| Parameter | Plot |
|---|---|
| CZT HV Monitor | 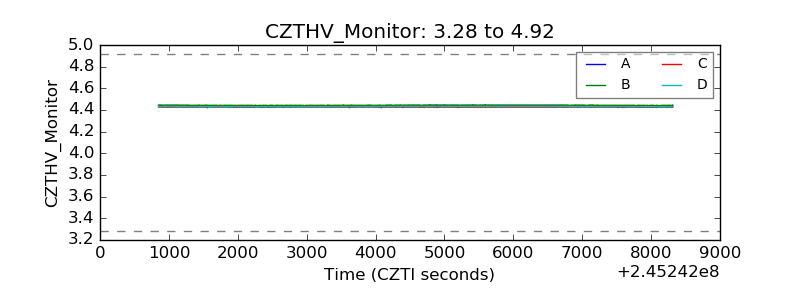 |
| D_VDD | 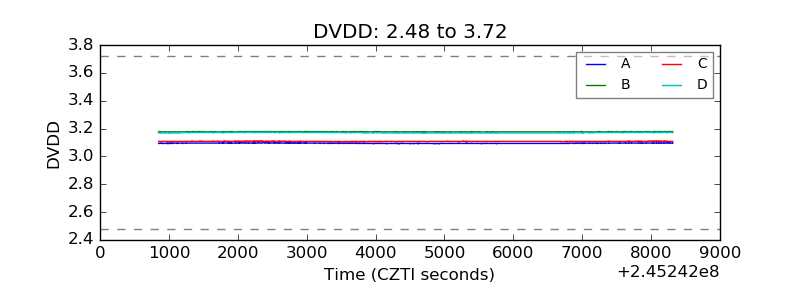 |
| Temperature 1 | 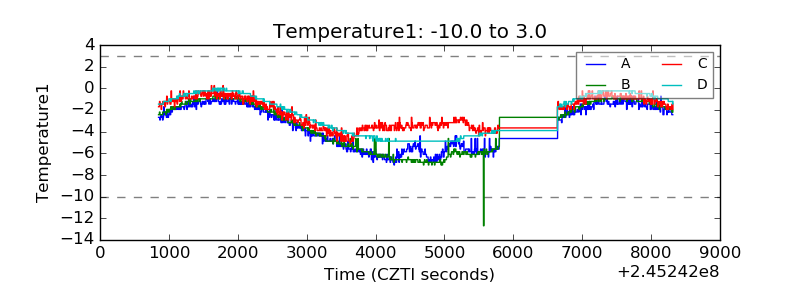 |
| Veto HV Monitor | 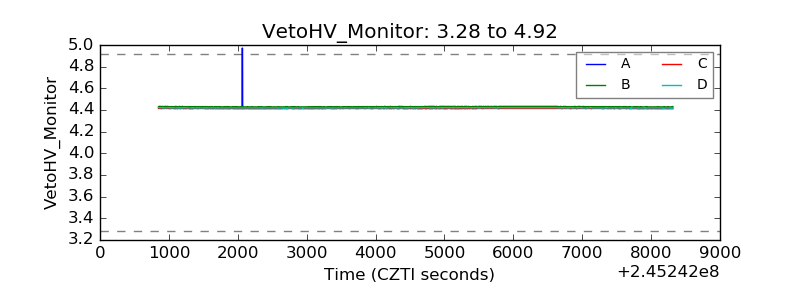 |
| Veto LLD |  |
| Alpha Counter | 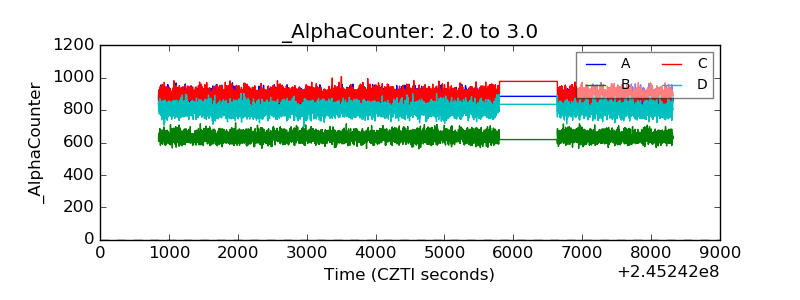 |
| _CPM_Rate | 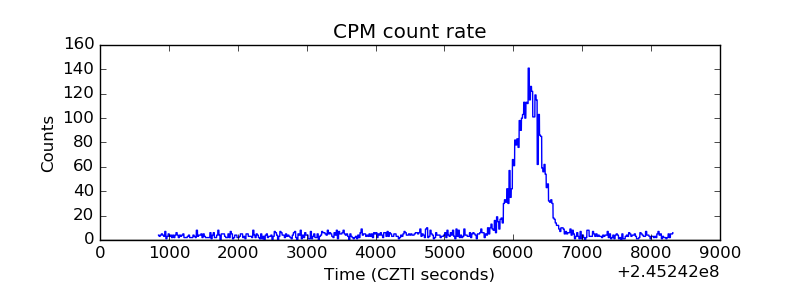 |
| CZT Counter | 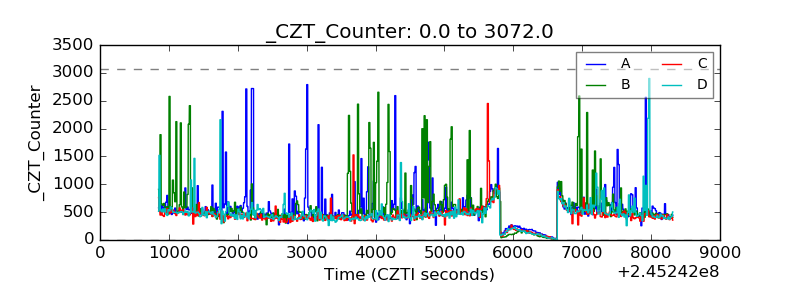 |
| +2.5 Volts monitor |  |
| +5 Volts monitor |  |
| _ROLL_ROT | 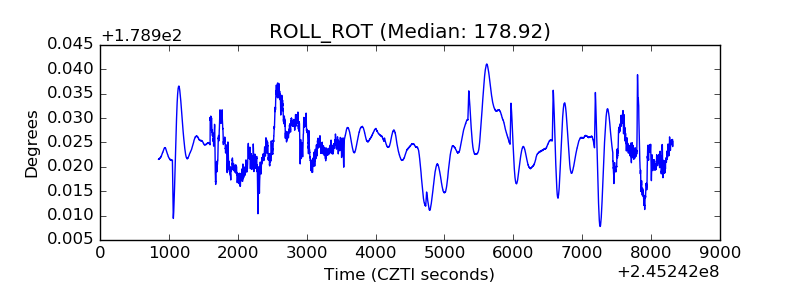 |
| _Roll_DEC | 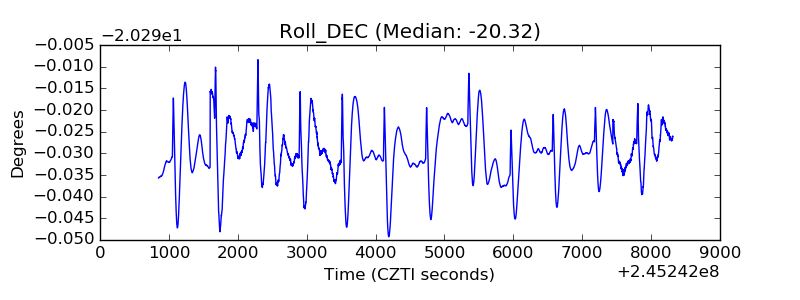 |
| _Roll_RA | 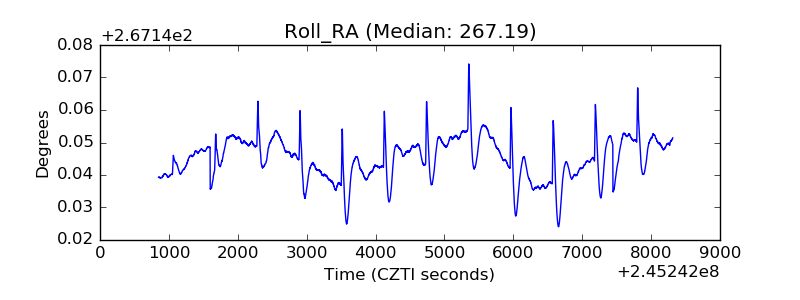 |
| Veto Counter | 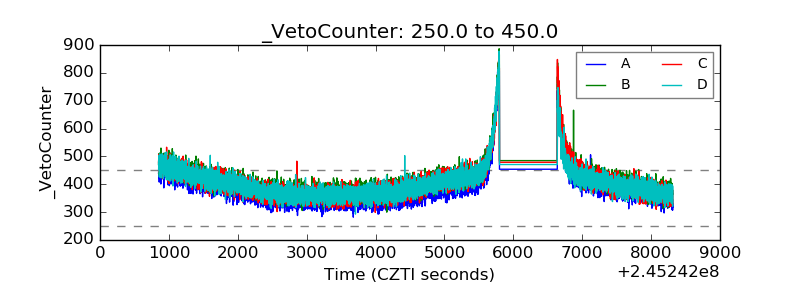 |