| Param | Original file | Final file |
|---|---|---|
| Filename | modeM0/AS1G08_027T06_9000001594_10989cztM0_level2.evt | modeM0/AS1G08_027T06_9000001594_10989cztM0_level2_quad_clean.evt |
| Size (bytes) | 565,689,600 | 95,016,960 |
| Size | 539.5 MB | 90.6 MB |
| Events in quadrant A | 4,024,911 | 606,557 |
| Events in quadrant B | 4,596,090 | 606,990 |
| Events in quadrant C | 3,688,259 | 601,303 |
| Events in quadrant D | 4,343,275 | 569,963 |
| Mode M9 | |||
|---|---|---|---|
| Quadrant | BADHDUFLAG | Total packets | Discarded packets |
| A | 0 | 4 | 0 |
| B | 0 | 4 | 0 |
| C | 0 | 4 | 0 |
| D | 0 | 4 | 0 |
| Mode M0 | |||
|---|---|---|---|
| Quadrant | BADHDUFLAG | Total packets | Discarded packets |
| A | 0 | 16650 | 2 |
| B | 0 | 18233 | 1 |
| C | 0 | 16066 | 1 |
| D | 0 | 17813 | 1 |
| Mode SS | |||
|---|---|---|---|
| Quadrant | BADHDUFLAG | Total packets | Discarded packets |
| A | 0 | 144 | 0 |
| B | 0 | 144 | 0 |
| C | 0 | 144 | 0 |
| D | 0 | 144 | 0 |
| Quadrant | Total seconds | Saturated seconds | Saturation percentage |
|---|---|---|---|
| A | 7069 | 223 | 3.154619% |
| B | 7069 | 365 | 5.163389% |
| C | 7069 | 188 | 2.659499% |
| D | 7069 | 197 | 2.786816% |
Noise dominated data is calculated using 1-second bins in cleaned event files. If a bin has >2000 counts, and if more than 50% of those come from <1% of pixels, then it is considered to be noise-dominated and hence unusable.
| Quadrant | # 1 sec bins | Bins with >0 counts | Bins with >2000 counts | High rate bins dominated by noise | Noise dominated (total time) | Noise dominated (detector-on time) | Marked lightcurve |
|---|---|---|---|---|---|---|---|
| A | 7429 | 7070 | 84 | 84 | 1.13% | 1.19% | 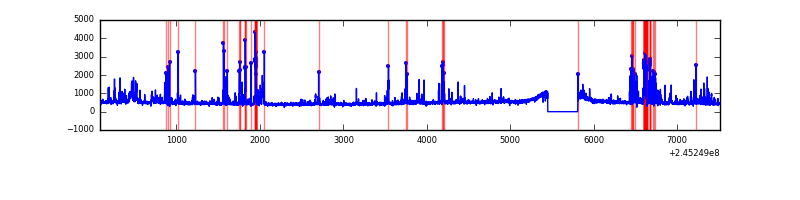 |
| B | 7429 | 7070 | 133 | 133 | 1.79% | 1.88% | 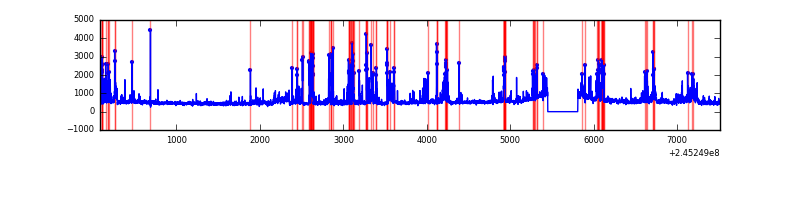 |
| C | 7429 | 7070 | 78 | 78 | 1.05% | 1.10% | 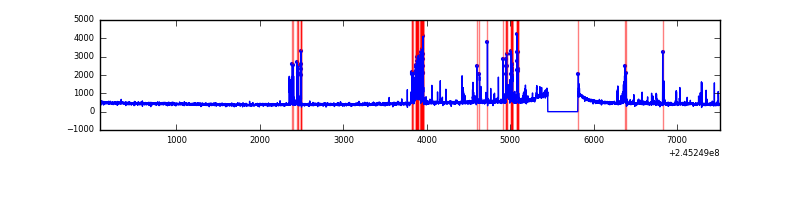 |
| D | 7429 | 7070 | 95 | 95 | 1.28% | 1.34% | 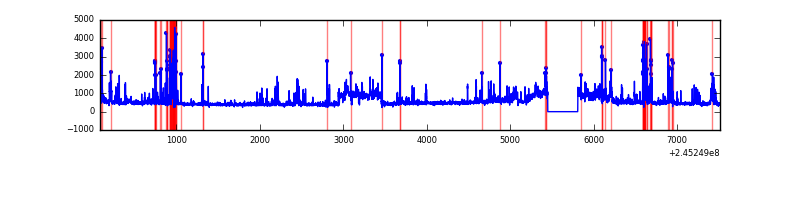 |
Top three noisy pixels from each quadrant. If the there are fewer than three noisy pixels in the level2.evt file, extra rows are filled as -1
| Pixel properties | Quadrant properties | ||||||
|---|---|---|---|---|---|---|---|
| Quadrant | DetID | PixID | Counts | Sigma | Mean | Median | Sigma |
| A | 8 | 5 | 585747 | 3338.78 | 850 | 833 | 175.2 |
| A | 15 | 223 | 96160 | 544.14 | 850 | 833 | 175.2 |
| A | 15 | 239 | 26056 | 143.98 | 850 | 833 | 175.2 |
| B | 4 | 239 | 1031577 | 6351.63 | 846 | 827 | 162.3 |
| B | 15 | 204 | 72033 | 438.78 | 846 | 827 | 162.3 |
| B | 0 | 214 | 62330 | 378.99 | 846 | 827 | 162.3 |
| C | 4 | 254 | 507841 | 2670.36 | 814 | 819 | 189.9 |
| C | 13 | 61 | 6134 | 27.99 | 814 | 819 | 189.9 |
| C | 8 | 222 | 3920 | 16.33 | 814 | 819 | 189.9 |
| D | 1 | 52 | 447887 | 2139.46 | 807 | 789 | 209.0 |
| D | 13 | 105 | 262057 | 1250.22 | 807 | 789 | 209.0 |
| D | 5 | 222 | 218047 | 1039.62 | 807 | 789 | 209.0 |
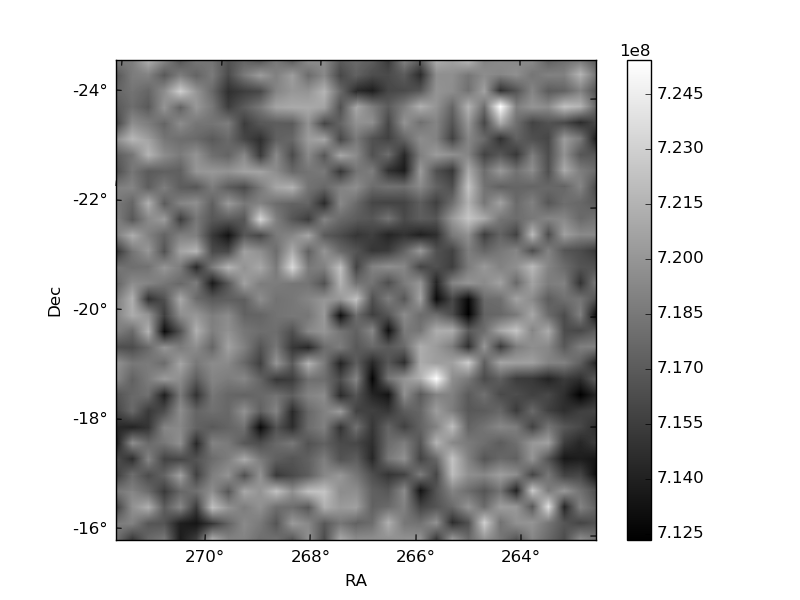
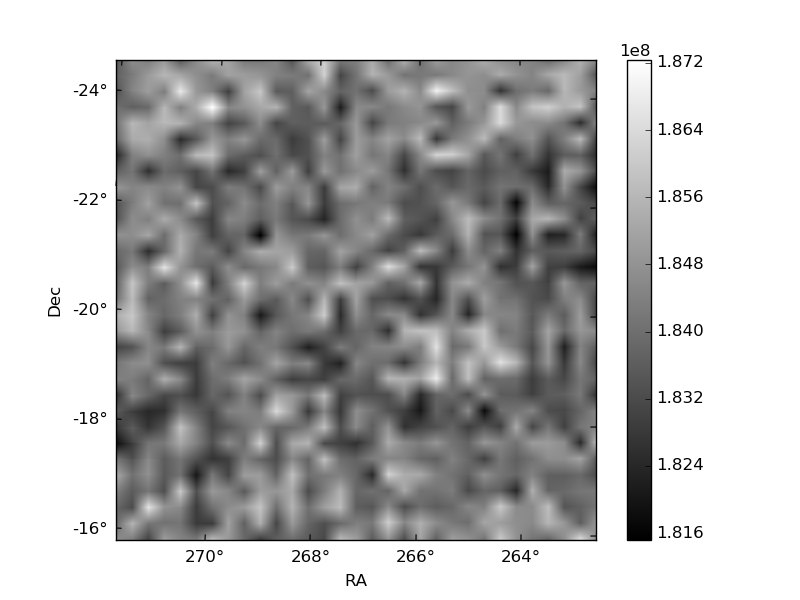
Histogram calculated using DETX and DETY for each event in the final _common_clean file
| Quadrant A | 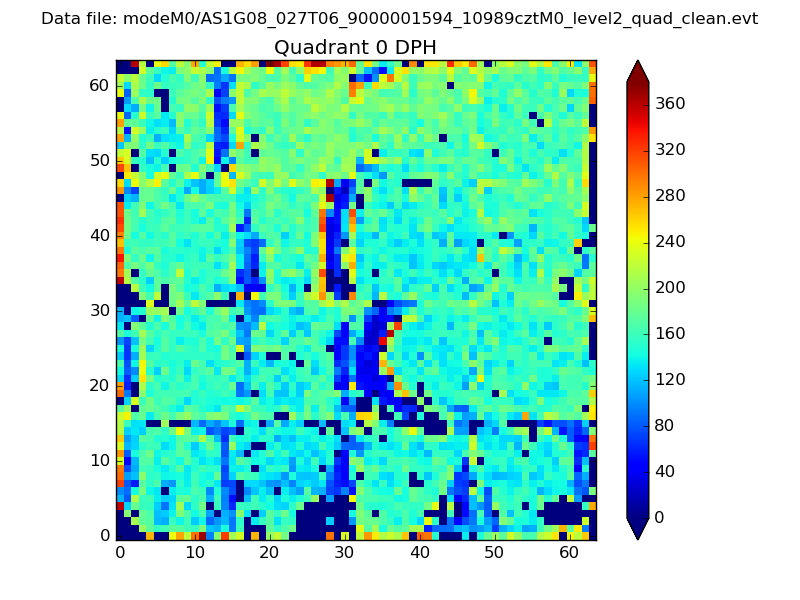 |
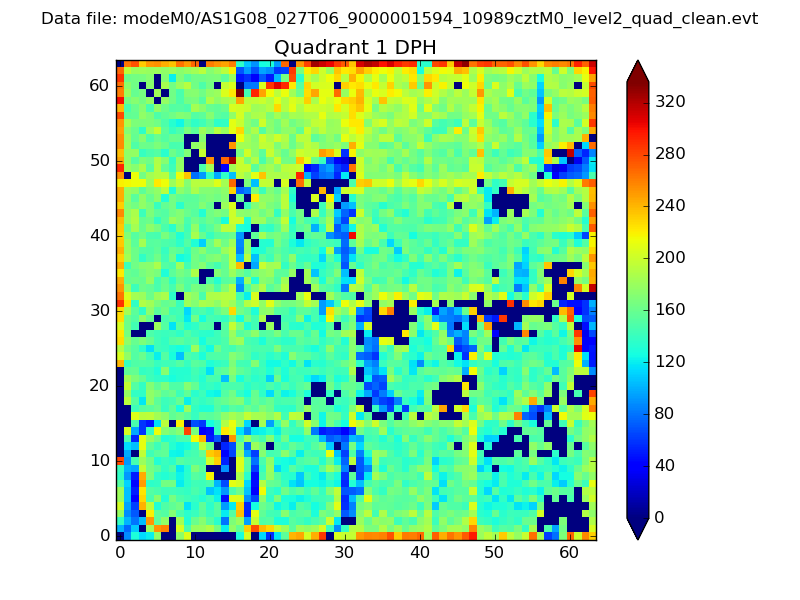 |
Quadrant B |
|---|---|---|---|
| Quadrant D | 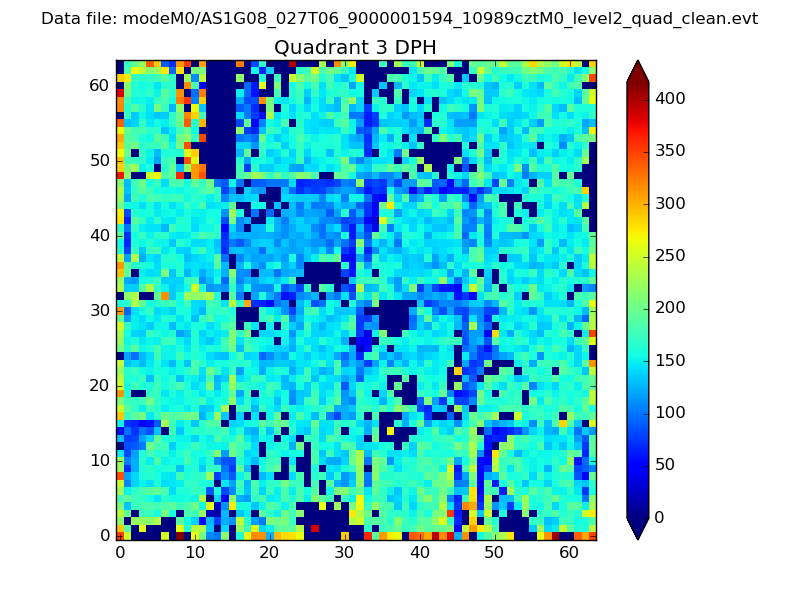 |
 |
Quadrant C |
| Plot type | Count rate plots | Images |
|---|---|---|
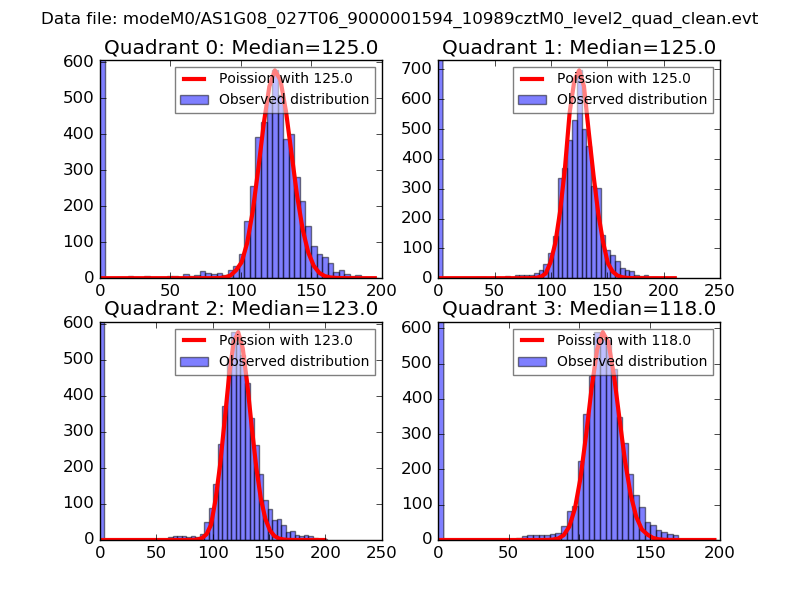
| Comparison with Poisson distribution Blue bars denote a histogram of data divided into 1 sec bins. Red curve is a Poisson curve with rate = median count rate of data. |
 |
 |
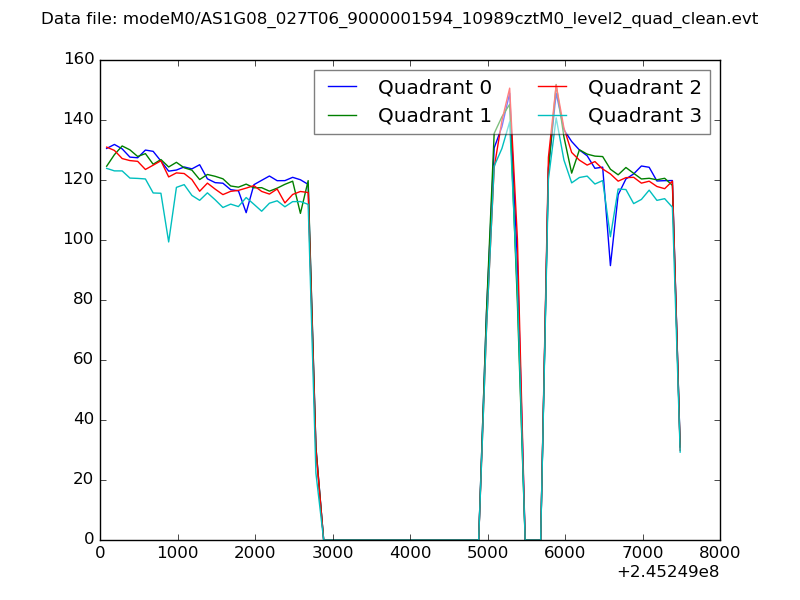
| Quadrant-wise count rates Data is divided into 100 sec bins |
 |
|
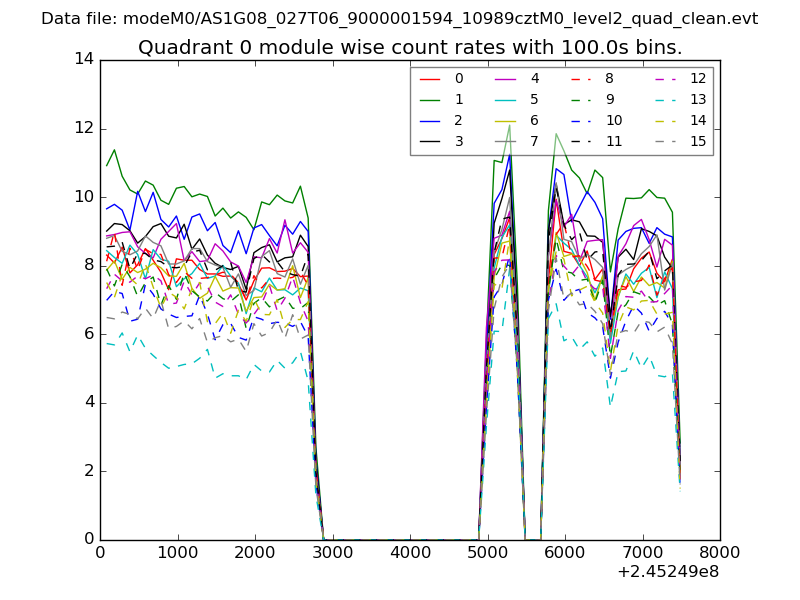
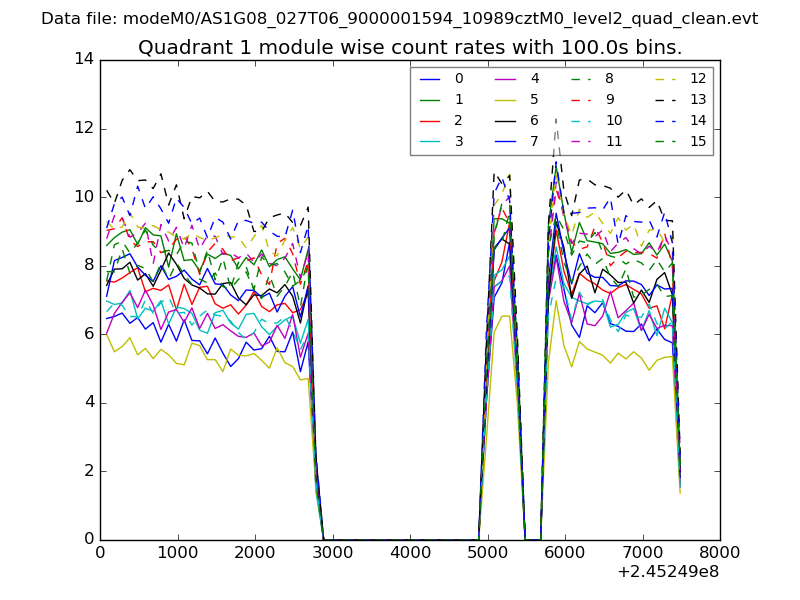
| Module-wise count rates for Quadrant A Data is divided into 100 sec bins |
 |
 |
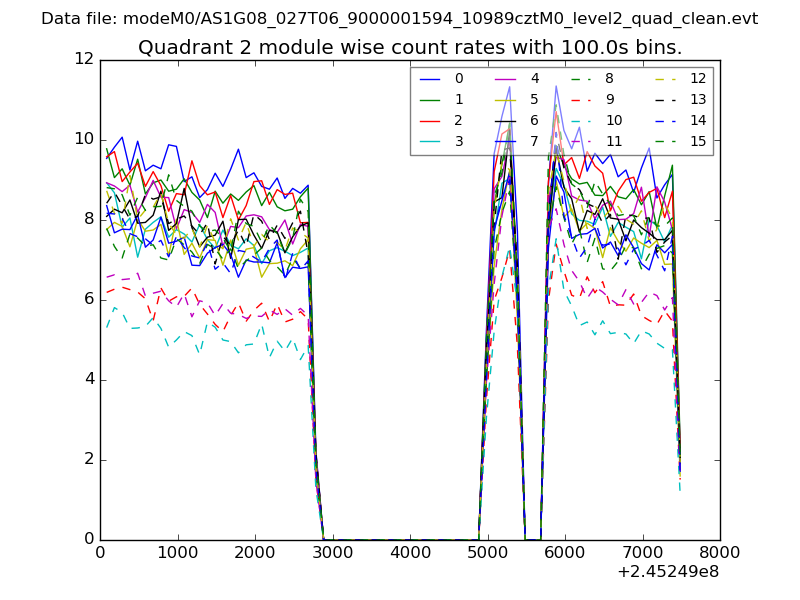
| Module-wise count rates for Quadrant B Data is divided into 100 sec bins |
 |
 |
| Module-wise count rates for Quadrant C Data is divided into 100 sec bins |
 |
 |
| Module-wise count rates for Quadrant D Data is divided into 100 sec bins |
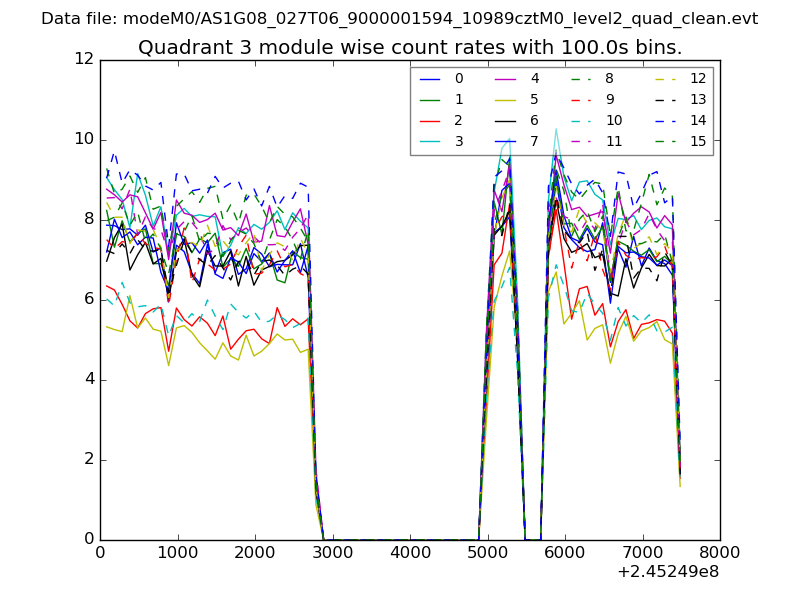 |
 |
| Parameter | Plot |
|---|---|
| CZT HV Monitor | 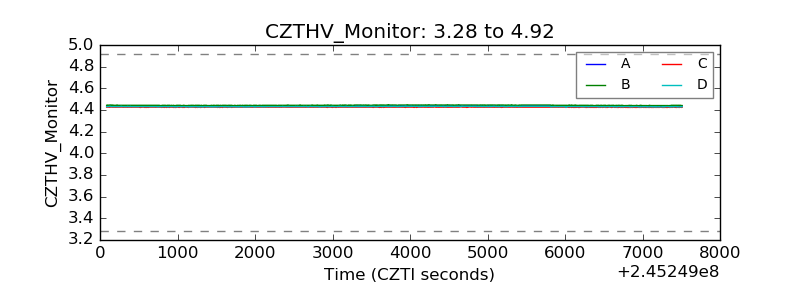 |
| D_VDD | 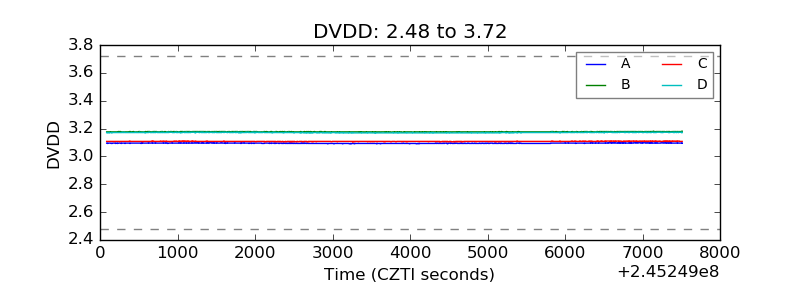 |
| Temperature 1 | 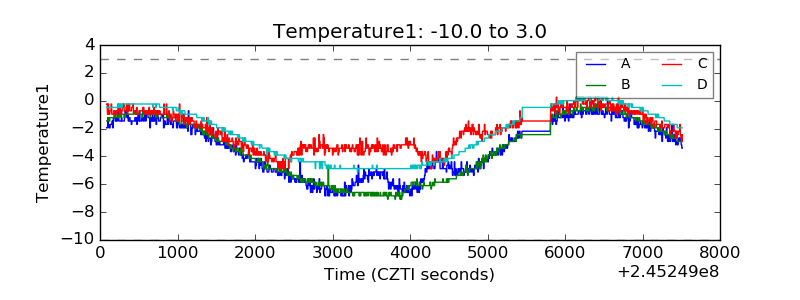 |
| Veto HV Monitor | 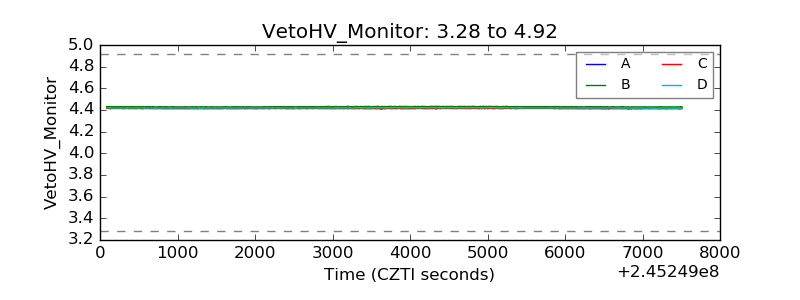 |
| Veto LLD | 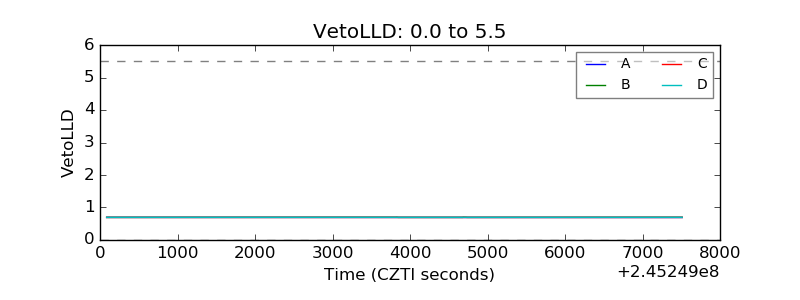 |
| Alpha Counter | 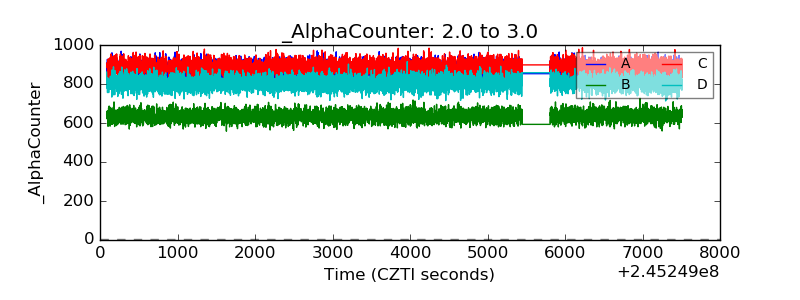 |
| _CPM_Rate | 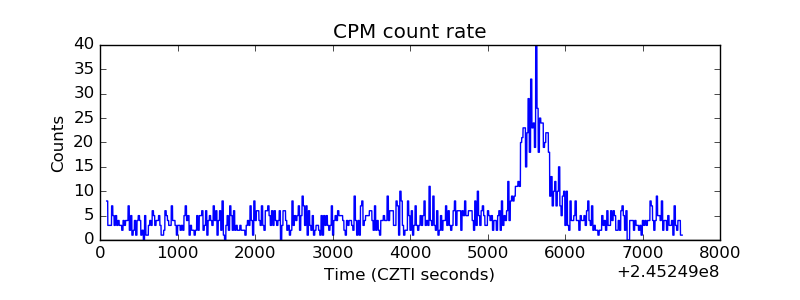 |
| CZT Counter | 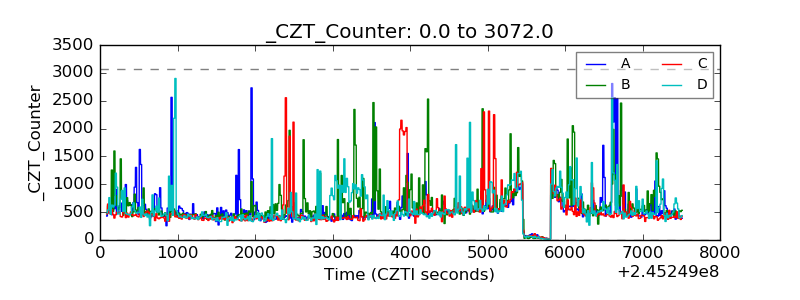 |
| +2.5 Volts monitor |  |
| +5 Volts monitor | 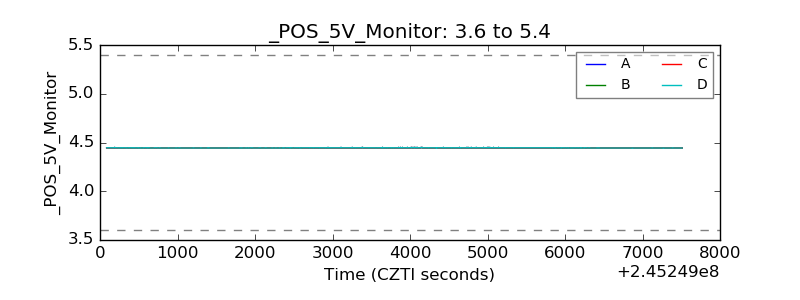 |
| _ROLL_ROT | 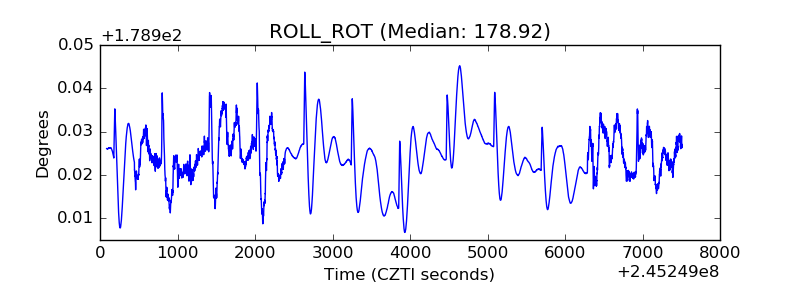 |
| _Roll_DEC | 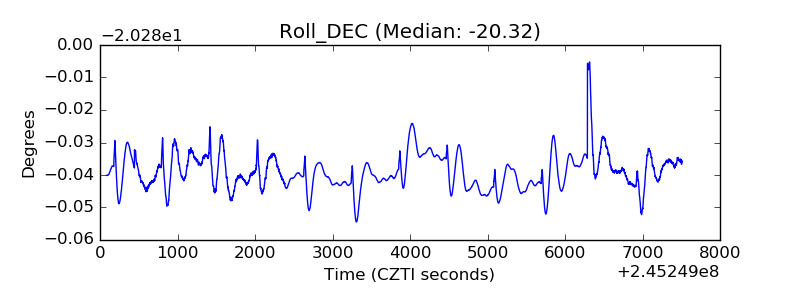 |
| _Roll_RA |  |
| Veto Counter | 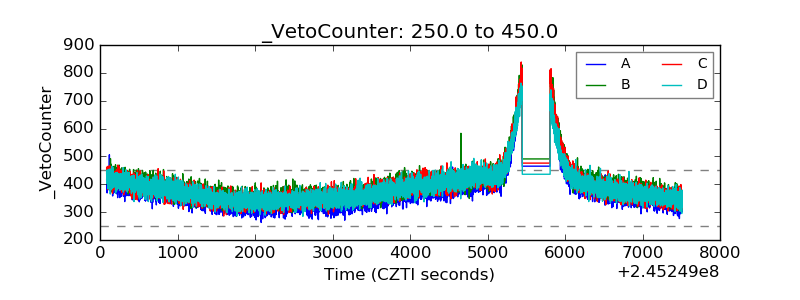 |