| Param | Original file | Final file |
|---|---|---|
| Filename | modeM0/AS1G08_027T06_9000001594_10990cztM0_level2.evt | modeM0/AS1G08_027T06_9000001594_10990cztM0_level2_quad_clean.evt |
| Size (bytes) | 587,903,040 | 100,198,080 |
| Size | 560.7 MB | 95.6 MB |
| Events in quadrant A | 3,844,342 | 642,073 |
| Events in quadrant B | 5,213,977 | 640,942 |
| Events in quadrant C | 4,110,695 | 633,722 |
| Events in quadrant D | 4,137,053 | 605,334 |
| Mode M0 | |||
|---|---|---|---|
| Quadrant | BADHDUFLAG | Total packets | Discarded packets |
| A | 0 | 16393 | 2 |
| B | 0 | 20319 | 1 |
| C | 0 | 17340 | 1 |
| D | 0 | 17281 | 1 |
| Mode SS | |||
|---|---|---|---|
| Quadrant | BADHDUFLAG | Total packets | Discarded packets |
| A | 0 | 148 | 0 |
| B | 0 | 148 | 0 |
| C | 0 | 148 | 0 |
| D | 0 | 148 | 0 |
| Quadrant | Total seconds | Saturated seconds | Saturation percentage |
|---|---|---|---|
| A | 7354 | 159 | 2.162089% |
| B | 7354 | 440 | 5.983138% |
| C | 7354 | 155 | 2.107696% |
| D | 7354 | 64 | 0.870275% |
Noise dominated data is calculated using 1-second bins in cleaned event files. If a bin has >2000 counts, and if more than 50% of those come from <1% of pixels, then it is considered to be noise-dominated and hence unusable.
| Quadrant | # 1 sec bins | Bins with >0 counts | Bins with >2000 counts | High rate bins dominated by noise | Noise dominated (total time) | Noise dominated (detector-on time) | Marked lightcurve |
|---|---|---|---|---|---|---|---|
| A | 7424 | 7355 | 58 | 58 | 0.78% | 0.79% | 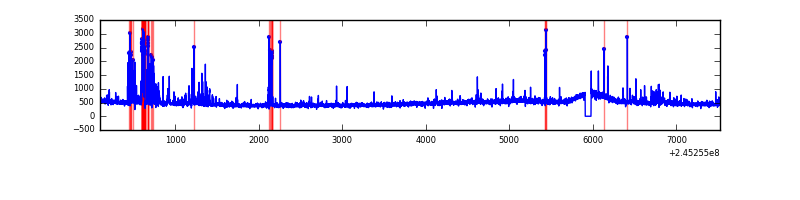 |
| B | 7424 | 7355 | 240 | 240 | 3.23% | 3.26% | 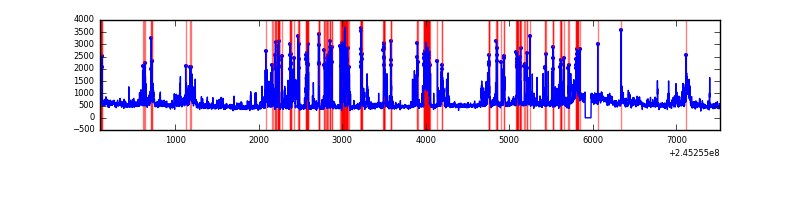 |
| C | 7424 | 7355 | 119 | 119 | 1.60% | 1.62% | 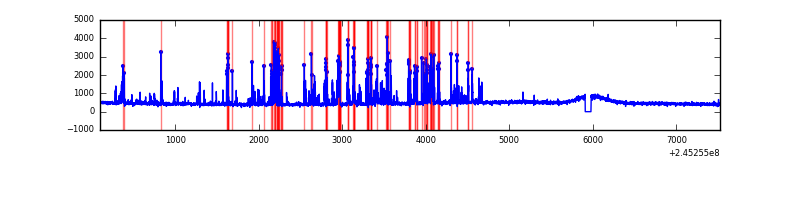 |
| D | 7424 | 7355 | 50 | 50 | 0.67% | 0.68% |  |
Top three noisy pixels from each quadrant. If the there are fewer than three noisy pixels in the level2.evt file, extra rows are filled as -1
| Pixel properties | Quadrant properties | ||||||
|---|---|---|---|---|---|---|---|
| Quadrant | DetID | PixID | Counts | Sigma | Mean | Median | Sigma |
| A | 8 | 5 | 276799 | 1525.84 | 880 | 863 | 180.8 |
| A | 15 | 223 | 107728 | 590.93 | 880 | 863 | 180.8 |
| A | 15 | 239 | 36577 | 197.49 | 880 | 863 | 180.8 |
| B | 4 | 239 | 1541175 | 9212.73 | 872 | 851 | 167.2 |
| B | 3 | 189 | 67562 | 399.0 | 872 | 851 | 167.2 |
| B | 15 | 204 | 66297 | 391.43 | 872 | 851 | 167.2 |
| C | 4 | 254 | 795984 | 4038.41 | 843 | 848 | 196.9 |
| C | 9 | 54 | 13941 | 66.5 | 843 | 848 | 196.9 |
| C | 13 | 61 | 6483 | 28.62 | 843 | 848 | 196.9 |
| D | 5 | 222 | 305451 | 1474.29 | 848 | 822 | 206.6 |
| D | 1 | 52 | 187107 | 901.55 | 848 | 822 | 206.6 |
| D | 8 | 195 | 177872 | 856.85 | 848 | 822 | 206.6 |
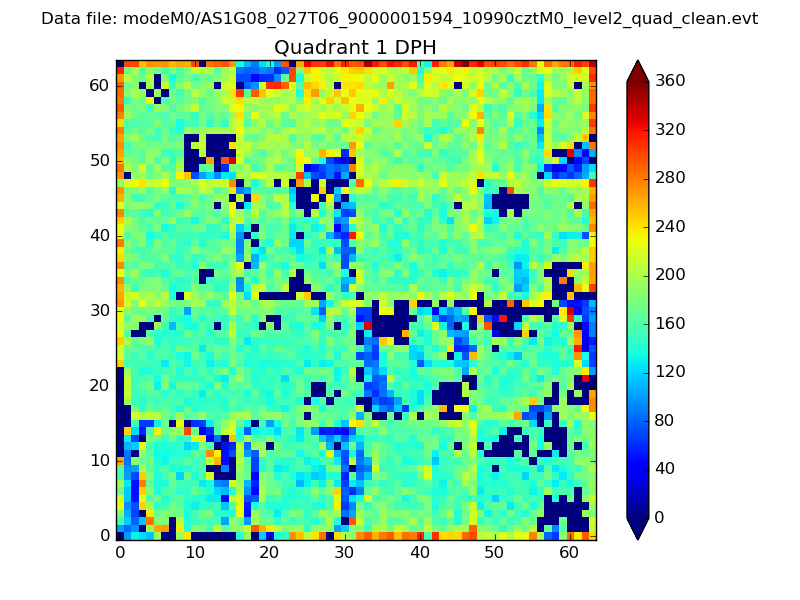
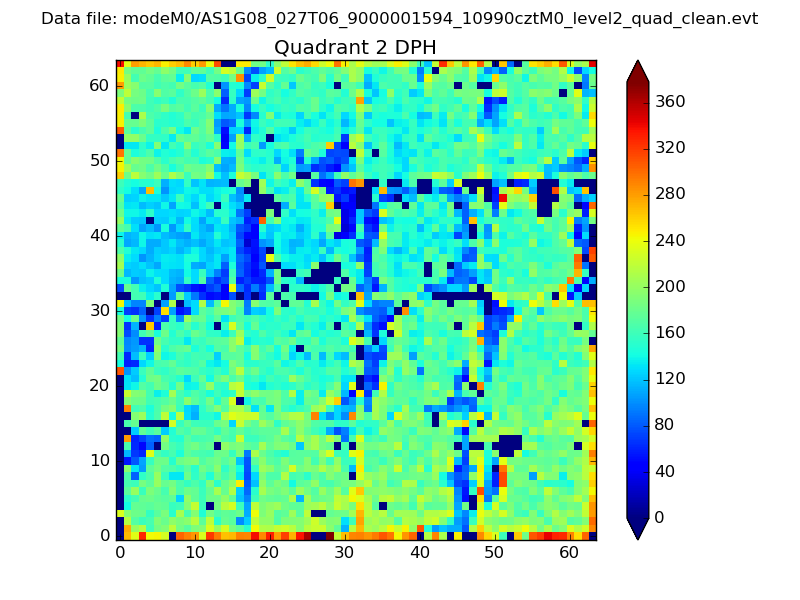
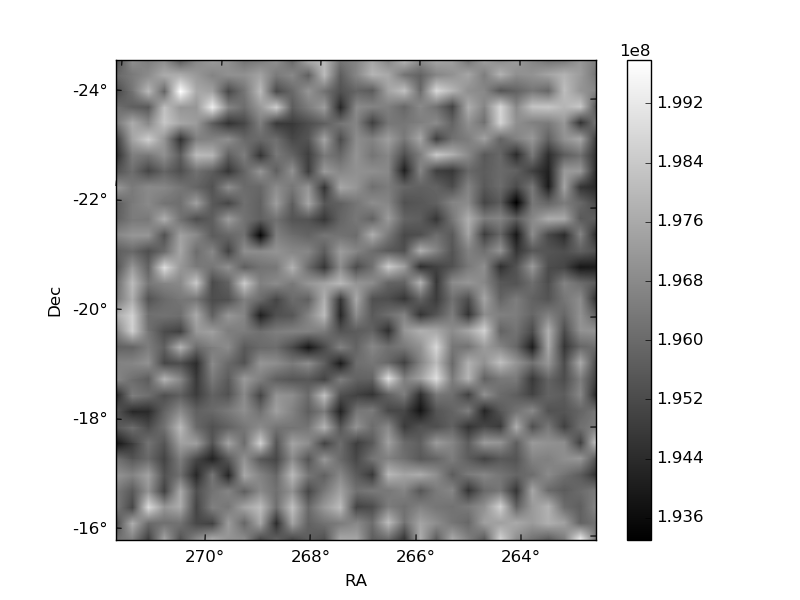
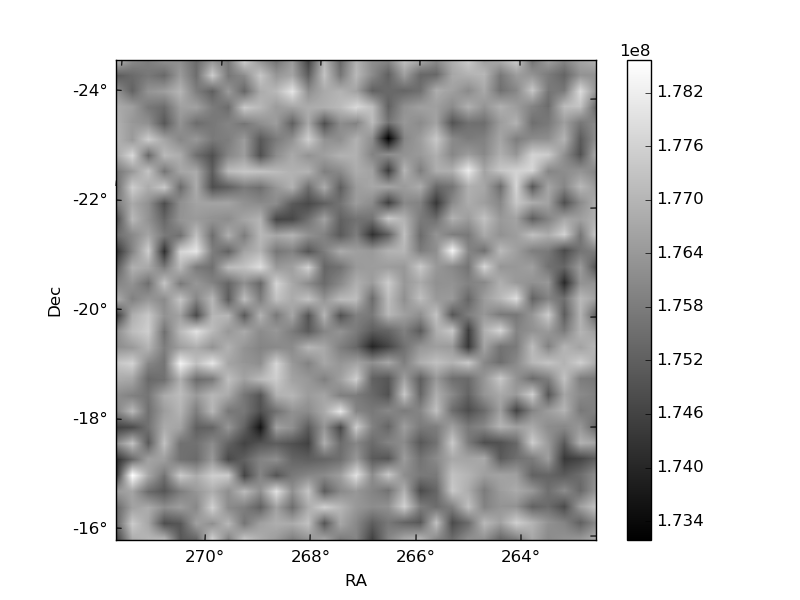
Histogram calculated using DETX and DETY for each event in the final _common_clean file
| Quadrant A | 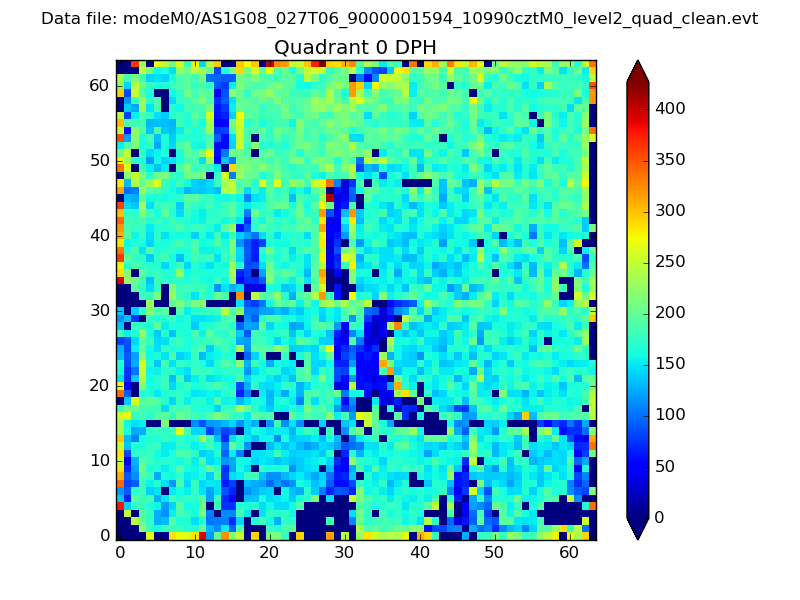 |
 |
Quadrant B |
|---|---|---|---|
| Quadrant D |  |
 |
Quadrant C |
| Plot type | Count rate plots | Images |
|---|---|---|
| Comparison with Poisson distribution Blue bars denote a histogram of data divided into 1 sec bins. Red curve is a Poisson curve with rate = median count rate of data. |
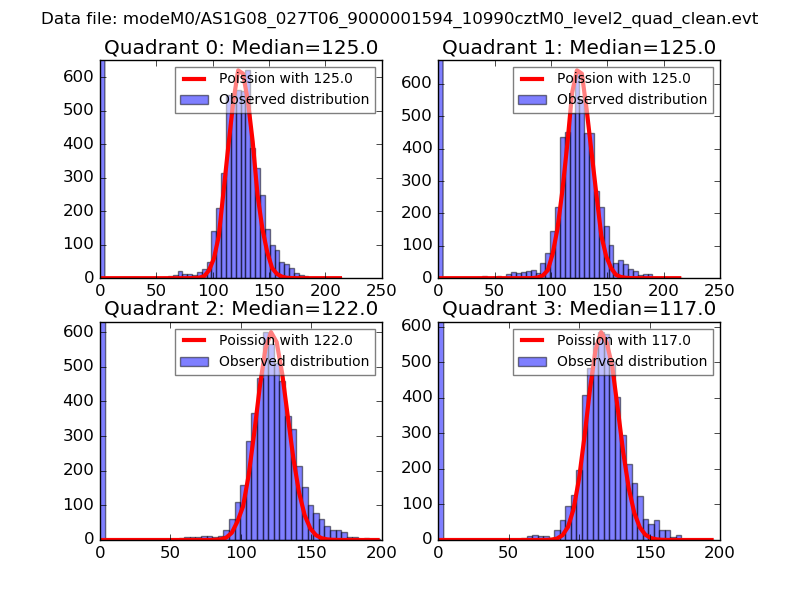 |
 |
| Quadrant-wise count rates Data is divided into 100 sec bins |
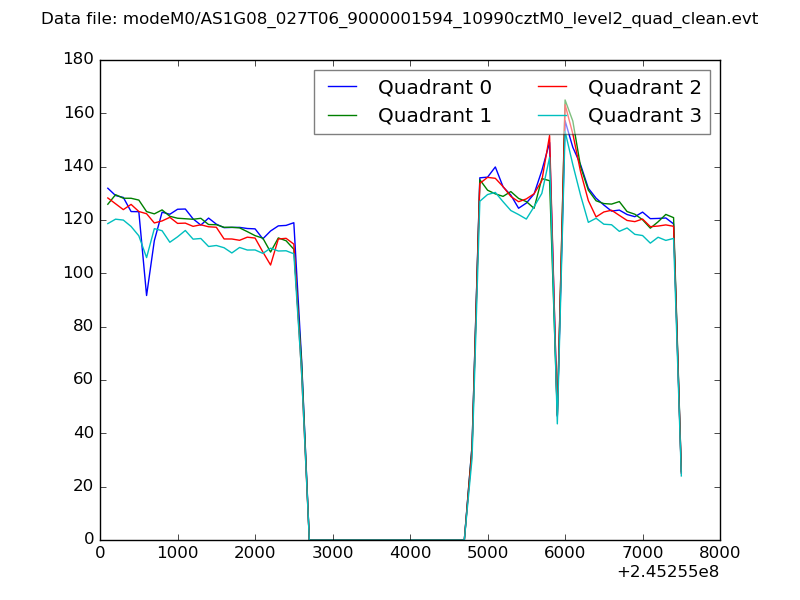 |
|
| Module-wise count rates for Quadrant A Data is divided into 100 sec bins |
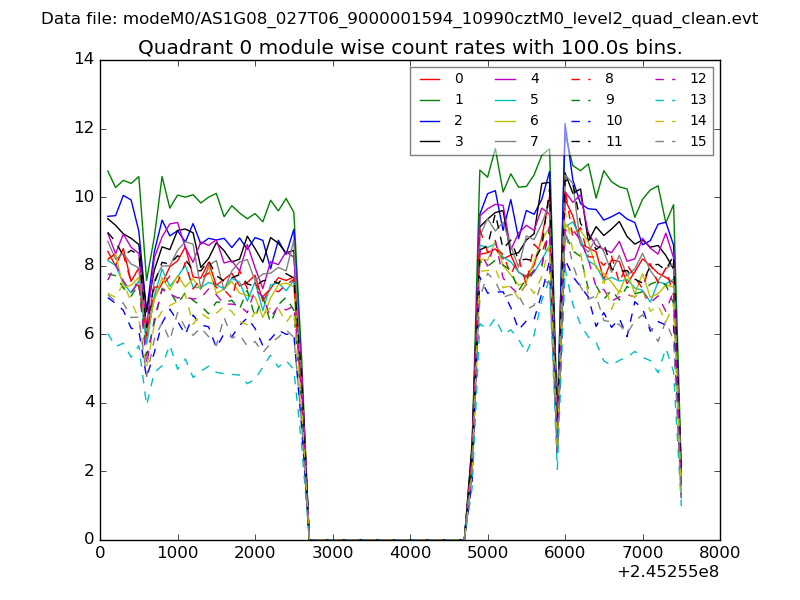 |
 |
| Module-wise count rates for Quadrant B Data is divided into 100 sec bins |
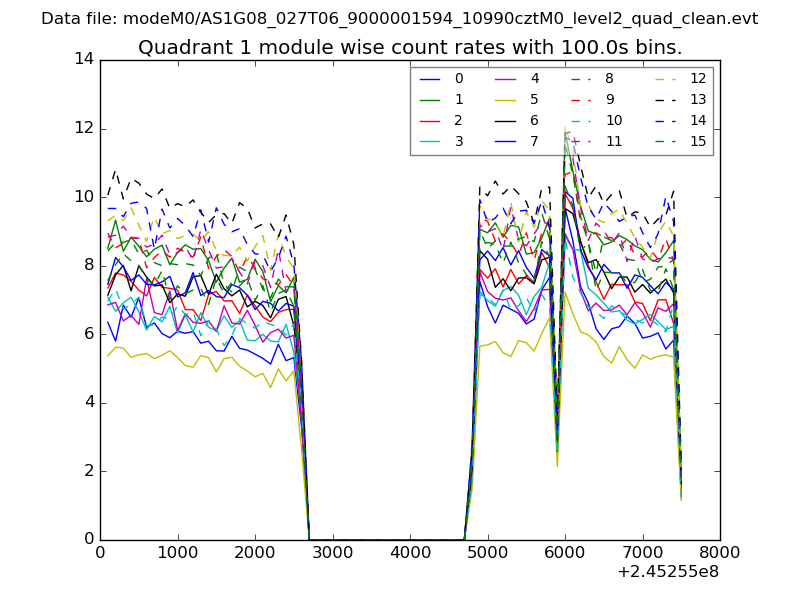 |
 |
| Module-wise count rates for Quadrant C Data is divided into 100 sec bins |
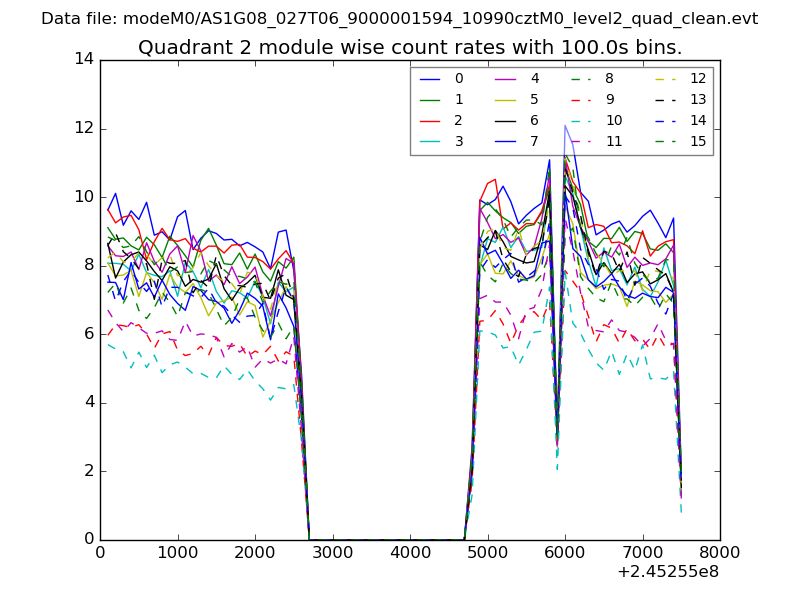 |
 |
| Module-wise count rates for Quadrant D Data is divided into 100 sec bins |
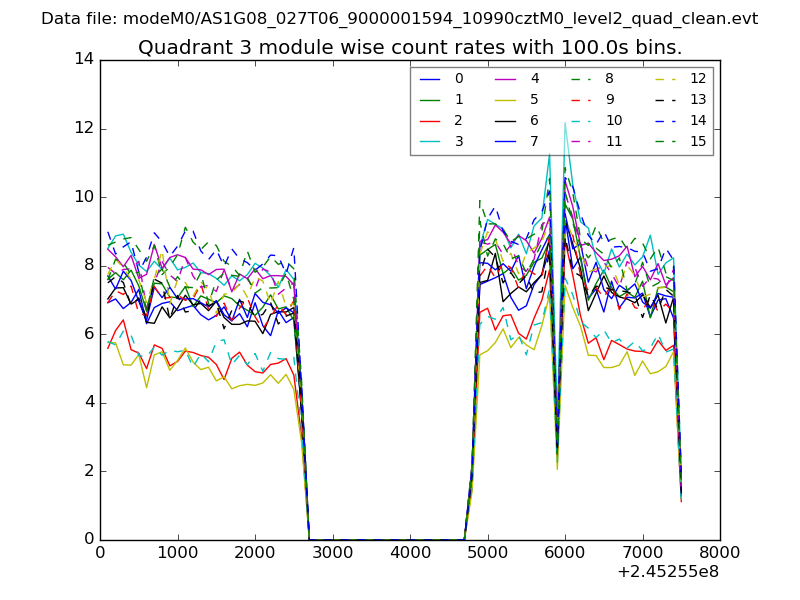 |
 |
| Parameter | Plot |
|---|---|
| CZT HV Monitor | 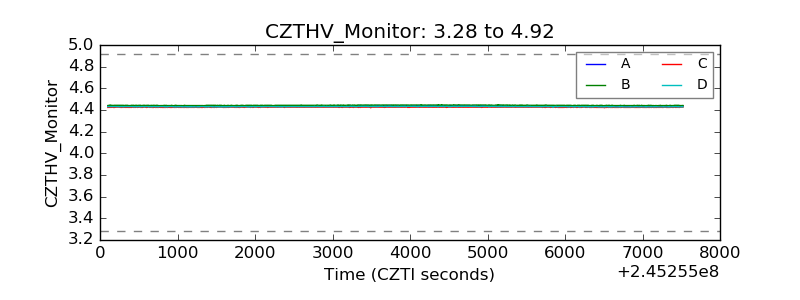 |
| D_VDD | 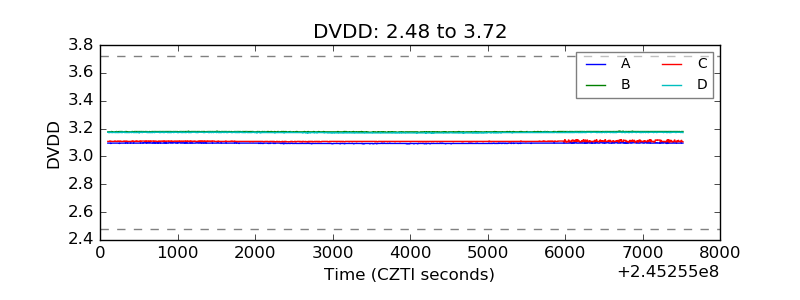 |
| Temperature 1 | 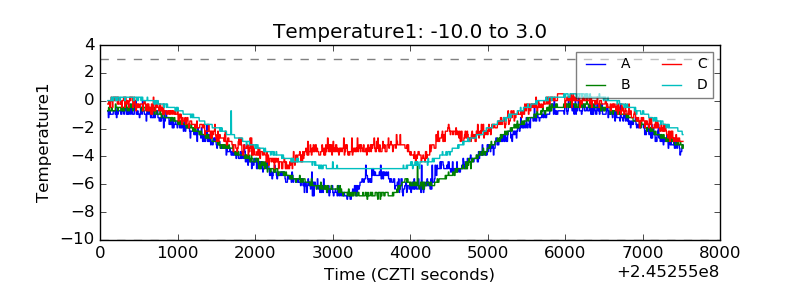 |
| Veto HV Monitor | 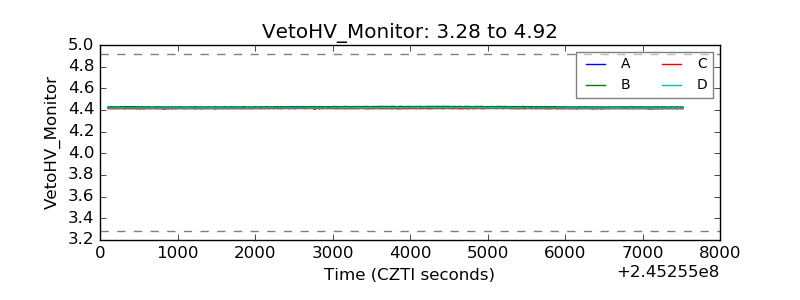 |
| Veto LLD |  |
| Alpha Counter | 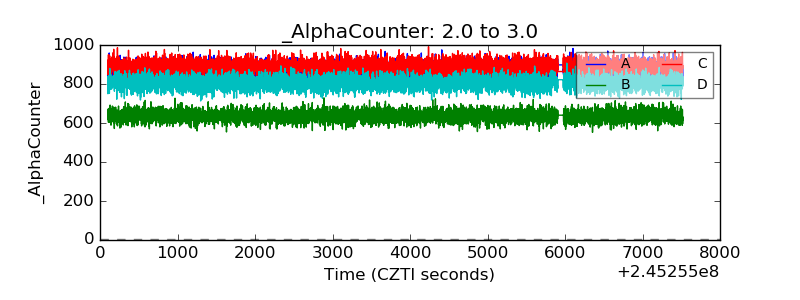 |
| _CPM_Rate | 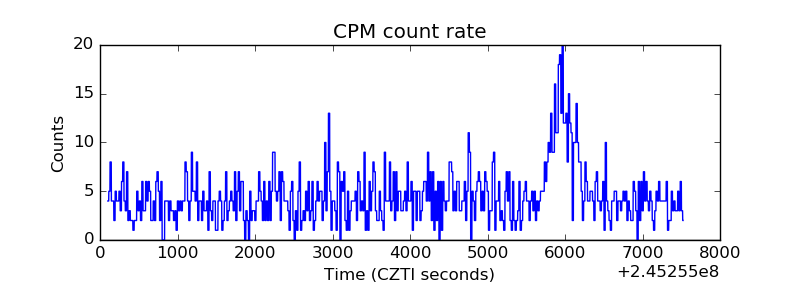 |
| CZT Counter | 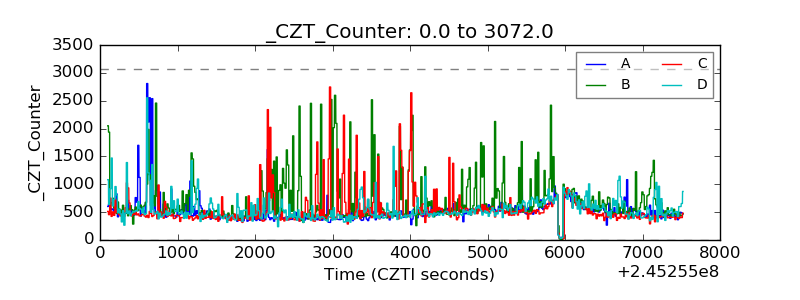 |
| +2.5 Volts monitor | 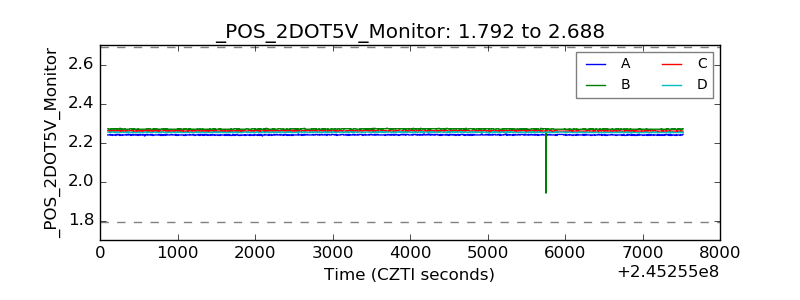 |
| +5 Volts monitor | 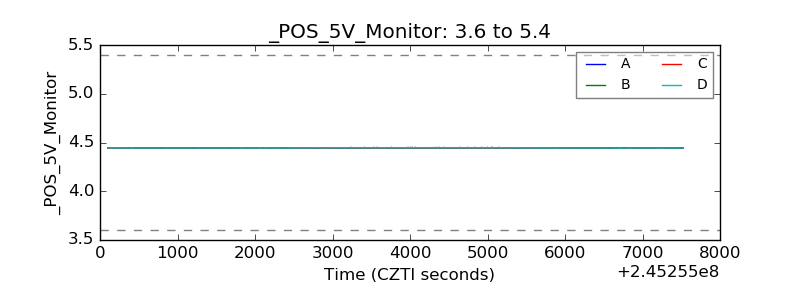 |
| _ROLL_ROT | 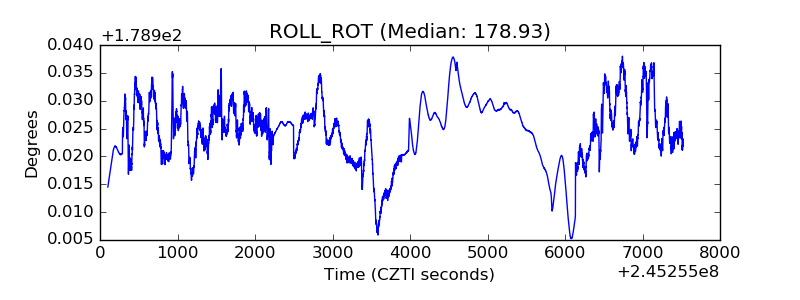 |
| _Roll_DEC | 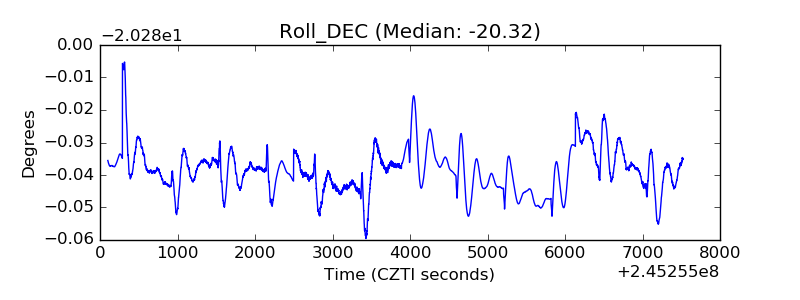 |
| _Roll_RA | 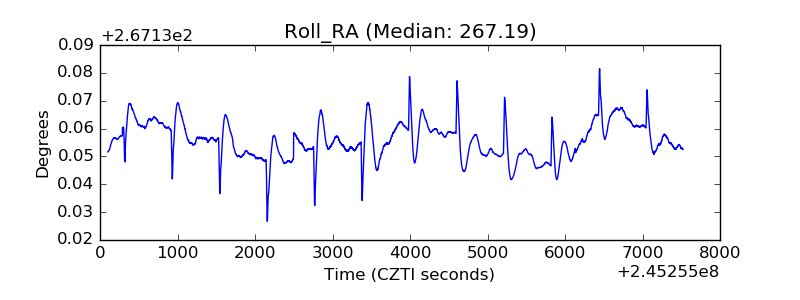 |
| Veto Counter | 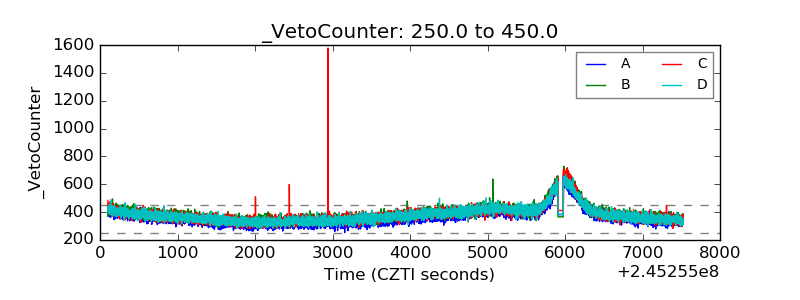 |