| Param | Original file | Final file |
|---|---|---|
| Filename | modeM0/AS1G08_027T06_9000001594_10991cztM0_level2.evt | modeM0/AS1G08_027T06_9000001594_10991cztM0_level2_quad_clean.evt |
| Size (bytes) | 623,036,160 | 105,750,720 |
| Size | 594.2 MB | 100.9 MB |
| Events in quadrant A | 5,143,967 | 658,651 |
| Events in quadrant B | 5,338,727 | 683,808 |
| Events in quadrant C | 3,503,676 | 675,890 |
| Events in quadrant D | 4,358,940 | 646,775 |
| Mode M9 | |||
|---|---|---|---|
| Quadrant | BADHDUFLAG | Total packets | Discarded packets |
| A | 0 | 2 | 0 |
| B | 0 | 2 | 0 |
| C | 0 | 2 | 0 |
| D | 0 | 2 | 0 |
| Mode M0 | |||
|---|---|---|---|
| Quadrant | BADHDUFLAG | Total packets | Discarded packets |
| A | 0 | 20526 | 2 |
| B | 0 | 21001 | 1 |
| C | 0 | 15972 | 1 |
| D | 0 | 18152 | 1 |
| Mode SS | |||
|---|---|---|---|
| Quadrant | BADHDUFLAG | Total packets | Discarded packets |
| A | 0 | 158 | 0 |
| B | 0 | 158 | 0 |
| C | 0 | 158 | 0 |
| D | 0 | 158 | 0 |
| Quadrant | Total seconds | Saturated seconds | Saturation percentage |
|---|---|---|---|
| A | 7719 | 566 | 7.332556% |
| B | 7719 | 418 | 5.415209% |
| C | 7719 | 34 | 0.440472% |
| D | 7719 | 67 | 0.867988% |
Noise dominated data is calculated using 1-second bins in cleaned event files. If a bin has >2000 counts, and if more than 50% of those come from <1% of pixels, then it is considered to be noise-dominated and hence unusable.
| Quadrant | # 1 sec bins | Bins with >0 counts | Bins with >2000 counts | High rate bins dominated by noise | Noise dominated (total time) | Noise dominated (detector-on time) | Marked lightcurve |
|---|---|---|---|---|---|---|---|
| A | 7949 | 7721 | 404 | 404 | 5.08% | 5.23% |  |
| B | 7949 | 7721 | 222 | 222 | 2.79% | 2.88% |  |
| C | 7949 | 7721 | 11 | 11 | 0.14% | 0.14% | 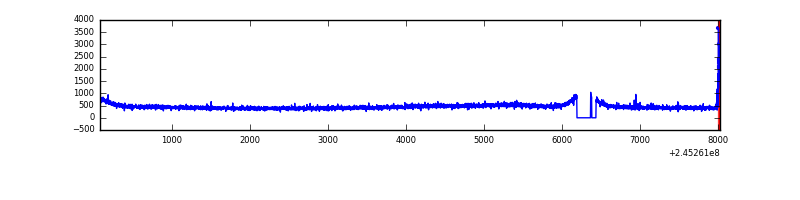 |
| D | 7949 | 7721 | 21 | 21 | 0.26% | 0.27% | 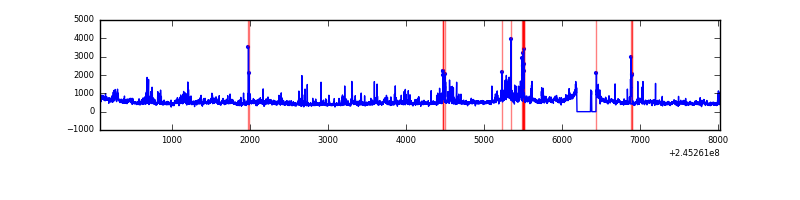 |
Top three noisy pixels from each quadrant. If the there are fewer than three noisy pixels in the level2.evt file, extra rows are filled as -1
| Pixel properties | Quadrant properties | ||||||
|---|---|---|---|---|---|---|---|
| Quadrant | DetID | PixID | Counts | Sigma | Mean | Median | Sigma |
| A | 8 | 5 | 1613735 | 8776.69 | 893 | 874 | 183.8 |
| A | 15 | 223 | 21789 | 113.81 | 893 | 874 | 183.8 |
| A | 8 | 15 | 19908 | 103.58 | 893 | 874 | 183.8 |
| B | 4 | 239 | 1484607 | 8554.12 | 906 | 886 | 173.5 |
| B | 3 | 189 | 74454 | 424.14 | 906 | 886 | 173.5 |
| B | 0 | 219 | 62313 | 354.14 | 906 | 886 | 173.5 |
| C | 4 | 254 | 48728 | 233.07 | 880 | 884 | 205.3 |
| C | 8 | 128 | 8471 | 36.96 | 880 | 884 | 205.3 |
| C | 13 | 61 | 6711 | 28.39 | 880 | 884 | 205.3 |
| D | 8 | 195 | 402610 | 1864.04 | 877 | 849 | 215.5 |
| D | 1 | 52 | 237772 | 1099.25 | 877 | 849 | 215.5 |
| D | 5 | 222 | 120519 | 555.23 | 877 | 849 | 215.5 |
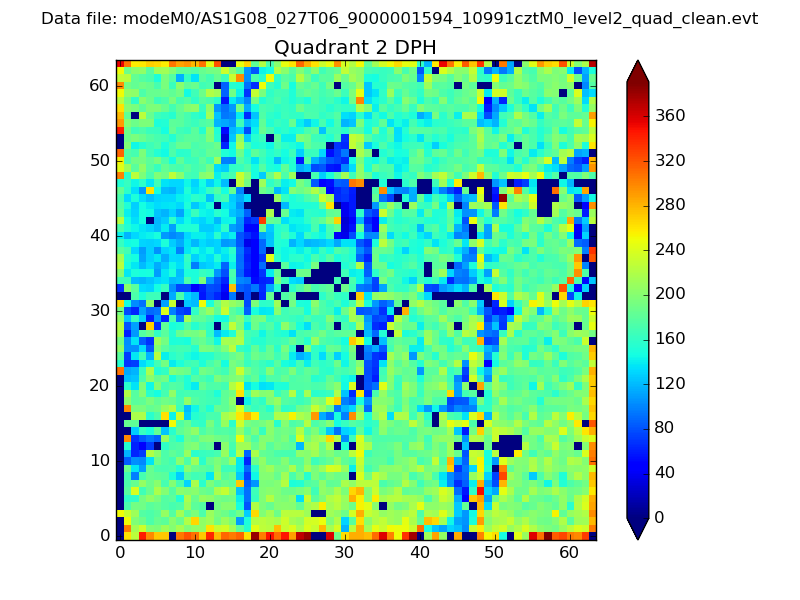
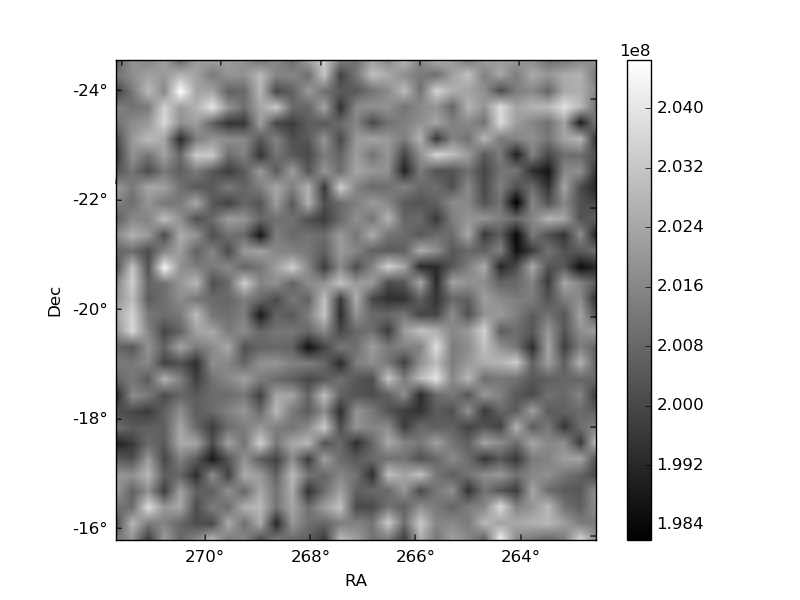
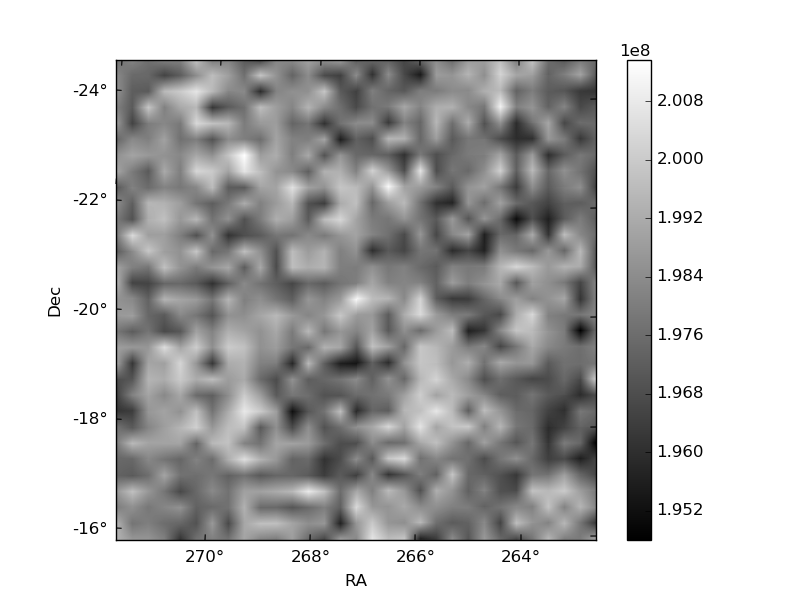
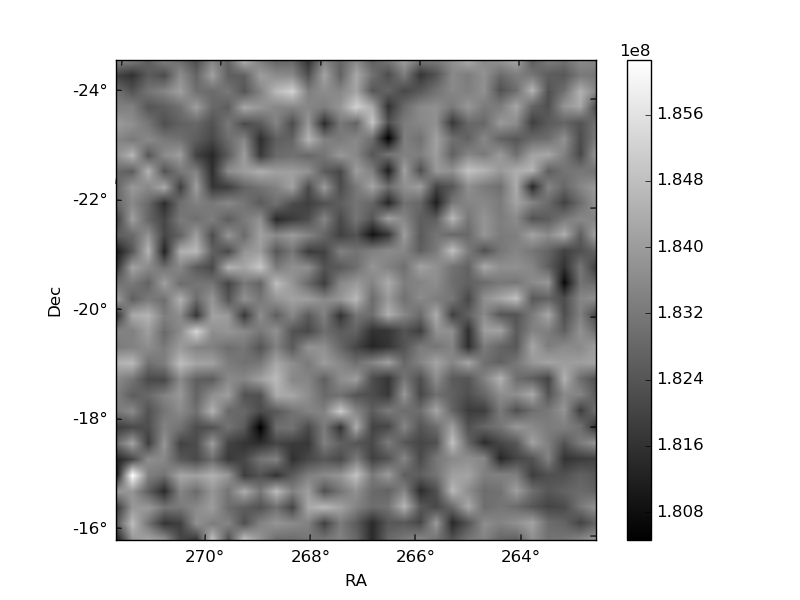
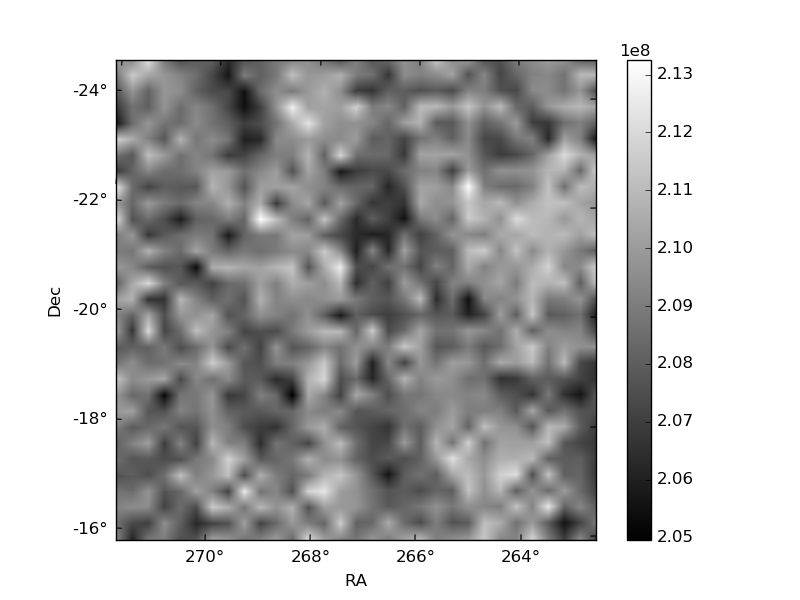
Histogram calculated using DETX and DETY for each event in the final _common_clean file
| Quadrant A | 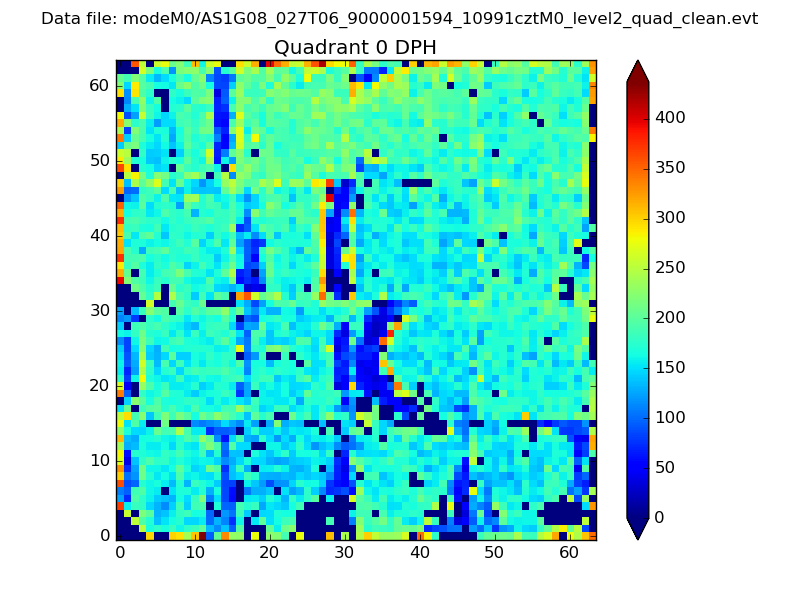 |
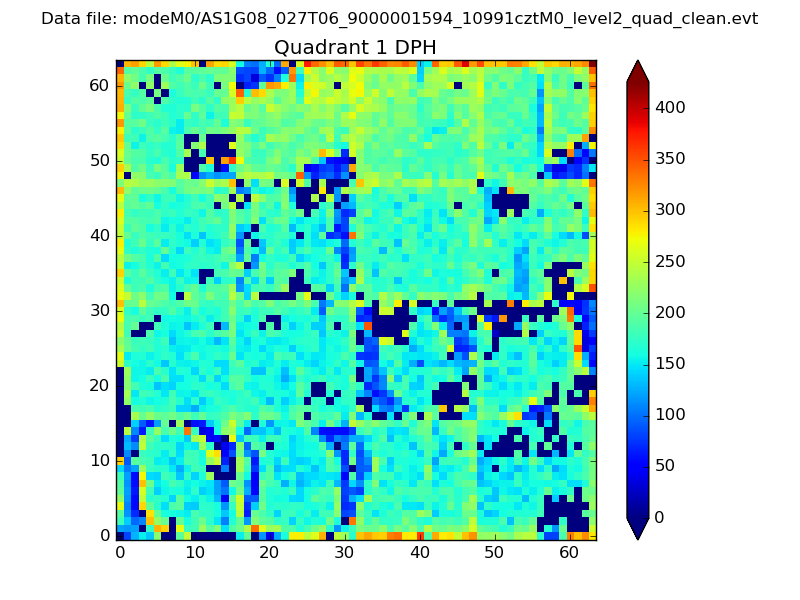 |
Quadrant B |
|---|---|---|---|
| Quadrant D | 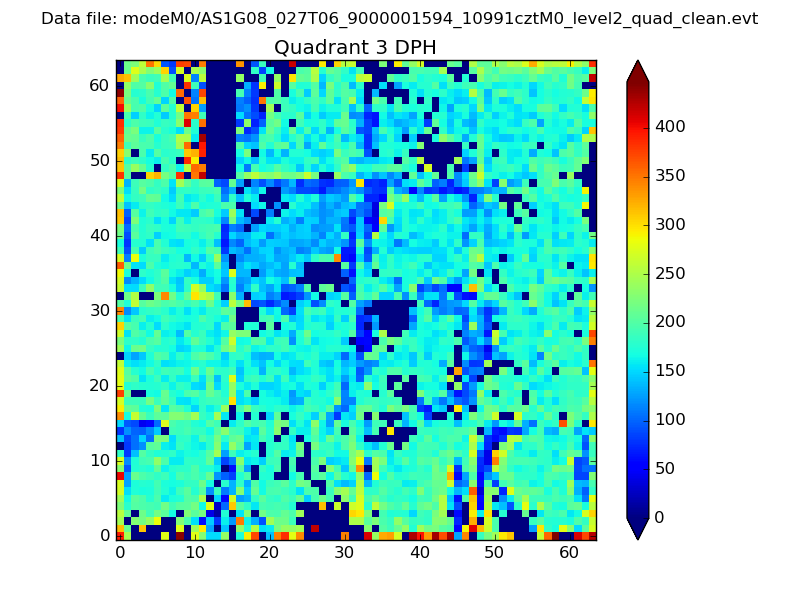 |
 |
Quadrant C |
| Plot type | Count rate plots | Images |
|---|---|---|
| Comparison with Poisson distribution Blue bars denote a histogram of data divided into 1 sec bins. Red curve is a Poisson curve with rate = median count rate of data. |
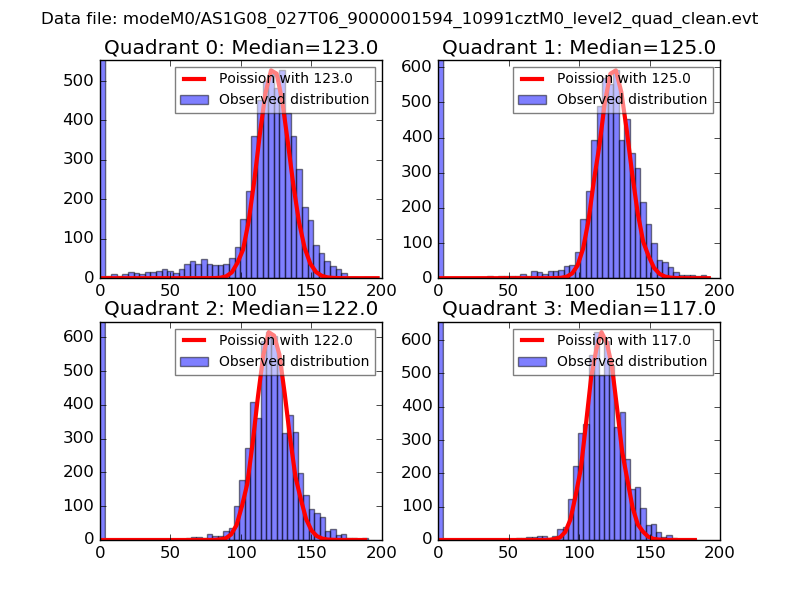 |
 |
| Quadrant-wise count rates Data is divided into 100 sec bins |
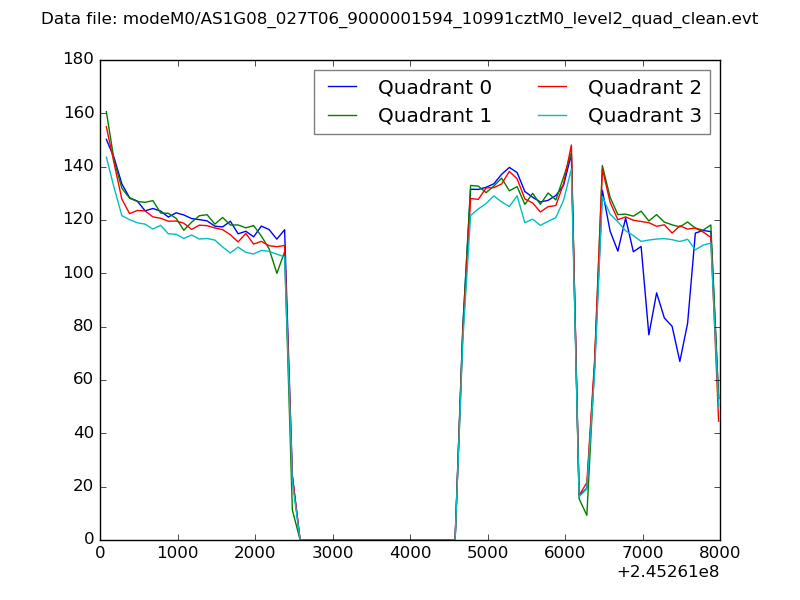 |
|
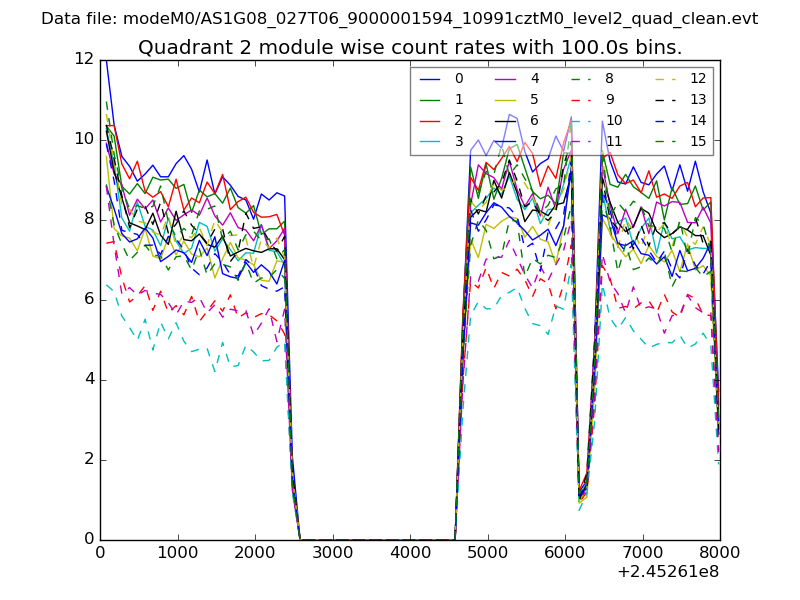
| Module-wise count rates for Quadrant A Data is divided into 100 sec bins |
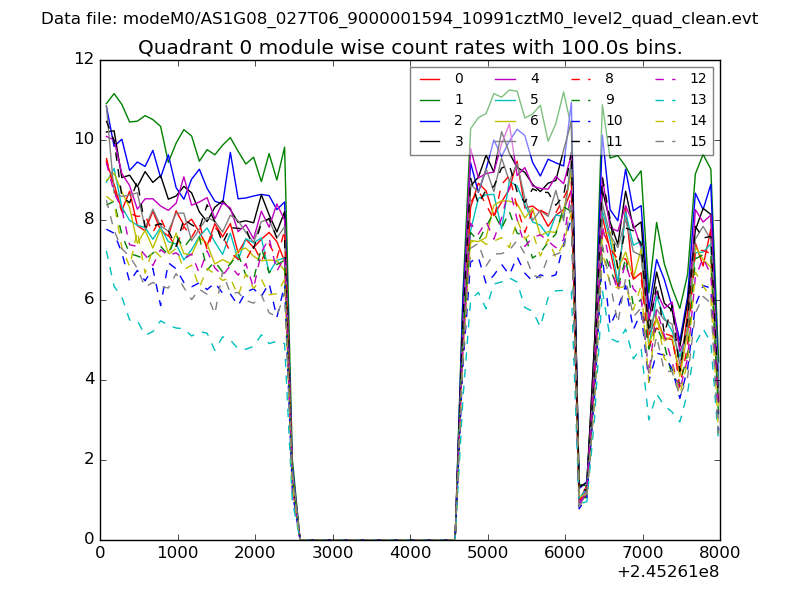 |
 |
| Module-wise count rates for Quadrant B Data is divided into 100 sec bins |
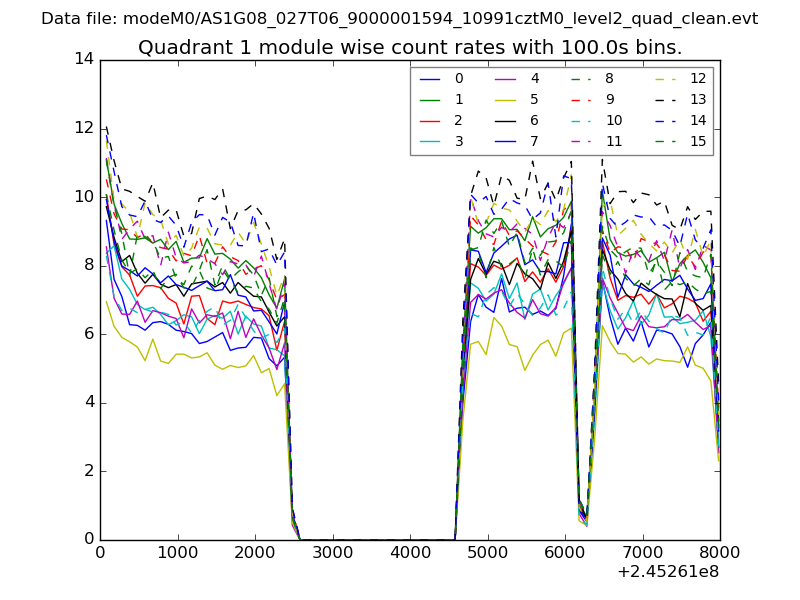 |
 |
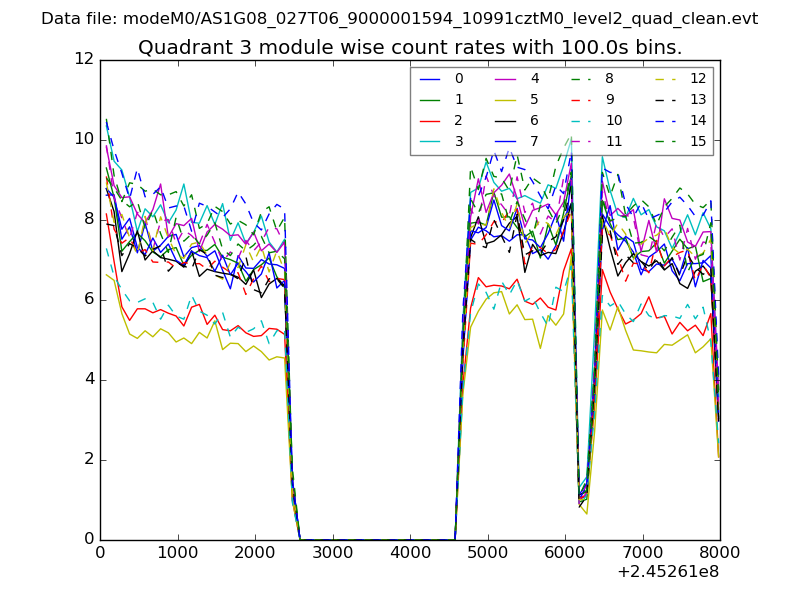
| Module-wise count rates for Quadrant C Data is divided into 100 sec bins |
 |
 |
| Module-wise count rates for Quadrant D Data is divided into 100 sec bins |
 |
 |
| Parameter | Plot |
|---|---|
| CZT HV Monitor | 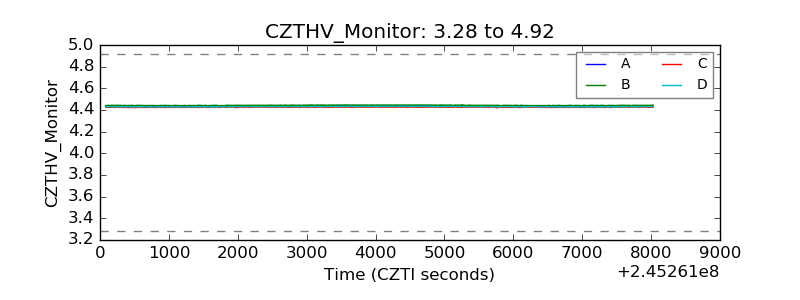 |
| D_VDD | 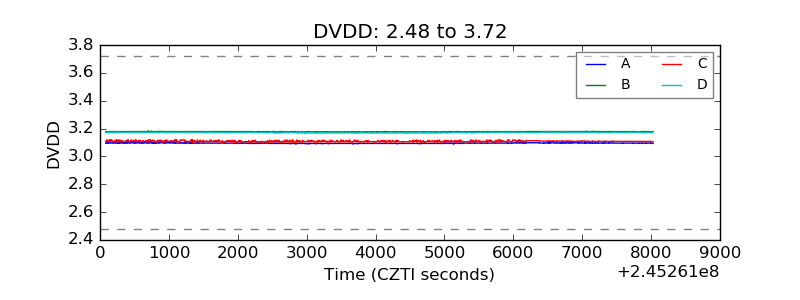 |
| Temperature 1 |  |
| Veto HV Monitor | 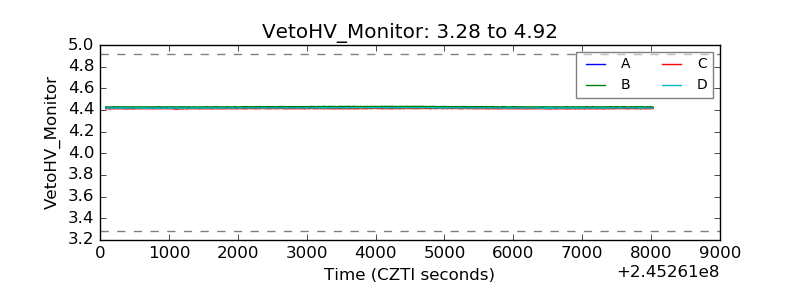 |
| Veto LLD |  |
| Alpha Counter | 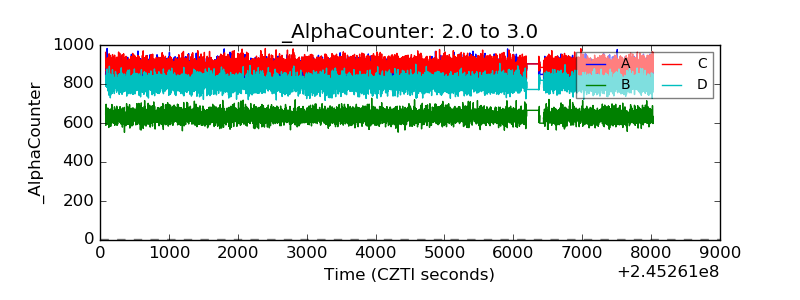 |
| _CPM_Rate | 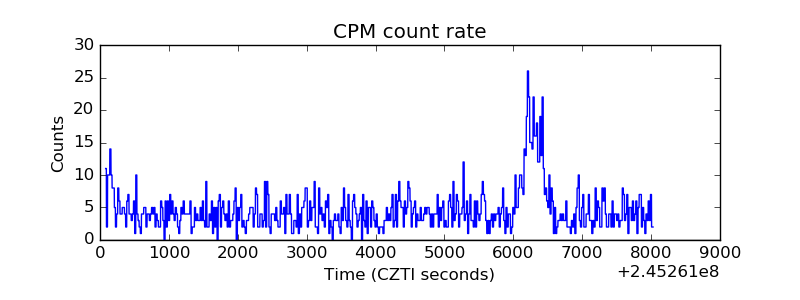 |
| CZT Counter | 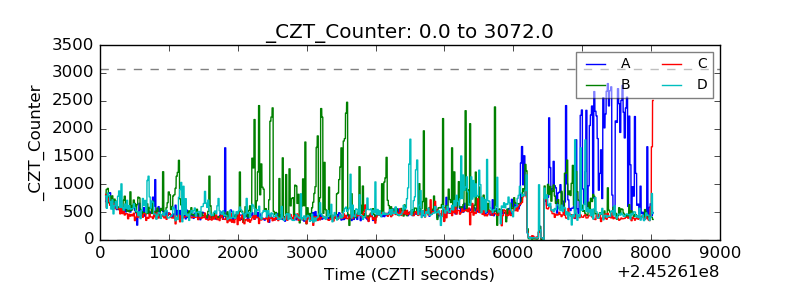 |
| +2.5 Volts monitor |  |
| +5 Volts monitor |  |
| _ROLL_ROT | 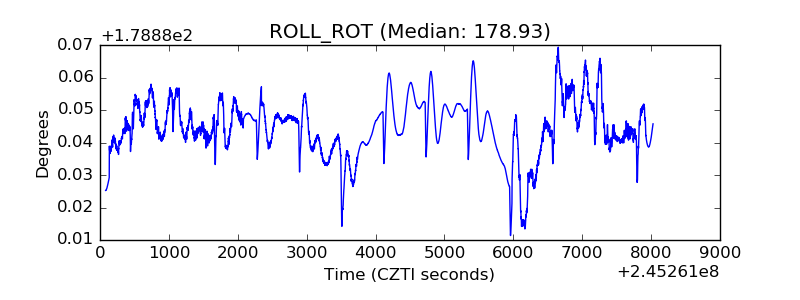 |
| _Roll_DEC | 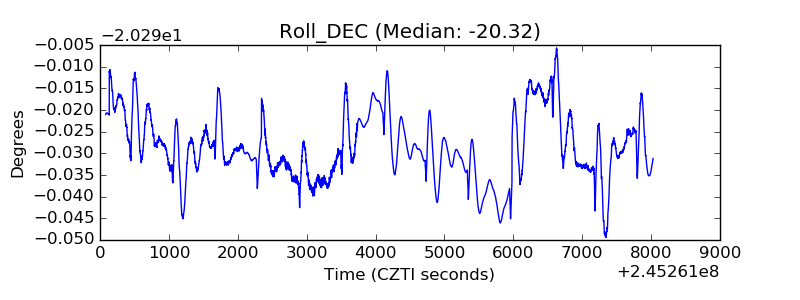 |
| _Roll_RA | 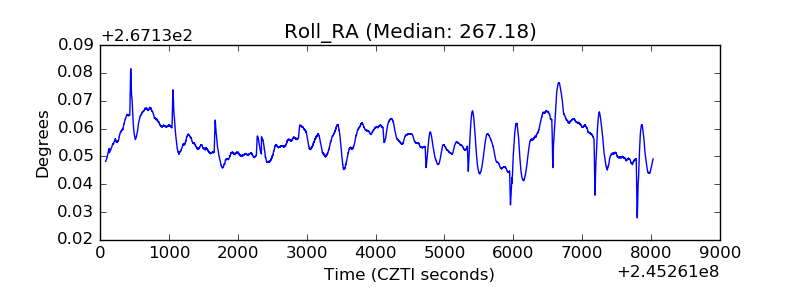 |
| Veto Counter | 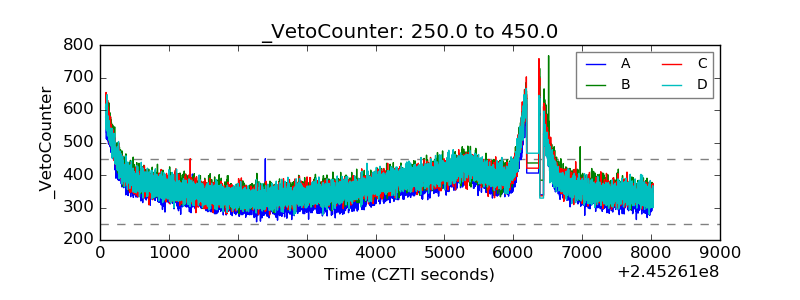 |