| Param | Original file | Final file |
|---|---|---|
| Filename | modeM0/AS1G08_027T06_9000001594_10994cztM0_level2.evt | modeM0/AS1G08_027T06_9000001594_10994cztM0_level2_quad_clean.evt |
| Size (bytes) | 1,624,760,640 | 214,773,120 |
| Size | 1.5 GB | 204.8 MB |
| Events in quadrant A | 13,946,512 | 1,294,088 |
| Events in quadrant B | 13,239,473 | 1,334,723 |
| Events in quadrant C | 10,295,328 | 1,321,098 |
| Events in quadrant D | 10,474,902 | 1,276,118 |
| Mode M9 | |||
|---|---|---|---|
| Quadrant | BADHDUFLAG | Total packets | Discarded packets |
| A | 0 | 22 | 0 |
| B | 0 | 22 | 0 |
| C | 0 | 22 | 0 |
| D | 0 | 22 | 0 |
| Mode M0 | |||
|---|---|---|---|
| Quadrant | BADHDUFLAG | Total packets | Discarded packets |
| A | 0 | 53804 | 5 |
| B | 0 | 51607 | 4 |
| C | 0 | 43644 | 4 |
| D | 0 | 43449 | 4 |
| Mode SS | |||
|---|---|---|---|
| Quadrant | BADHDUFLAG | Total packets | Discarded packets |
| A | 0 | 380 | 0 |
| B | 0 | 380 | 0 |
| C | 0 | 380 | 0 |
| D | 0 | 380 | 0 |
| Quadrant | Total seconds | Saturated seconds | Saturation percentage |
|---|---|---|---|
| A | 18540 | 1388 | 7.486516% |
| B | 18540 | 1078 | 5.814455% |
| C | 18540 | 668 | 3.603020% |
| D | 18540 | 328 | 1.769148% |
Noise dominated data is calculated using 1-second bins in cleaned event files. If a bin has >2000 counts, and if more than 50% of those come from <1% of pixels, then it is considered to be noise-dominated and hence unusable.
| Quadrant | # 1 sec bins | Bins with >0 counts | Bins with >2000 counts | High rate bins dominated by noise | Noise dominated (total time) | Noise dominated (detector-on time) | Marked lightcurve |
|---|---|---|---|---|---|---|---|
| A | 20760 | 18545 | 1053 | 1053 | 5.07% | 5.68% | 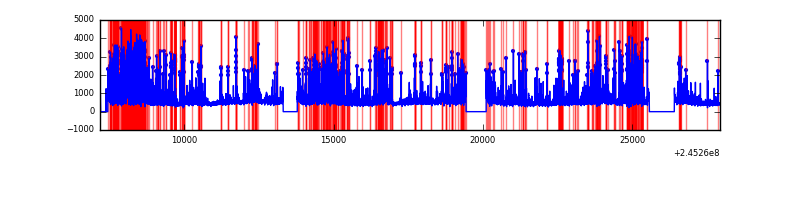 |
| B | 20760 | 18545 | 633 | 633 | 3.05% | 3.41% |  |
| C | 20760 | 18545 | 483 | 483 | 2.33% | 2.60% | 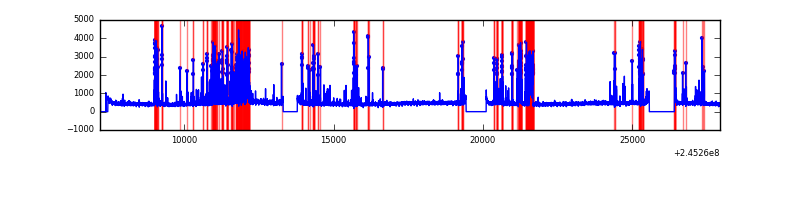 |
| D | 20760 | 18545 | 237 | 237 | 1.14% | 1.28% | 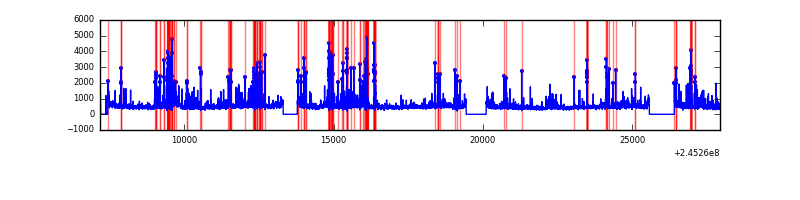 |
Top three noisy pixels from each quadrant. If the there are fewer than three noisy pixels in the level2.evt file, extra rows are filled as -1
| Pixel properties | Quadrant properties | ||||||
|---|---|---|---|---|---|---|---|
| Quadrant | DetID | PixID | Counts | Sigma | Mean | Median | Sigma |
| A | 8 | 5 | 5607960 | 13167.67 | 2099 | 2054 | 425.7 |
| A | 14 | 254 | 104588 | 240.84 | 2099 | 2054 | 425.7 |
| A | 0 | 12 | 64240 | 146.07 | 2099 | 2054 | 425.7 |
| B | 4 | 239 | 4175035 | 10187.26 | 2137 | 2084 | 409.6 |
| B | 0 | 214 | 164475 | 396.44 | 2137 | 2084 | 409.6 |
| B | 15 | 204 | 152482 | 367.16 | 2137 | 2084 | 409.6 |
| C | 4 | 254 | 2183611 | 4592.09 | 2053 | 2065 | 475.1 |
| C | 9 | 54 | 47756 | 96.18 | 2053 | 2065 | 475.1 |
| C | 4 | 238 | 31840 | 62.68 | 2053 | 2065 | 475.1 |
| D | 1 | 52 | 1157965 | 2110.38 | 2043 | 2002 | 547.7 |
| D | 8 | 195 | 502436 | 913.62 | 2043 | 2002 | 547.7 |
| D | 2 | 14 | 218354 | 394.98 | 2043 | 2002 | 547.7 |
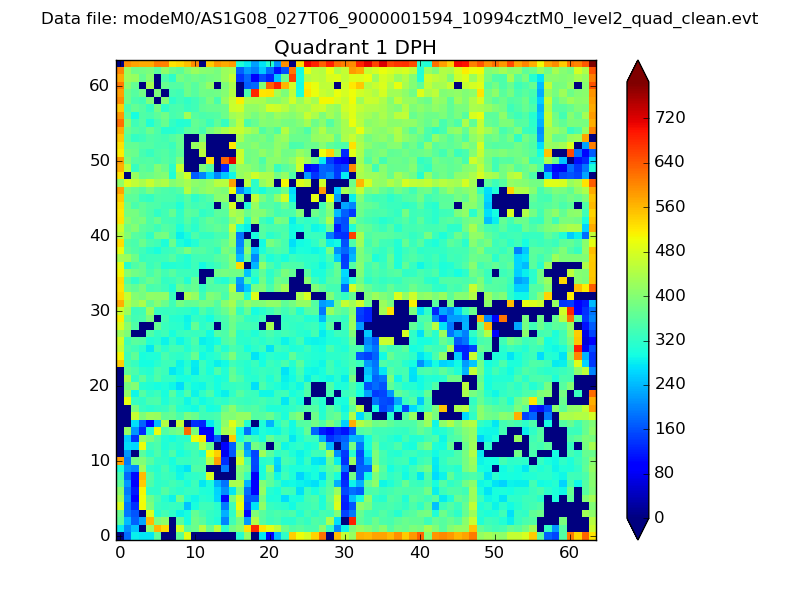
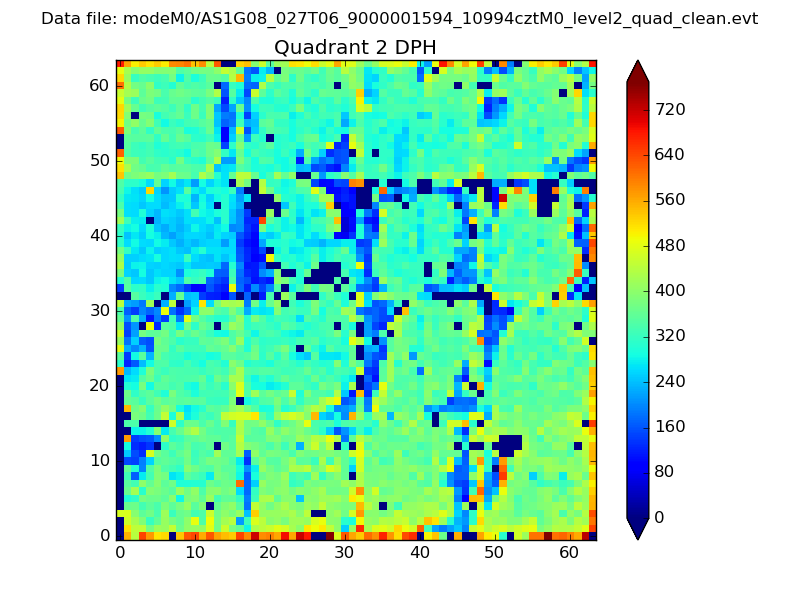
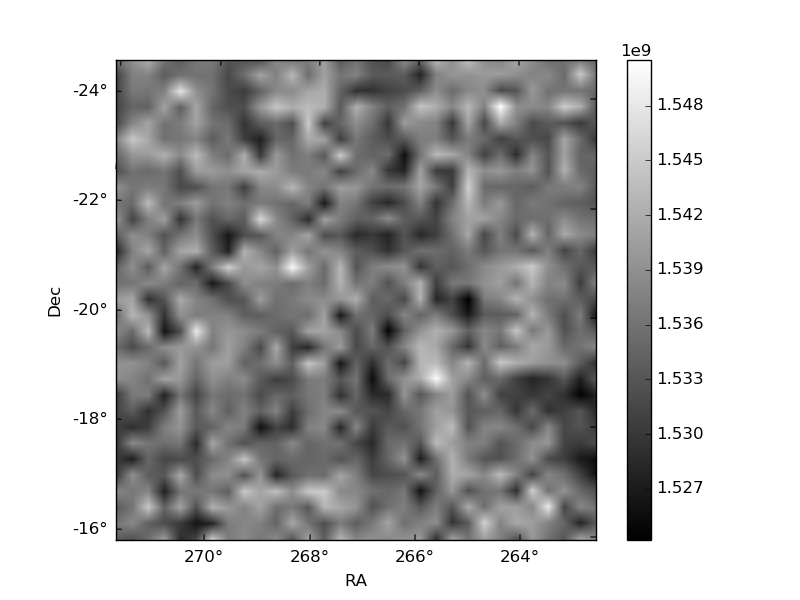
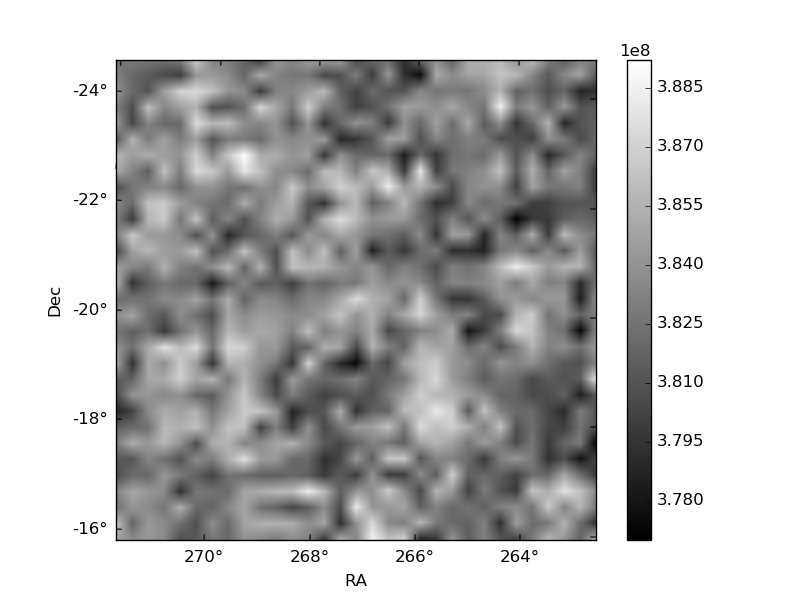
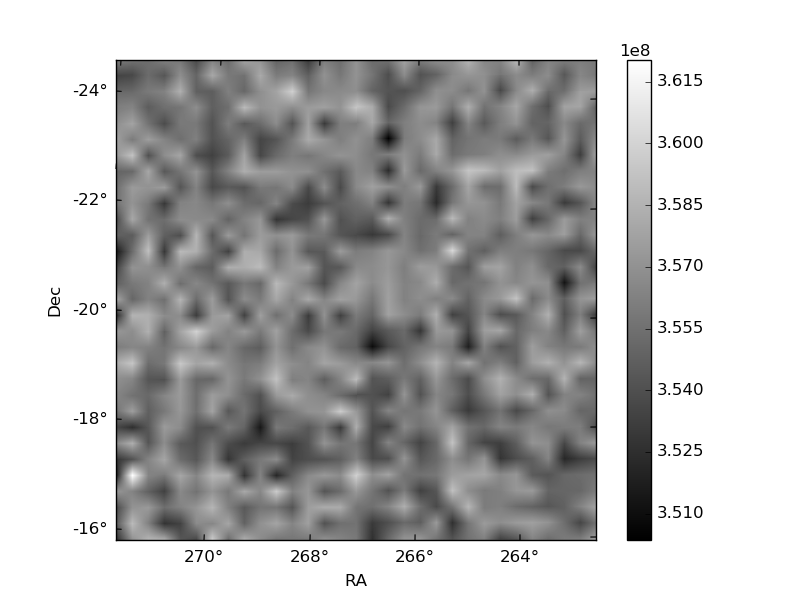
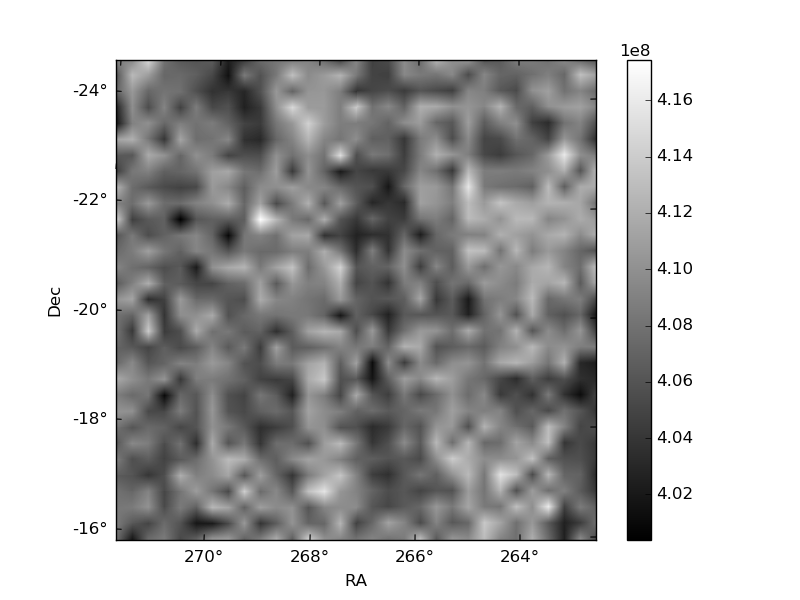
Histogram calculated using DETX and DETY for each event in the final _common_clean file
| Quadrant A | 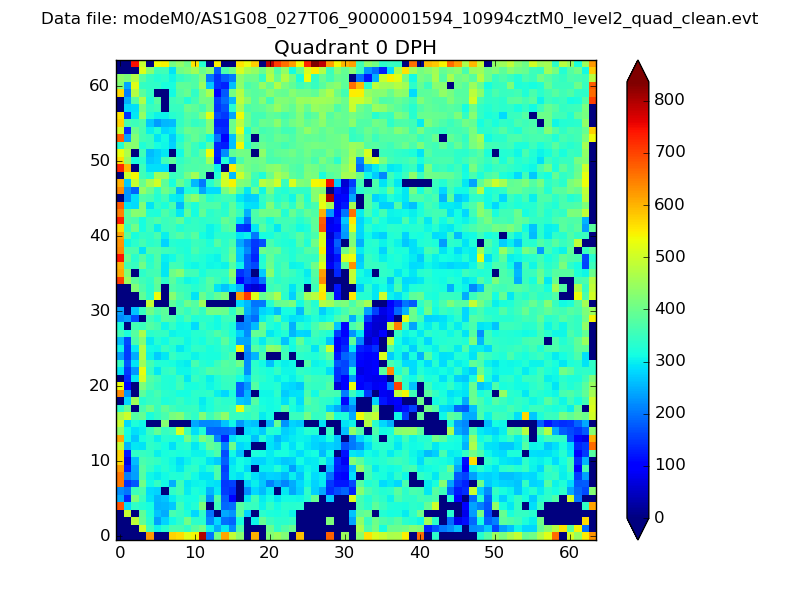 |
 |
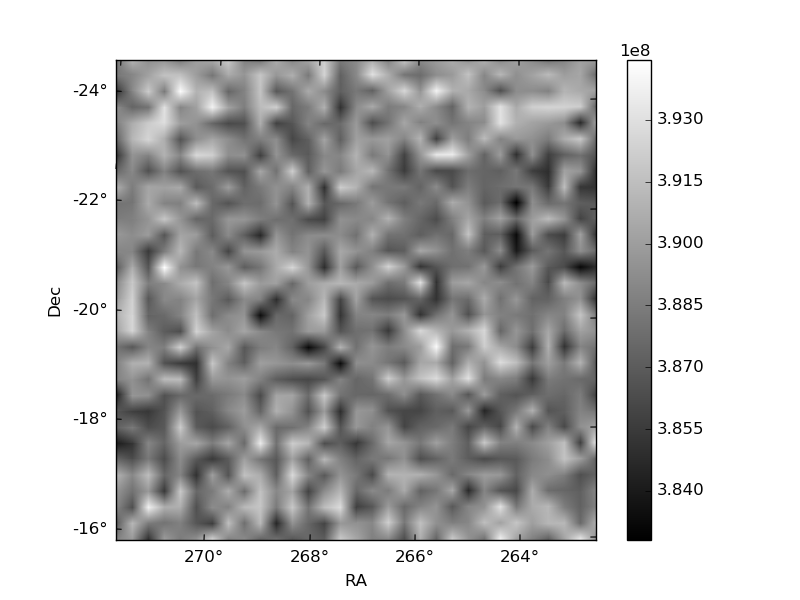
Quadrant B |
|---|---|---|---|
| Quadrant D | 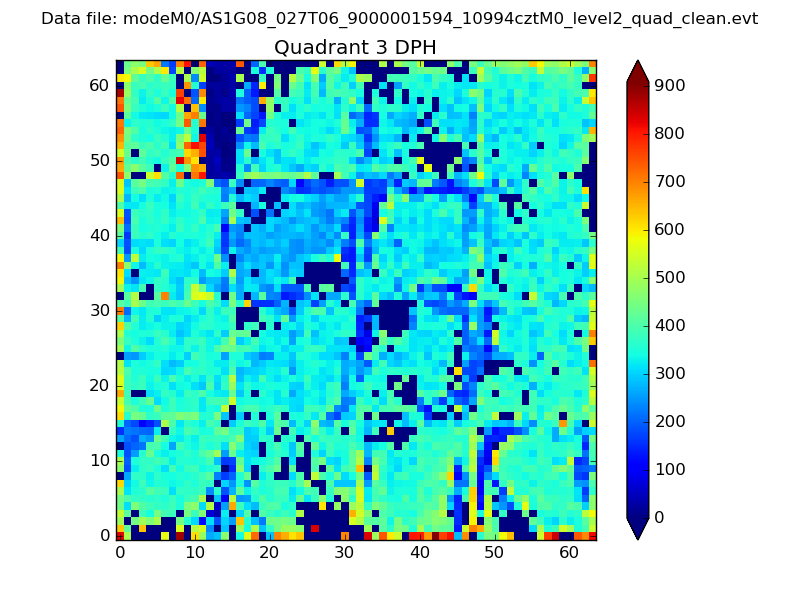 |
 |
Quadrant C |
| Plot type | Count rate plots | Images |
|---|---|---|
| Comparison with Poisson distribution Blue bars denote a histogram of data divided into 1 sec bins. Red curve is a Poisson curve with rate = median count rate of data. |
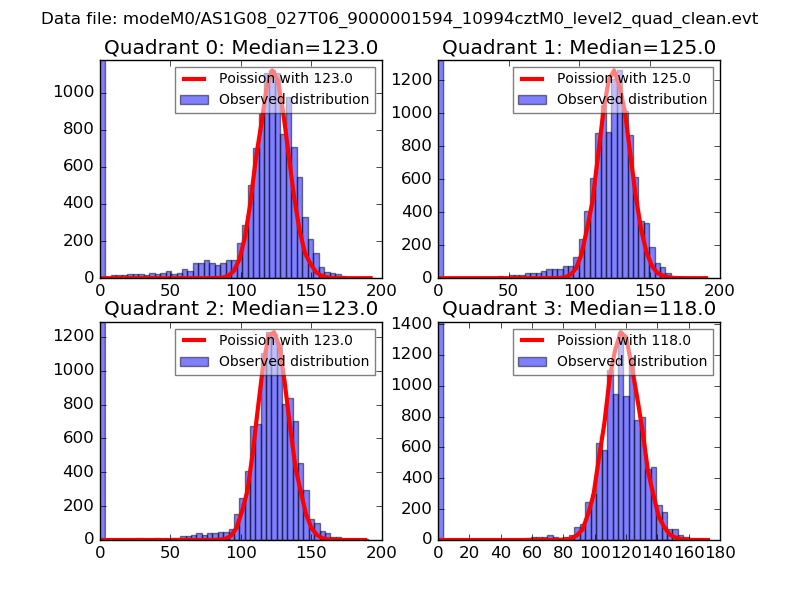 |
 |
| Quadrant-wise count rates Data is divided into 100 sec bins |
 |
|
| Module-wise count rates for Quadrant A Data is divided into 100 sec bins |
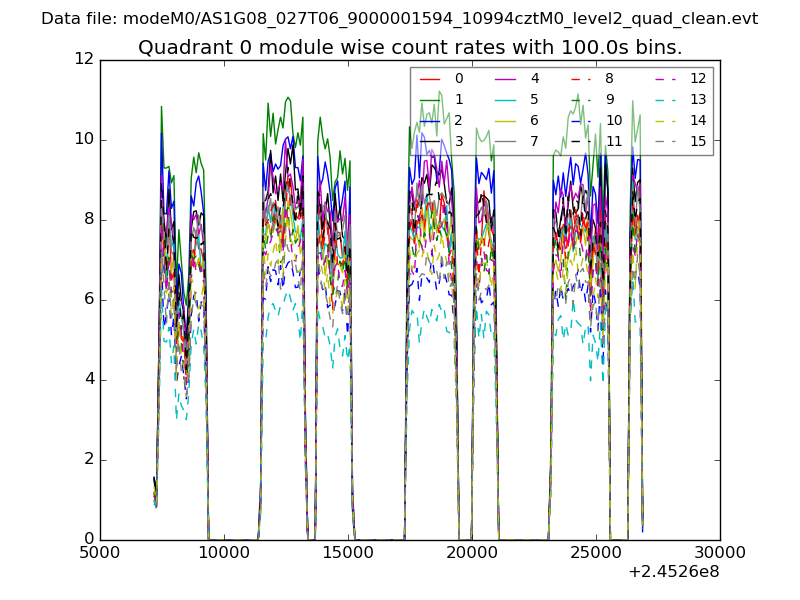 |
 |
| Module-wise count rates for Quadrant B Data is divided into 100 sec bins |
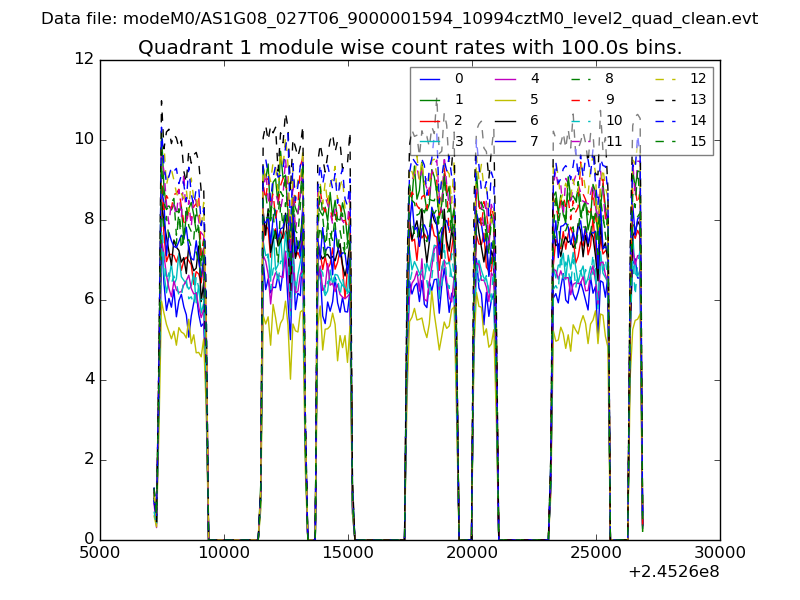 |
 |
| Module-wise count rates for Quadrant C Data is divided into 100 sec bins |
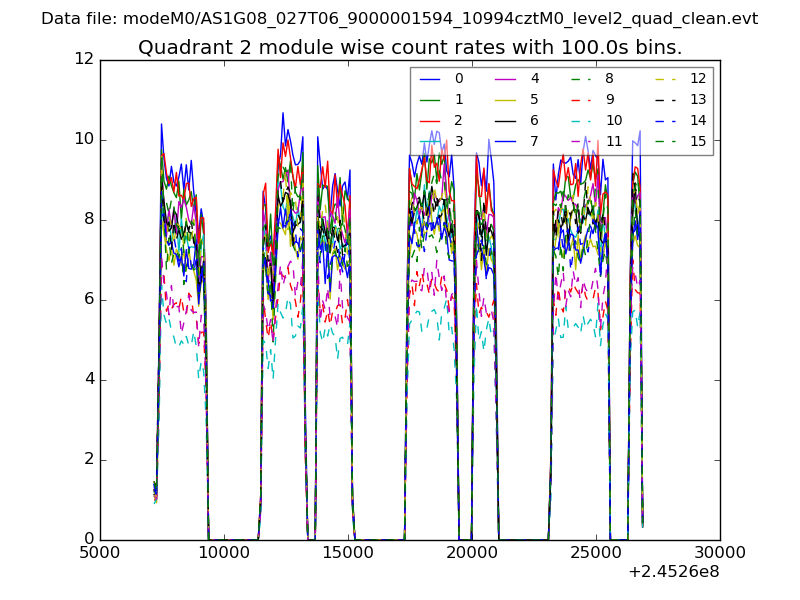 |
 |
| Module-wise count rates for Quadrant D Data is divided into 100 sec bins |
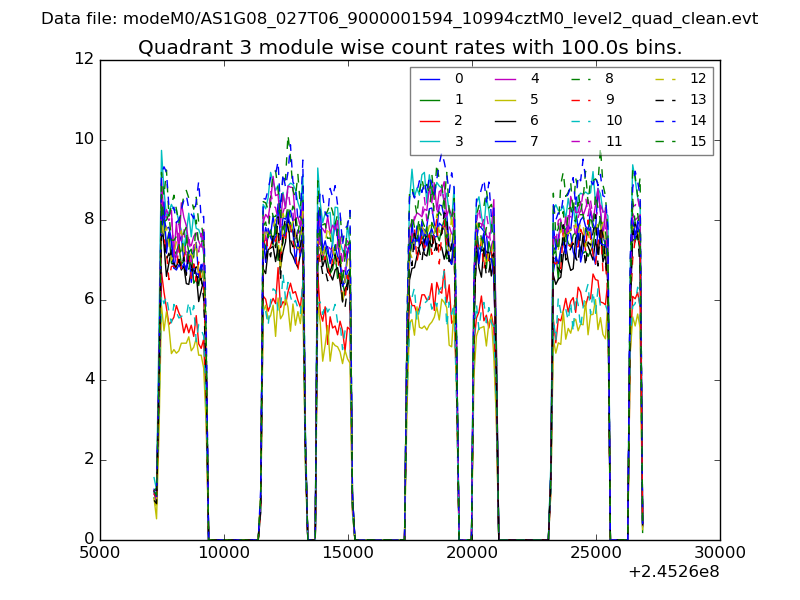 |
 |
| Parameter | Plot |
|---|---|
| CZT HV Monitor | 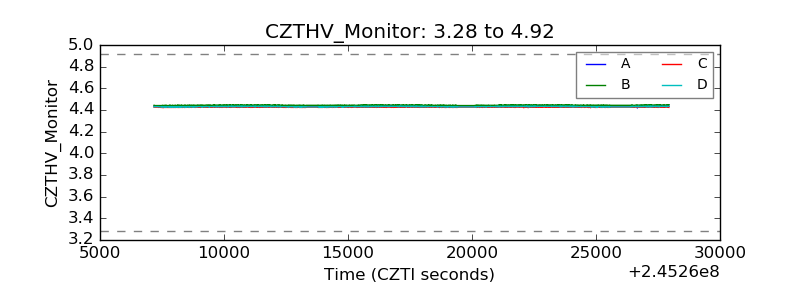 |
| D_VDD | 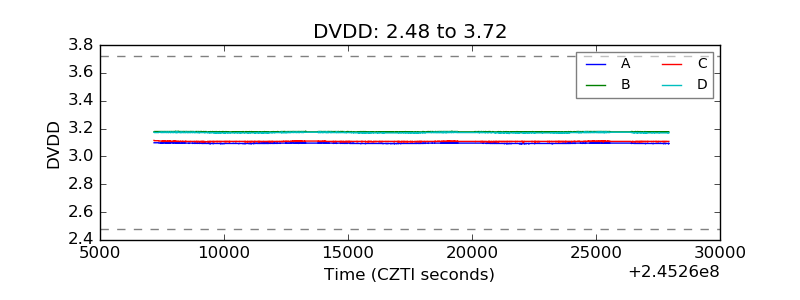 |
| Temperature 1 | 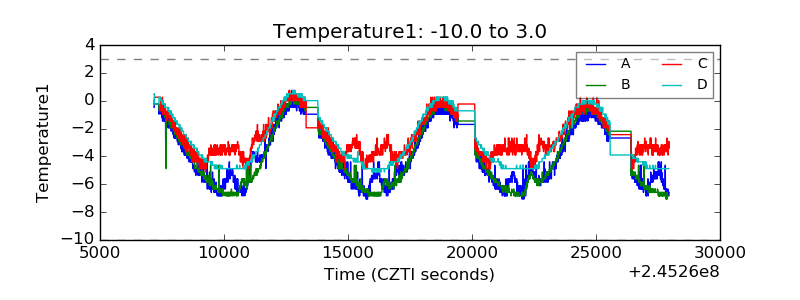 |
| Veto HV Monitor | 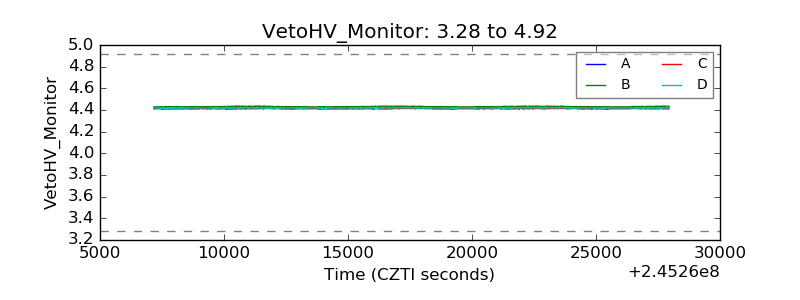 |
| Veto LLD | 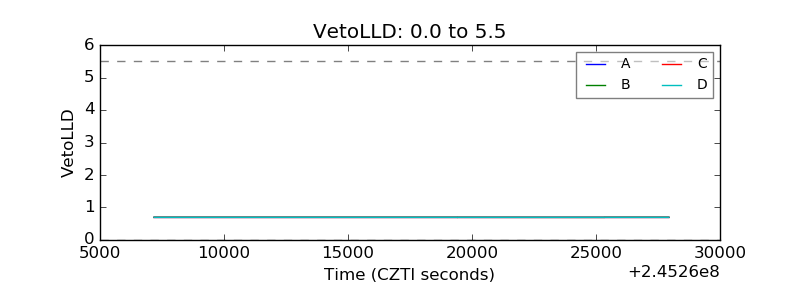 |
| Alpha Counter | 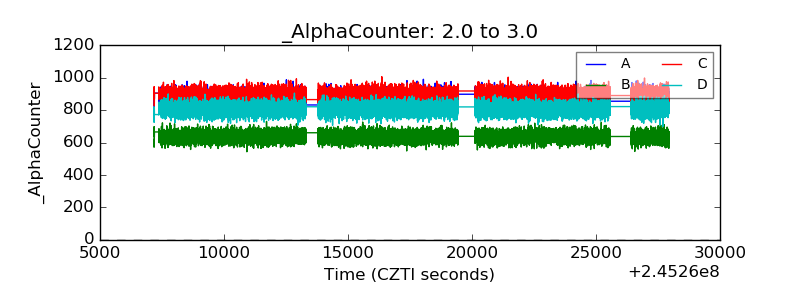 |
| _CPM_Rate | 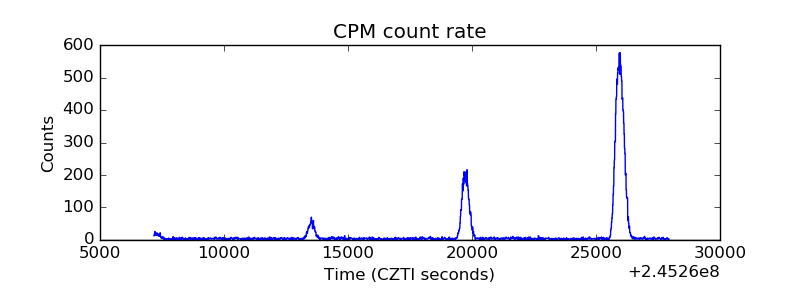 |
| CZT Counter | 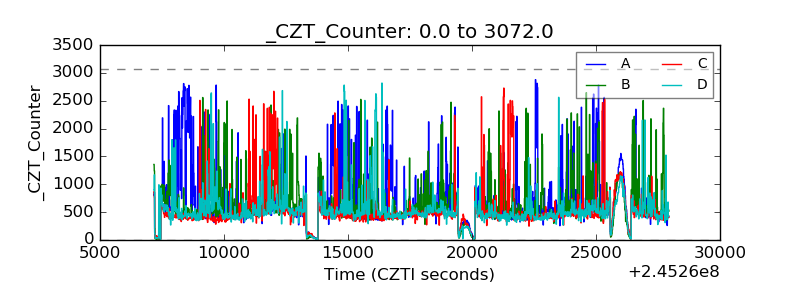 |
| +2.5 Volts monitor |  |
| +5 Volts monitor |  |
| _ROLL_ROT | 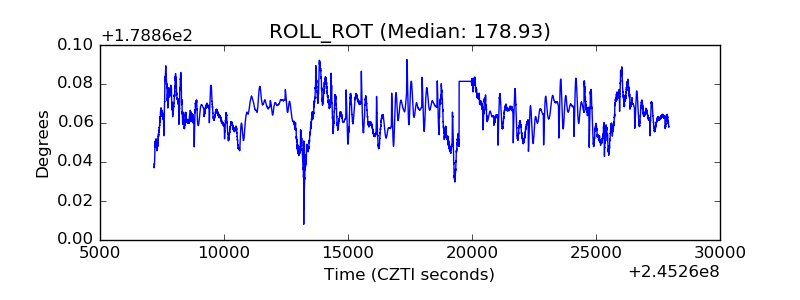 |
| _Roll_DEC | 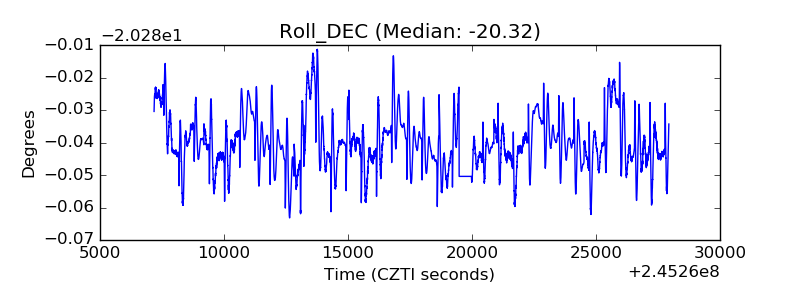 |
| _Roll_RA | 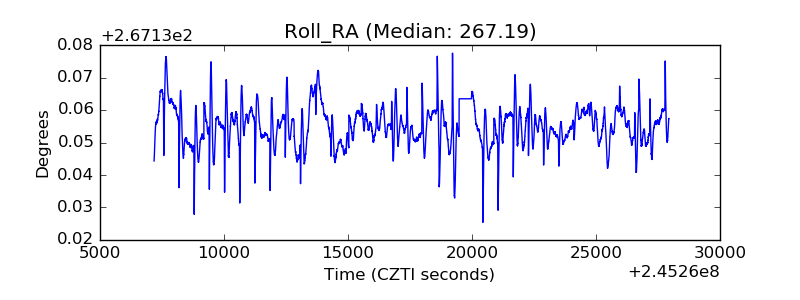 |
| Veto Counter | 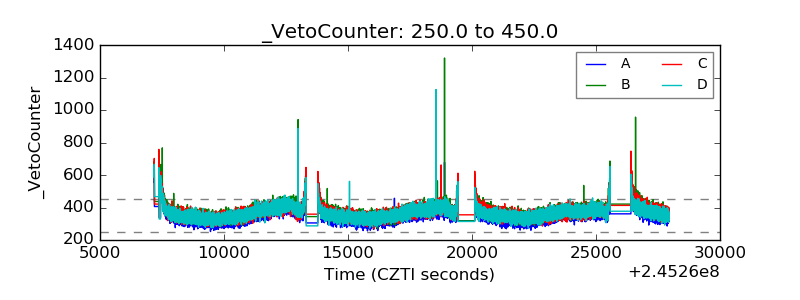 |