| Param | Original file | Final file |
|---|---|---|
| Filename | modeM0/AS1G08_027T06_9000001594_10995cztM0_level2.evt | modeM0/AS1G08_027T06_9000001594_10995cztM0_level2_quad_clean.evt |
| Size (bytes) | 550,952,640 | 66,706,560 |
| Size | 525.4 MB | 63.6 MB |
| Events in quadrant A | 3,887,458 | 394,636 |
| Events in quadrant B | 4,954,724 | 390,216 |
| Events in quadrant C | 3,160,000 | 390,422 |
| Events in quadrant D | 4,221,775 | 369,734 |
| Mode M9 | |||
|---|---|---|---|
| Quadrant | BADHDUFLAG | Total packets | Discarded packets |
| A | 0 | 13 | 0 |
| B | 0 | 13 | 0 |
| C | 0 | 13 | 0 |
| D | 0 | 14 | 0 |
| Mode M0 | |||
|---|---|---|---|
| Quadrant | BADHDUFLAG | Total packets | Discarded packets |
| A | 0 | 16013 | 3 |
| B | 0 | 19099 | 2 |
| C | 0 | 14107 | 2 |
| D | 0 | 17119 | 2 |
| Mode SS | |||
|---|---|---|---|
| Quadrant | BADHDUFLAG | Total packets | Discarded packets |
| A | 0 | 138 | 0 |
| B | 0 | 138 | 0 |
| C | 0 | 138 | 0 |
| D | 0 | 138 | 0 |
| Quadrant | Total seconds | Saturated seconds | Saturation percentage |
|---|---|---|---|
| A | 6810 | 180 | 2.643172% |
| B | 6810 | 455 | 6.681351% |
| C | 6810 | 66 | 0.969163% |
| D | 6810 | 175 | 2.569750% |
Noise dominated data is calculated using 1-second bins in cleaned event files. If a bin has >2000 counts, and if more than 50% of those come from <1% of pixels, then it is considered to be noise-dominated and hence unusable.
| Quadrant | # 1 sec bins | Bins with >0 counts | Bins with >2000 counts | High rate bins dominated by noise | Noise dominated (total time) | Noise dominated (detector-on time) | Marked lightcurve |
|---|---|---|---|---|---|---|---|
| A | 7785 | 6810 | 91 | 91 | 1.17% | 1.34% |  |
| B | 7785 | 6810 | 247 | 247 | 3.17% | 3.63% |  |
| C | 7785 | 6810 | 13 | 13 | 0.17% | 0.19% | 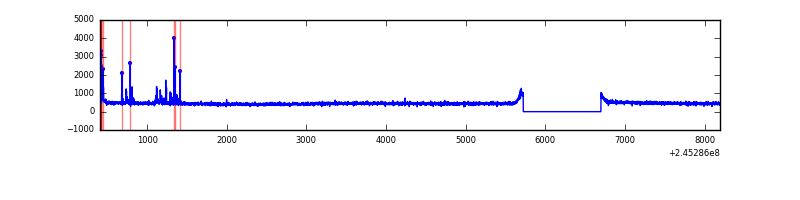 |
| D | 7785 | 6810 | 94 | 94 | 1.21% | 1.38% |  |
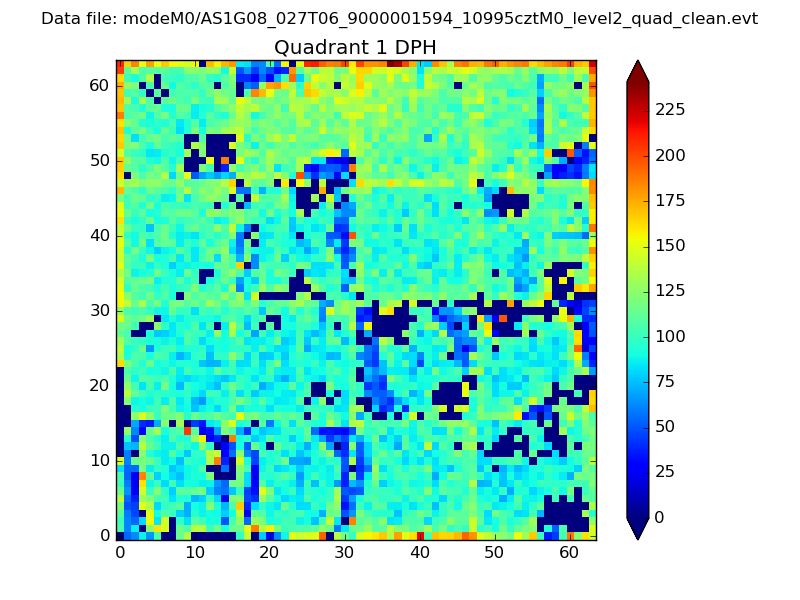
Top three noisy pixels from each quadrant. If the there are fewer than three noisy pixels in the level2.evt file, extra rows are filled as -1
| Pixel properties | Quadrant properties | ||||||
|---|---|---|---|---|---|---|---|
| Quadrant | DetID | PixID | Counts | Sigma | Mean | Median | Sigma |
| A | 8 | 5 | 649359 | 3935.66 | 805 | 788 | 164.8 |
| A | 14 | 254 | 123109 | 742.27 | 805 | 788 | 164.8 |
| A | 15 | 239 | 9381 | 52.14 | 805 | 788 | 164.8 |
| B | 4 | 239 | 1641982 | 10659.48 | 804 | 782 | 154.0 |
| B | 0 | 214 | 62431 | 400.41 | 804 | 782 | 154.0 |
| B | 3 | 189 | 30664 | 194.08 | 804 | 782 | 154.0 |
| C | 4 | 254 | 93080 | 505.08 | 785 | 787 | 182.7 |
| C | 4 | 238 | 6222 | 29.74 | 785 | 787 | 182.7 |
| C | 13 | 61 | 5867 | 27.8 | 785 | 787 | 182.7 |
| D | 1 | 52 | 774247 | 3860.62 | 768 | 752 | 200.4 |
| D | 11 | 129 | 193497 | 962.02 | 768 | 752 | 200.4 |
| D | 10 | 253 | 85753 | 424.25 | 768 | 752 | 200.4 |
Histogram calculated using DETX and DETY for each event in the final _common_clean file
| Quadrant A |  |
 |
Quadrant B |
|---|---|---|---|
| Quadrant D | 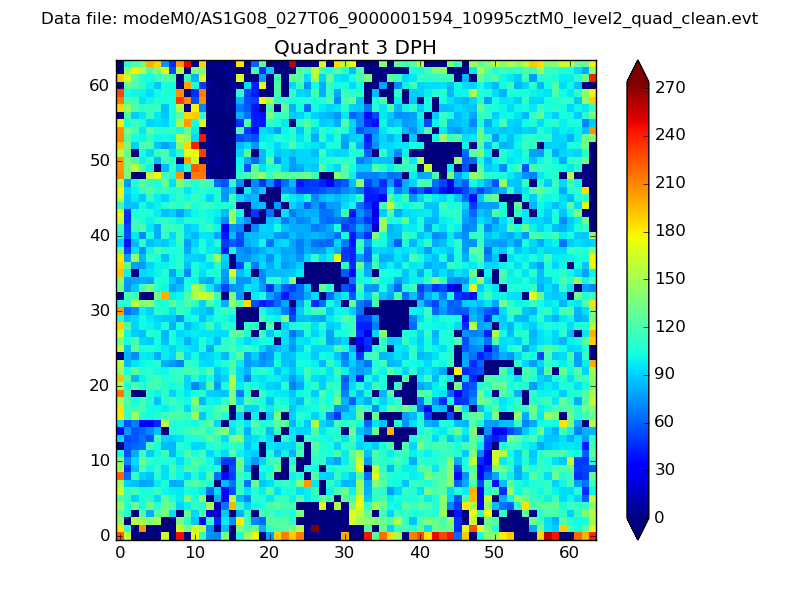 |
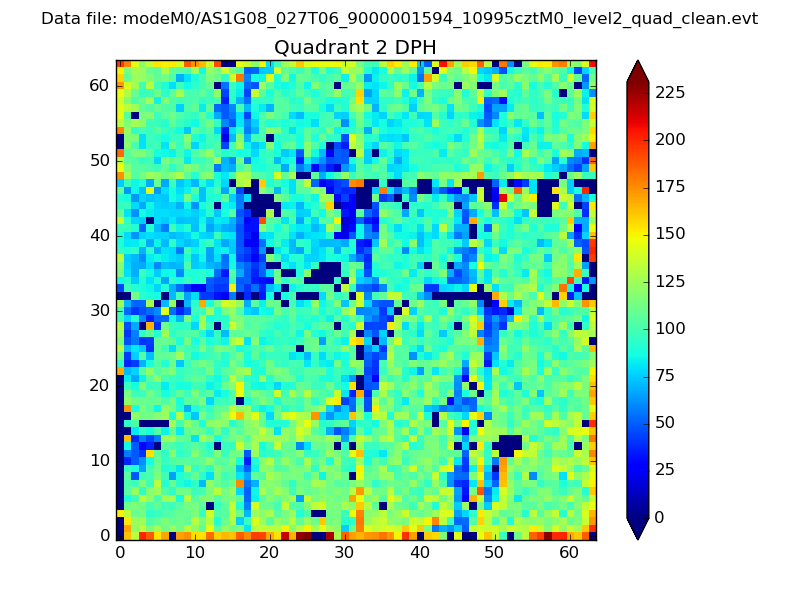 |
Quadrant C |
| Plot type | Count rate plots | Images |
|---|---|---|
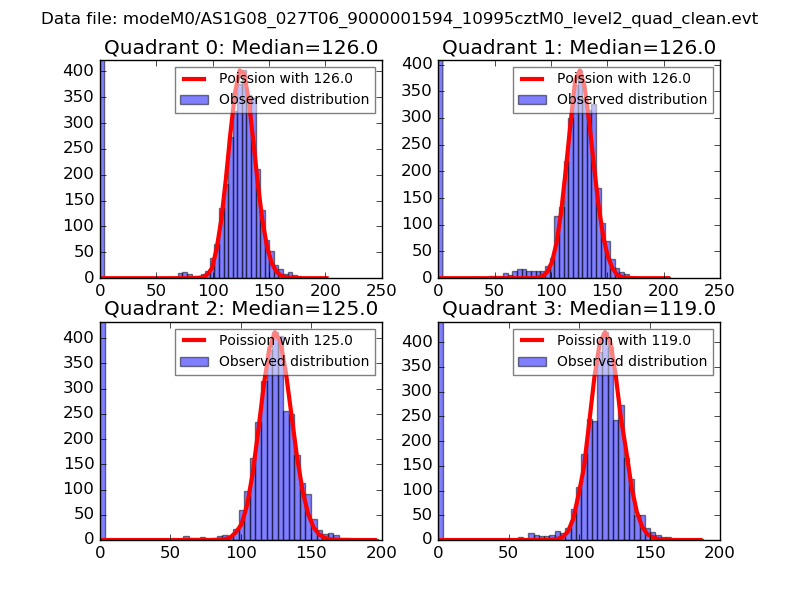
| Comparison with Poisson distribution Blue bars denote a histogram of data divided into 1 sec bins. Red curve is a Poisson curve with rate = median count rate of data. |
 |
 |
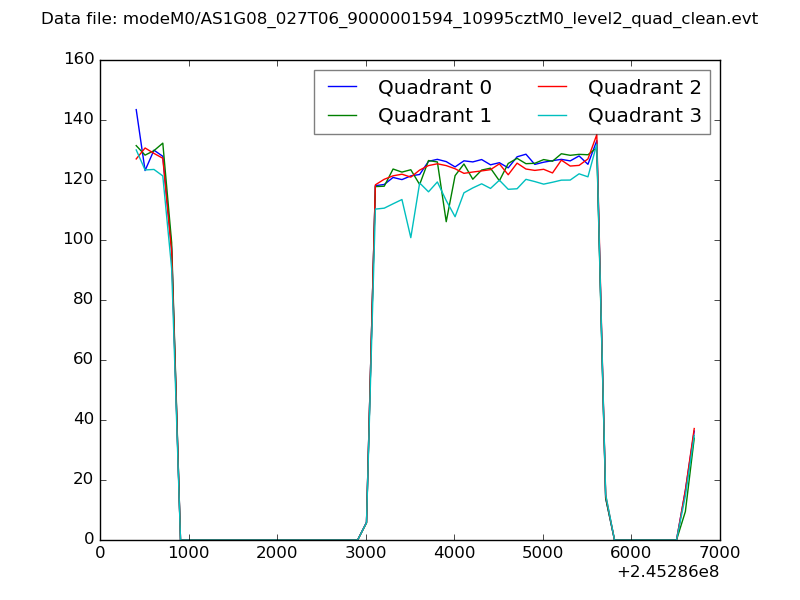
| Quadrant-wise count rates Data is divided into 100 sec bins |
 |
|
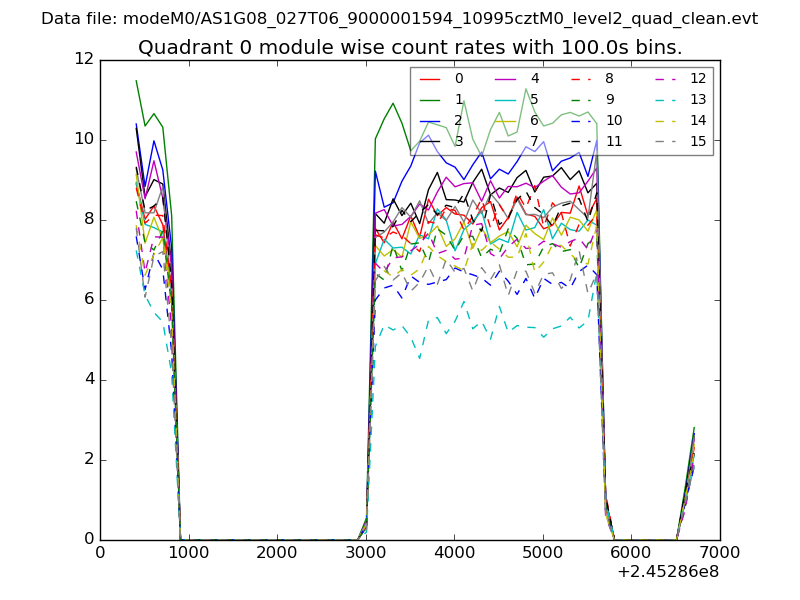
| Module-wise count rates for Quadrant A Data is divided into 100 sec bins |
 |
 |
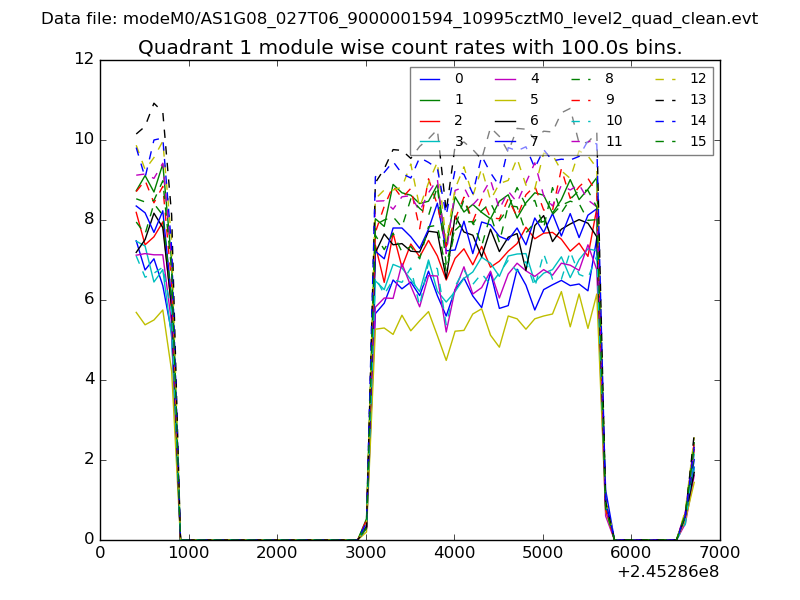
| Module-wise count rates for Quadrant B Data is divided into 100 sec bins |
 |
 |
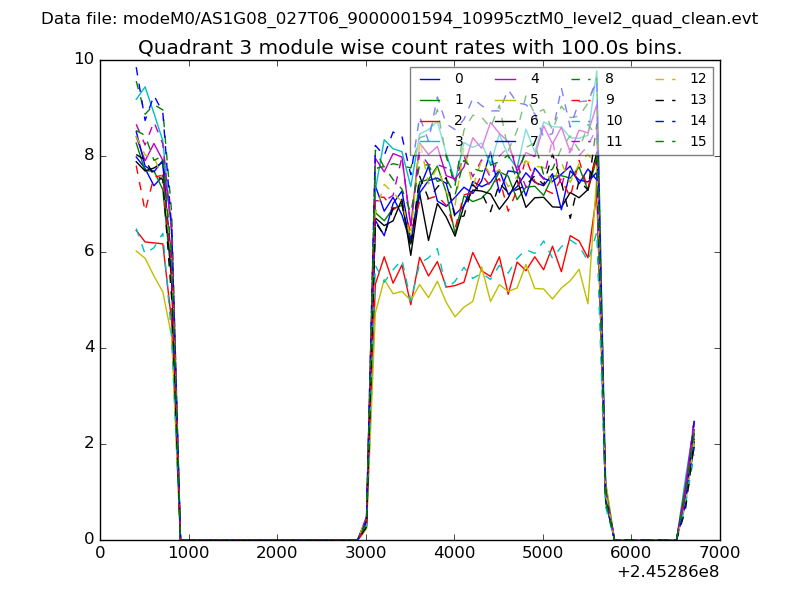
| Module-wise count rates for Quadrant C Data is divided into 100 sec bins |
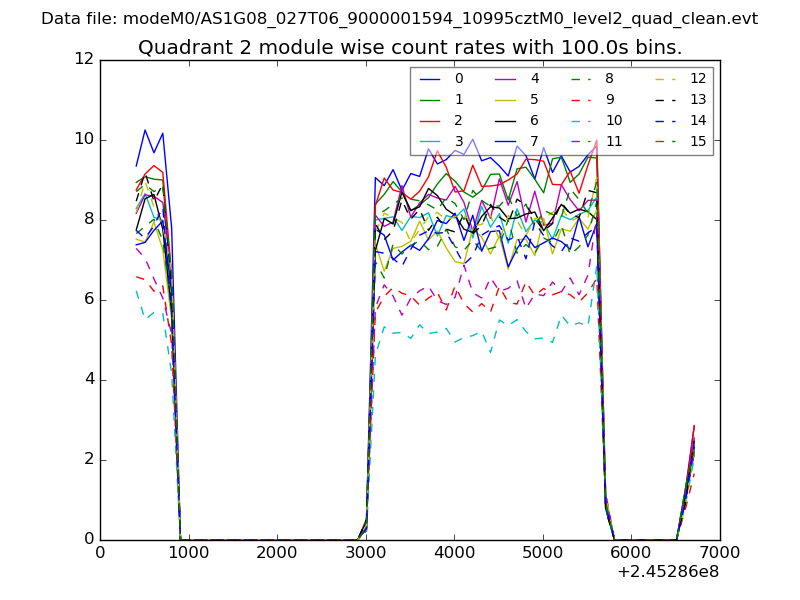 |
 |
| Module-wise count rates for Quadrant D Data is divided into 100 sec bins |
 |
 |
| Parameter | Plot |
|---|---|
| CZT HV Monitor | 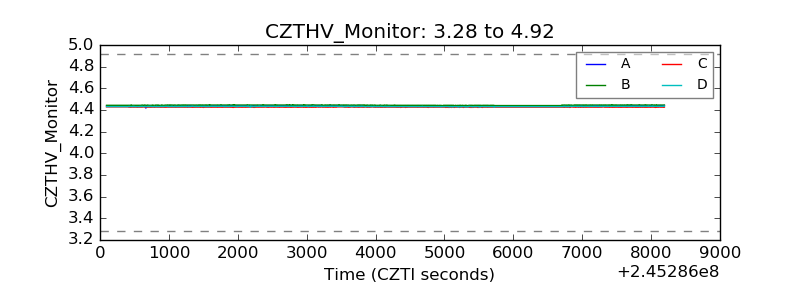 |
| D_VDD | 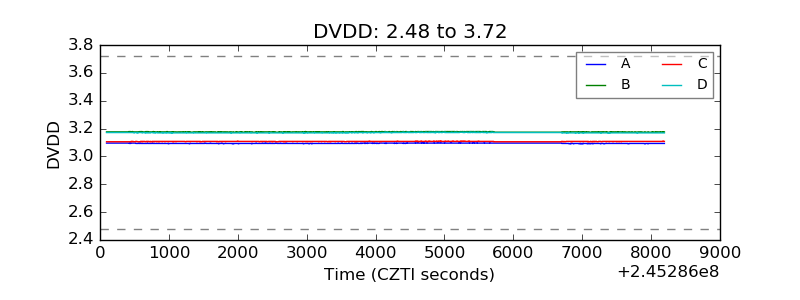 |
| Temperature 1 | 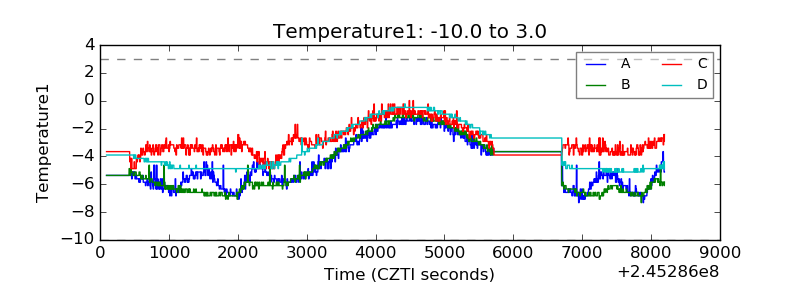 |
| Veto HV Monitor | 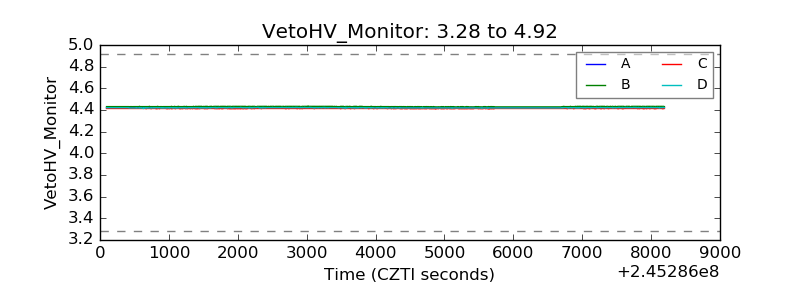 |
| Veto LLD |  |
| Alpha Counter | 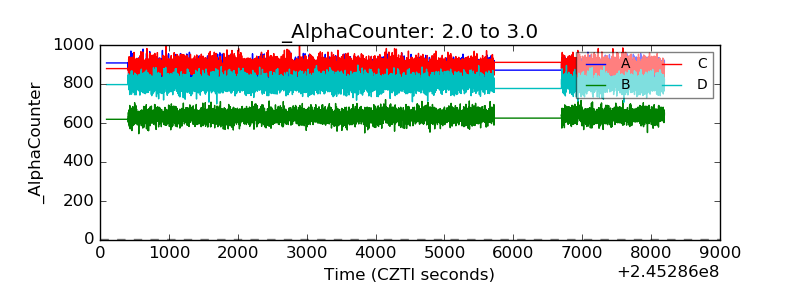 |
| _CPM_Rate | 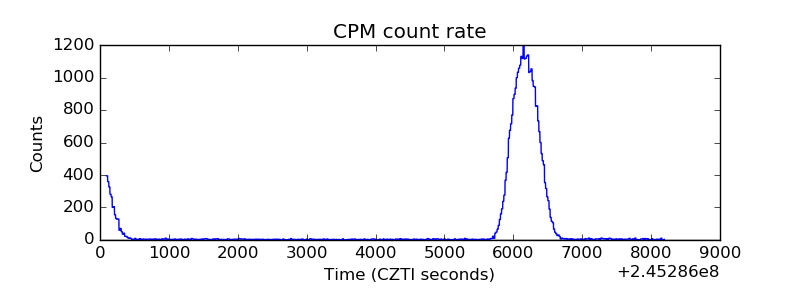 |
| CZT Counter | 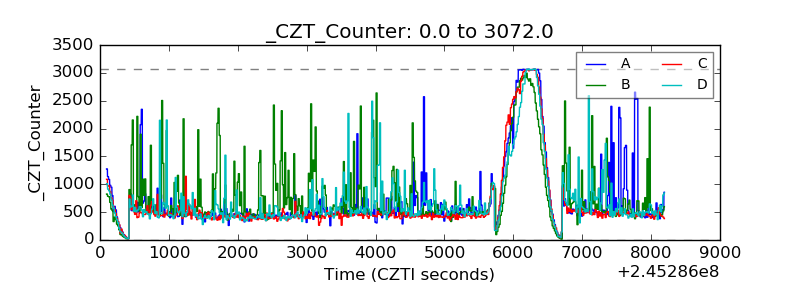 |
| +2.5 Volts monitor | 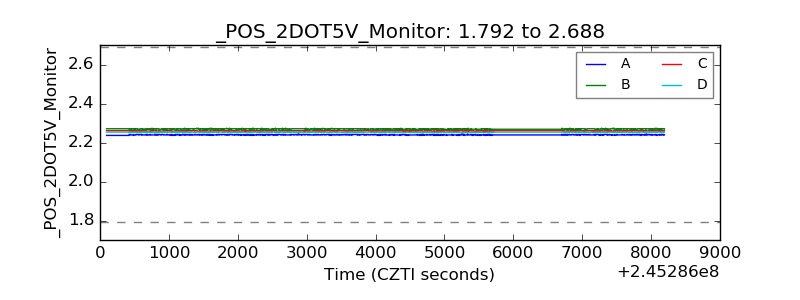 |
| +5 Volts monitor |  |
| _ROLL_ROT | 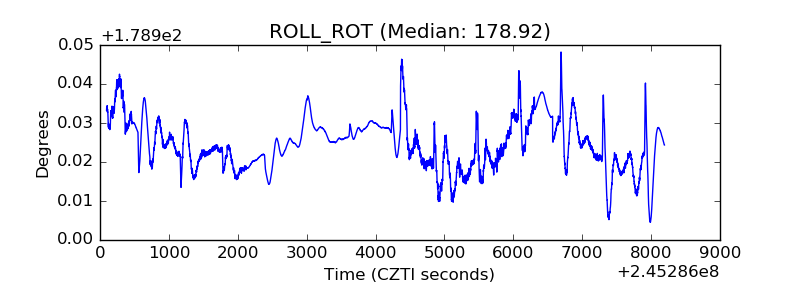 |
| _Roll_DEC | 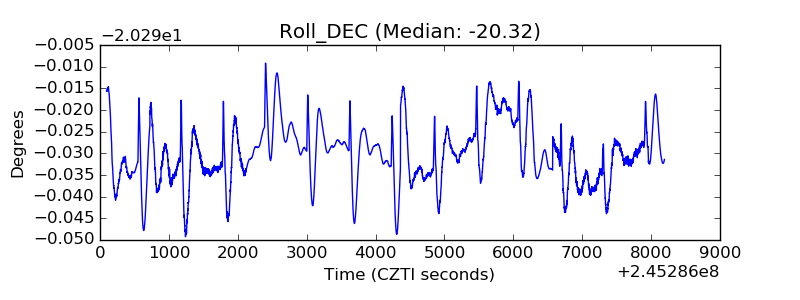 |
| _Roll_RA | 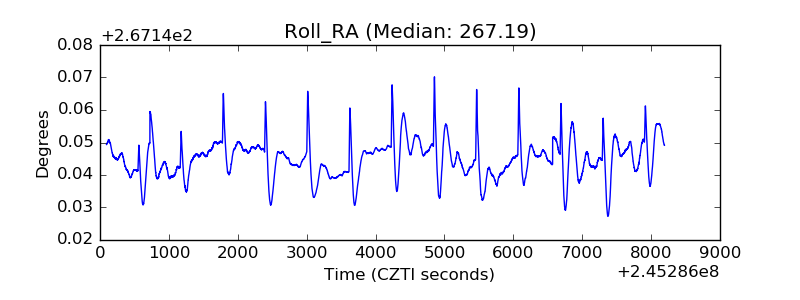 |
| Veto Counter | 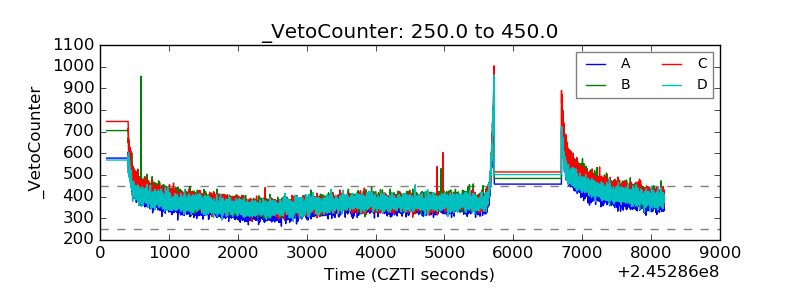 |