| Param | Original file | Final file |
|---|---|---|
| Filename | modeM0/AS1G08_027T06_9000001594_10998cztM0_level2.evt | modeM0/AS1G08_027T06_9000001594_10998cztM0_level2_quad_clean.evt |
| Size (bytes) | 539,110,080 | 65,085,120 |
| Size | 514.1 MB | 62.1 MB |
| Events in quadrant A | 3,515,512 | 423,287 |
| Events in quadrant B | 4,222,722 | 423,023 |
| Events in quadrant C | 2,795,643 | 419,704 |
| Events in quadrant D | 5,403,899 | 302,661 |
| Mode M9 | |||
|---|---|---|---|
| Quadrant | BADHDUFLAG | Total packets | Discarded packets |
| A | 0 | 12 | 0 |
| B | 0 | 12 | 0 |
| C | 0 | 12 | 0 |
| D | 0 | 12 | 0 |
| Mode M0 | |||
|---|---|---|---|
| Quadrant | BADHDUFLAG | Total packets | Discarded packets |
| A | 0 | 14060 | 2 |
| B | 0 | 16301 | 1 |
| C | 0 | 12009 | 1 |
| D | 0 | 19868 | 1 |
| Mode SS | |||
|---|---|---|---|
| Quadrant | BADHDUFLAG | Total packets | Discarded packets |
| A | 0 | 116 | 0 |
| B | 0 | 116 | 0 |
| C | 0 | 116 | 0 |
| D | 0 | 116 | 0 |
| Quadrant | Total seconds | Saturated seconds | Saturation percentage |
|---|---|---|---|
| A | 5743 | 175 | 3.047188% |
| B | 5743 | 386 | 6.721226% |
| C | 5743 | 56 | 0.975100% |
| D | 5743 | 966 | 16.820477% |
Noise dominated data is calculated using 1-second bins in cleaned event files. If a bin has >2000 counts, and if more than 50% of those come from <1% of pixels, then it is considered to be noise-dominated and hence unusable.
| Quadrant | # 1 sec bins | Bins with >0 counts | Bins with >2000 counts | High rate bins dominated by noise | Noise dominated (total time) | Noise dominated (detector-on time) | Marked lightcurve |
|---|---|---|---|---|---|---|---|
| A | 6963 | 5743 | 97 | 97 | 1.39% | 1.69% | 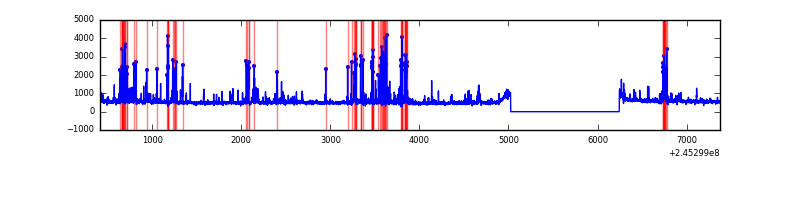 |
| B | 6963 | 5743 | 189 | 189 | 2.71% | 3.29% |  |
| C | 6963 | 5743 | 0 | 0 | 0.00% | 0.00% | 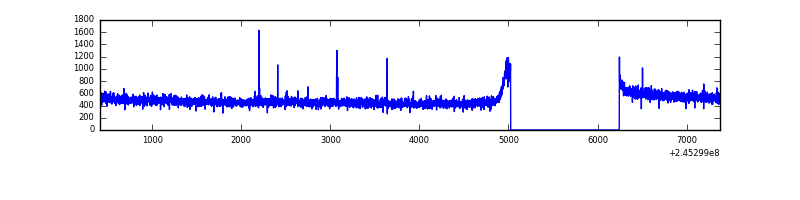 |
| D | 6963 | 5743 | 750 | 750 | 10.77% | 13.06% | 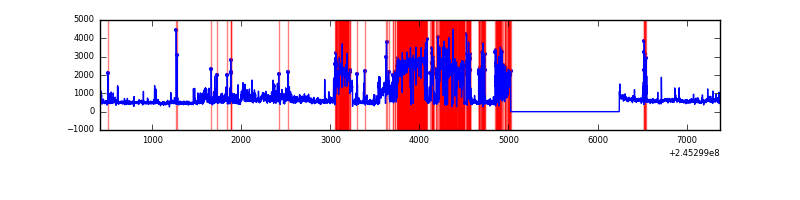 |
Top three noisy pixels from each quadrant. If the there are fewer than three noisy pixels in the level2.evt file, extra rows are filled as -1
| Pixel properties | Quadrant properties | ||||||
|---|---|---|---|---|---|---|---|
| Quadrant | DetID | PixID | Counts | Sigma | Mean | Median | Sigma |
| A | 8 | 5 | 487233 | 3285.5 | 737 | 723 | 148.1 |
| A | 14 | 254 | 175411 | 1179.7 | 737 | 723 | 148.1 |
| A | 8 | 15 | 7950 | 48.81 | 737 | 723 | 148.1 |
| B | 4 | 239 | 1290279 | 9349.07 | 729 | 714 | 137.9 |
| B | 0 | 214 | 31564 | 223.66 | 729 | 714 | 137.9 |
| B | 15 | 204 | 26107 | 184.09 | 729 | 714 | 137.9 |
| C | 1 | 3 | 5917 | 31.49 | 715 | 721 | 165.0 |
| C | 13 | 61 | 5360 | 28.12 | 715 | 721 | 165.0 |
| C | 12 | 4 | 3457 | 16.58 | 715 | 721 | 165.0 |
| D | 1 | 52 | 2509945 | 16879.95 | 625 | 609 | 148.7 |
| D | 8 | 195 | 199396 | 1337.21 | 625 | 609 | 148.7 |
| D | 13 | 152 | 167152 | 1120.31 | 625 | 609 | 148.7 |
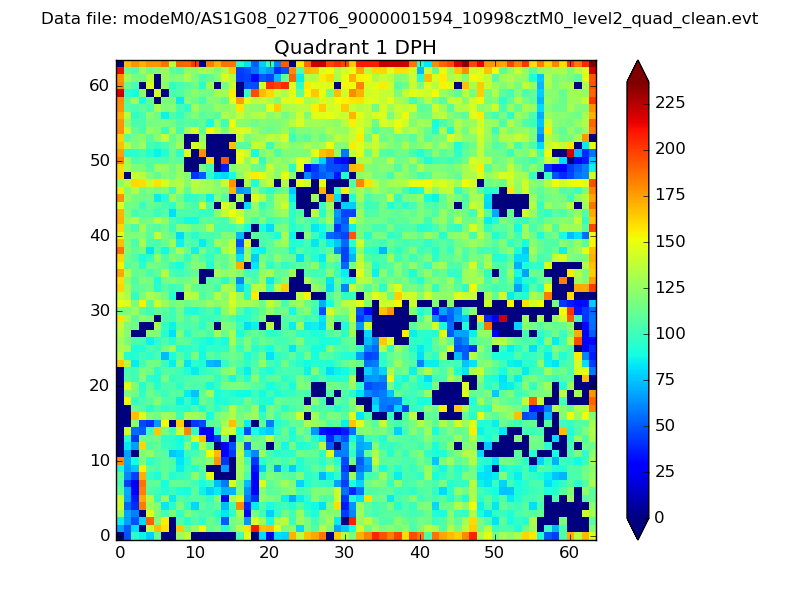
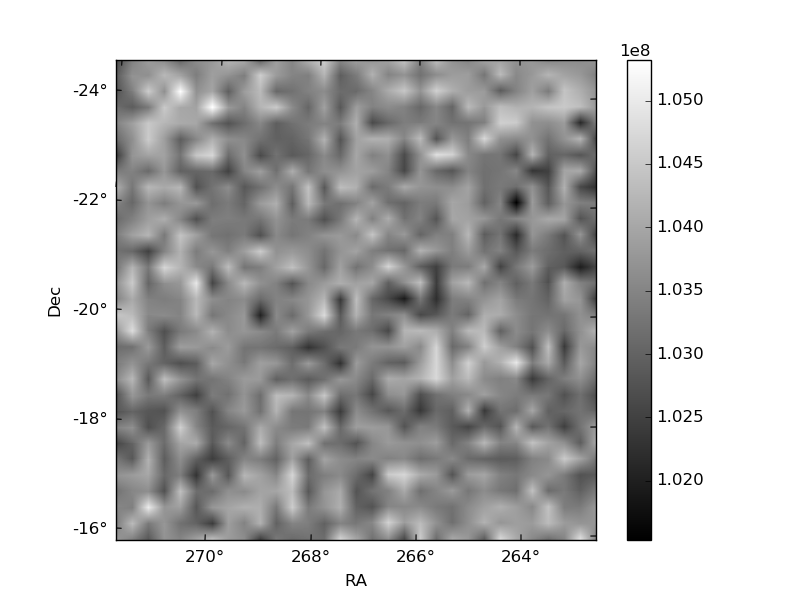
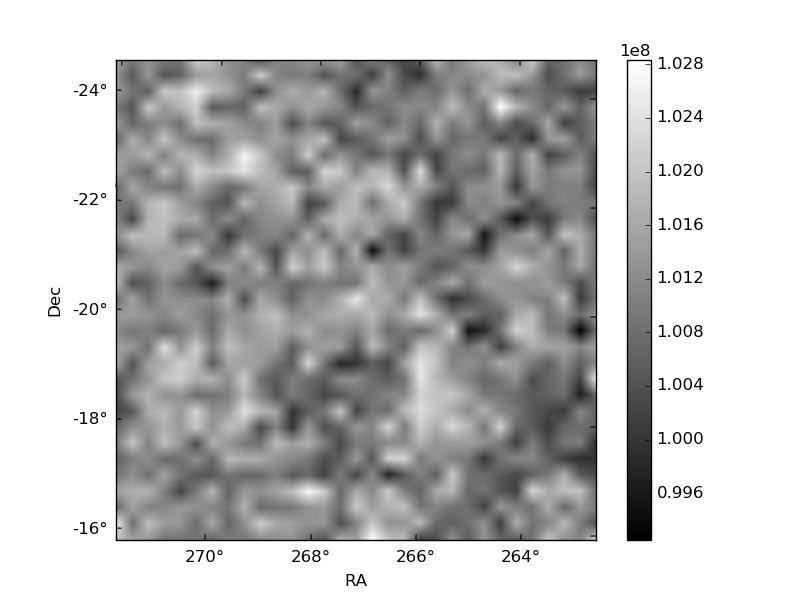
Histogram calculated using DETX and DETY for each event in the final _common_clean file
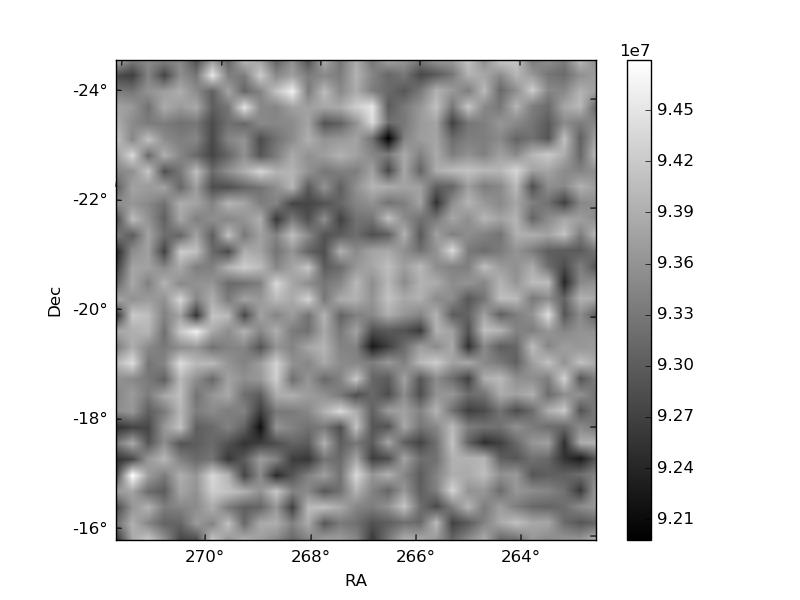
| Quadrant A |  |
 |
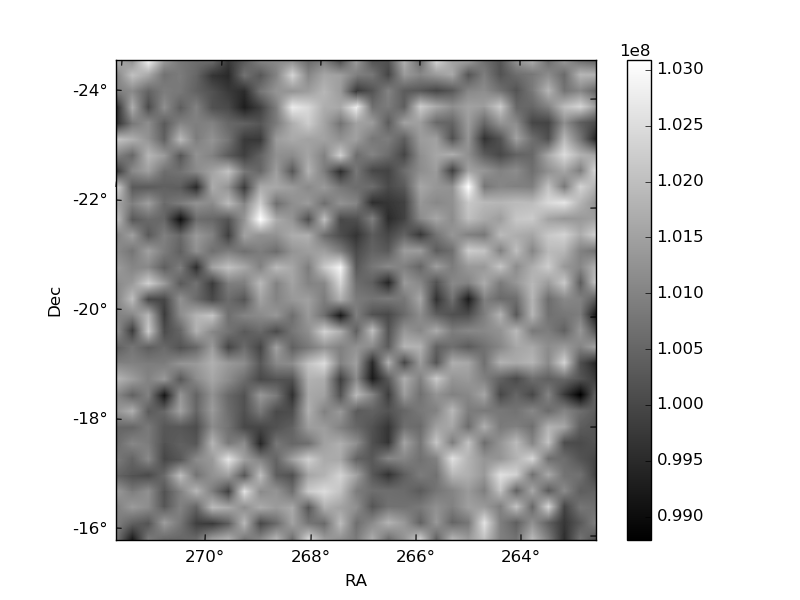
Quadrant B |
|---|---|---|---|
| Quadrant D | 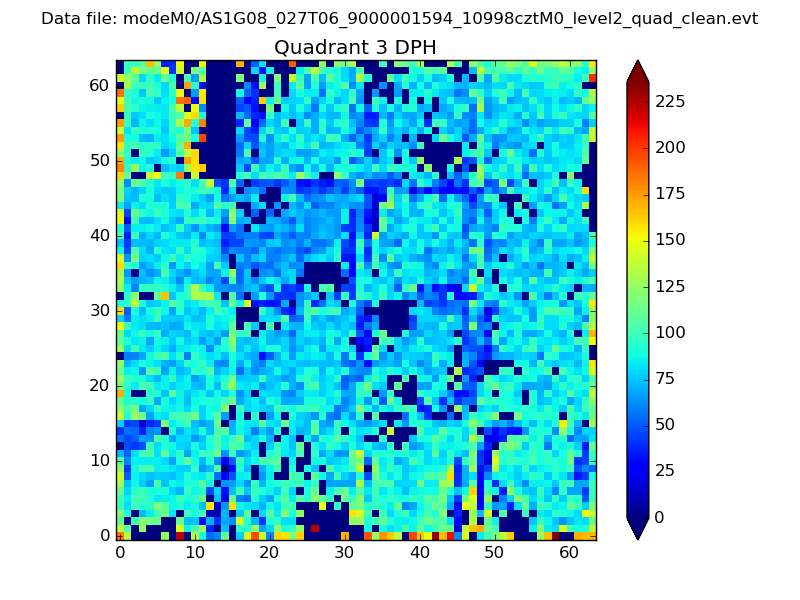 |
 |
Quadrant C |
| Plot type | Count rate plots | Images |
|---|---|---|
| Comparison with Poisson distribution Blue bars denote a histogram of data divided into 1 sec bins. Red curve is a Poisson curve with rate = median count rate of data. |
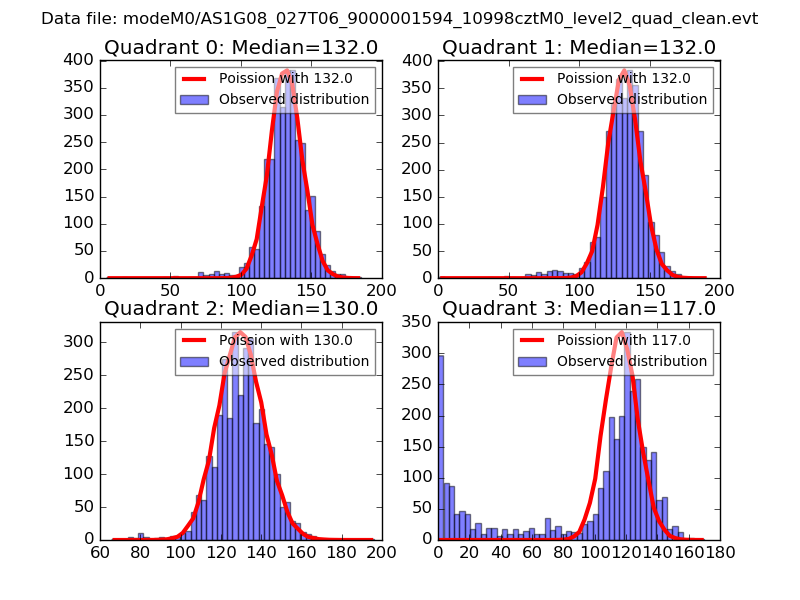 |
 |
| Quadrant-wise count rates Data is divided into 100 sec bins |
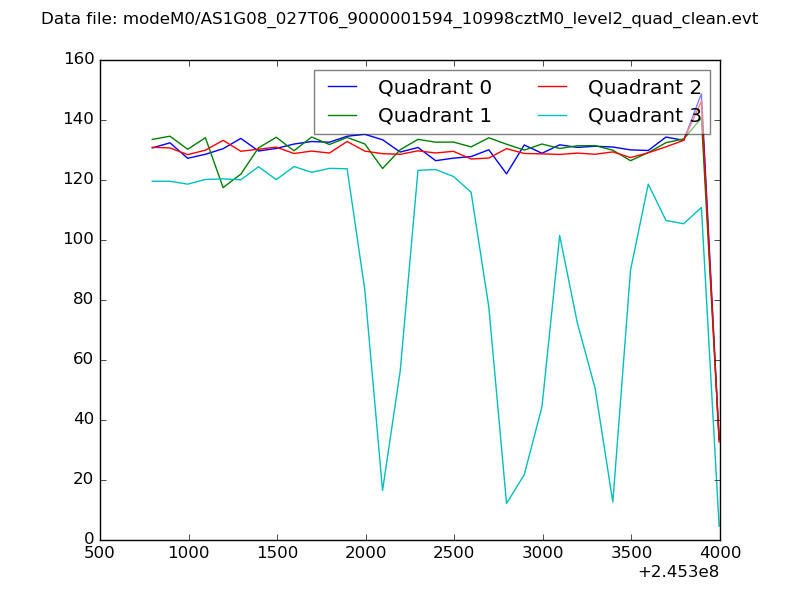 |
|
| Module-wise count rates for Quadrant A Data is divided into 100 sec bins |
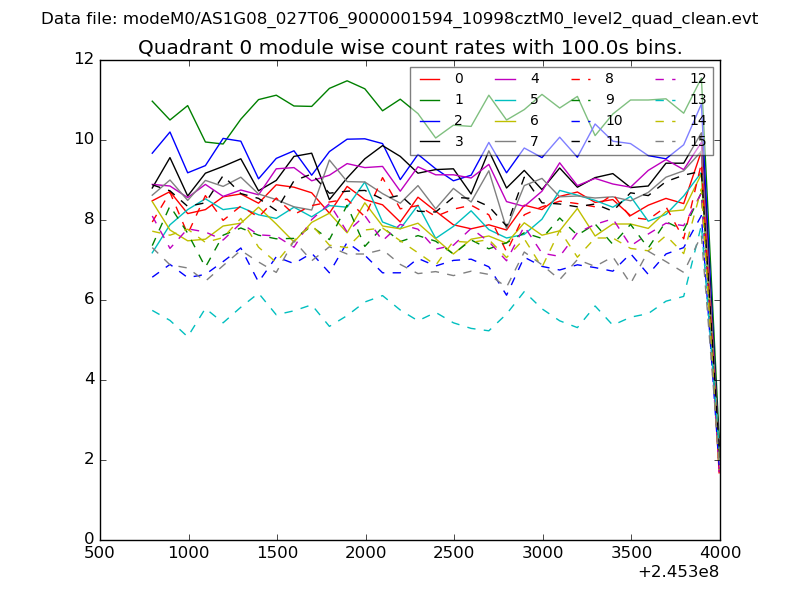 |
 |
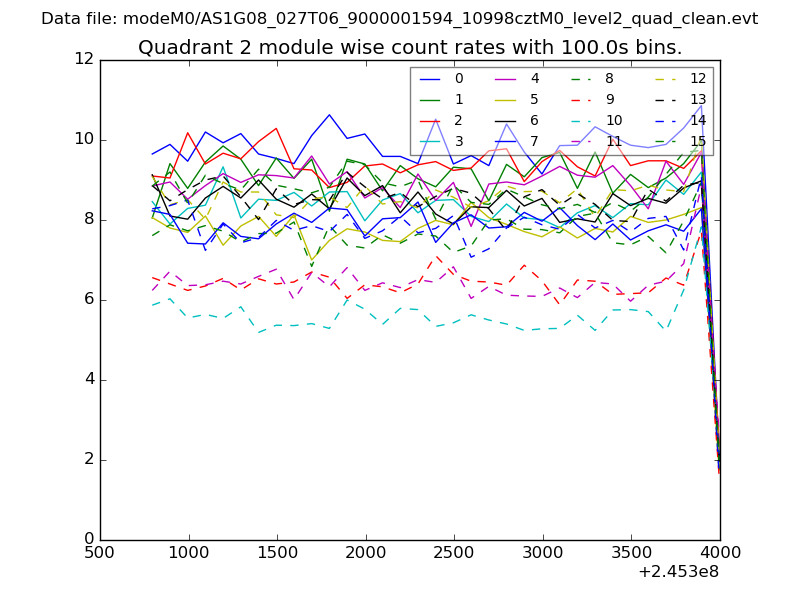
| Module-wise count rates for Quadrant B Data is divided into 100 sec bins |
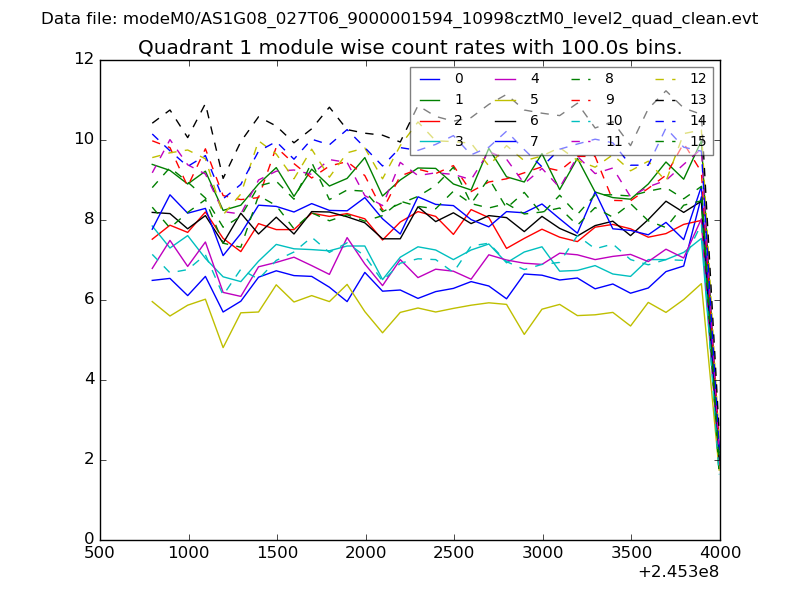 |
 |
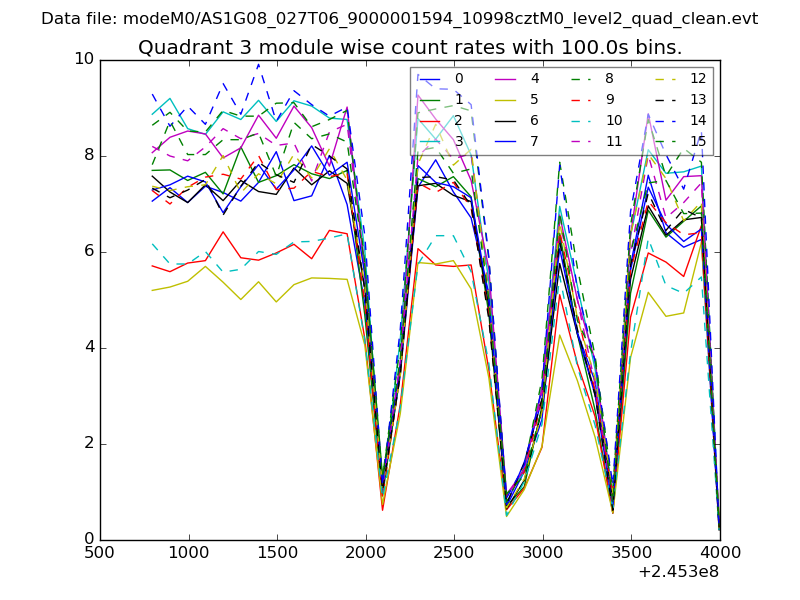
| Module-wise count rates for Quadrant C Data is divided into 100 sec bins |
 |
 |
| Module-wise count rates for Quadrant D Data is divided into 100 sec bins |
 |
 |
| Parameter | Plot |
|---|---|
| CZT HV Monitor | 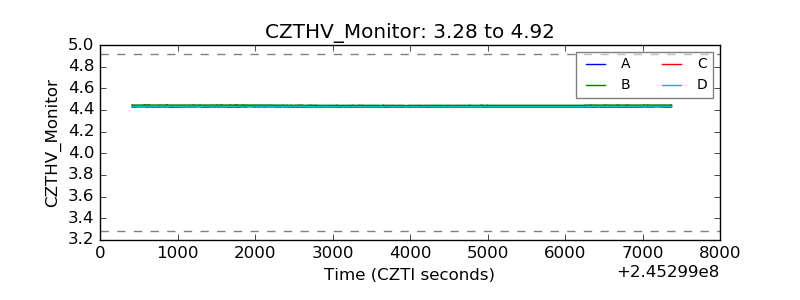 |
| D_VDD | 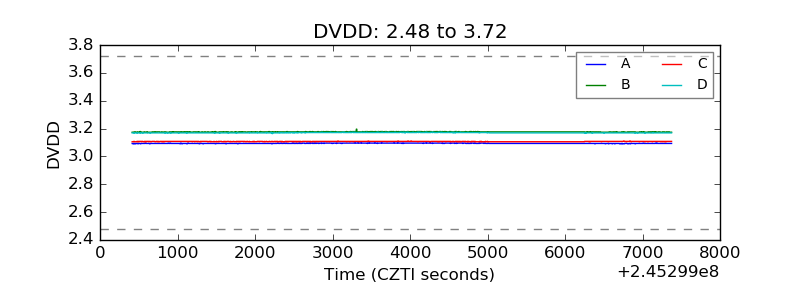 |
| Temperature 1 | 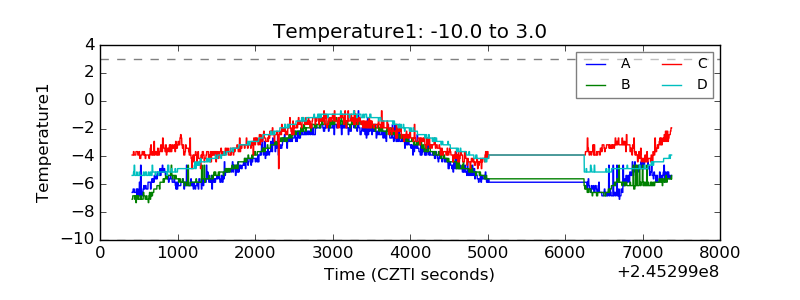 |
| Veto HV Monitor | 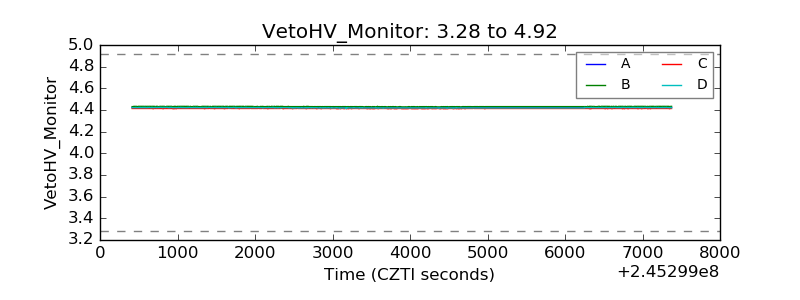 |
| Veto LLD | 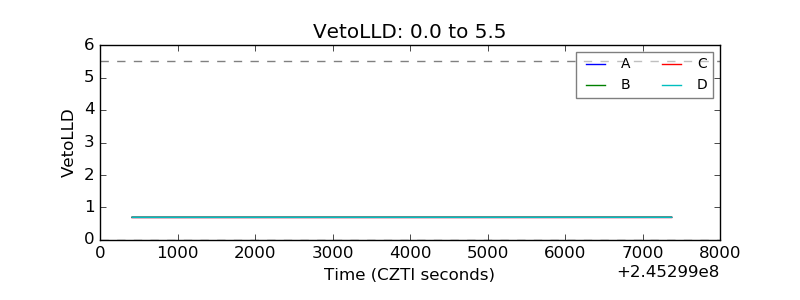 |
| Alpha Counter | 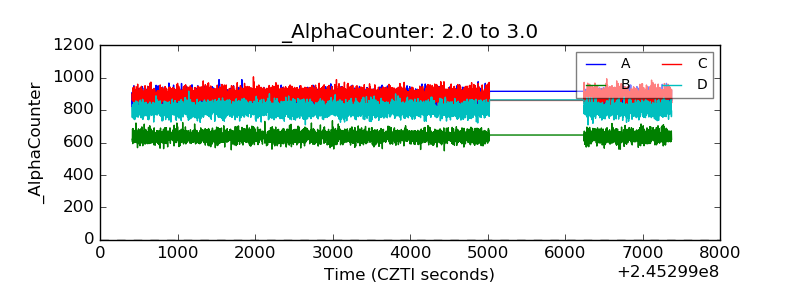 |
| _CPM_Rate | 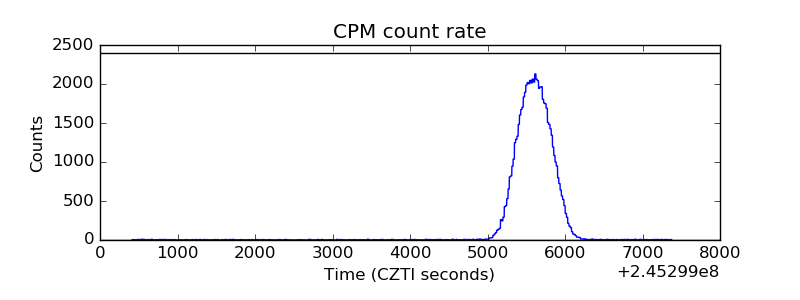 |
| CZT Counter |  |
| +2.5 Volts monitor |  |
| +5 Volts monitor |  |
| _ROLL_ROT | 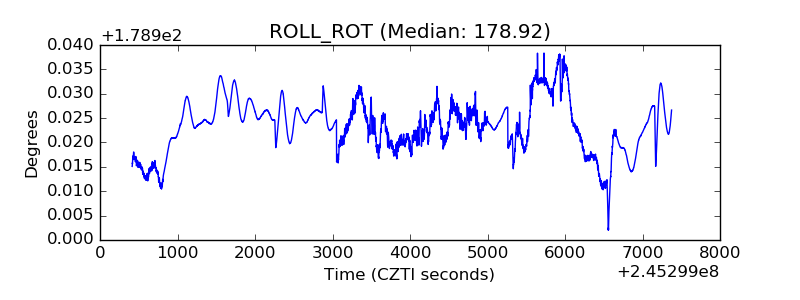 |
| _Roll_DEC | 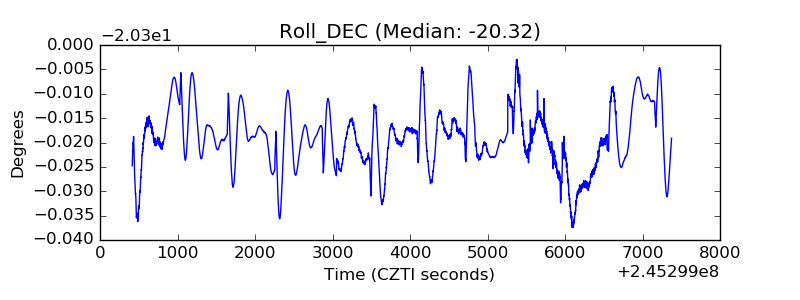 |
| _Roll_RA | 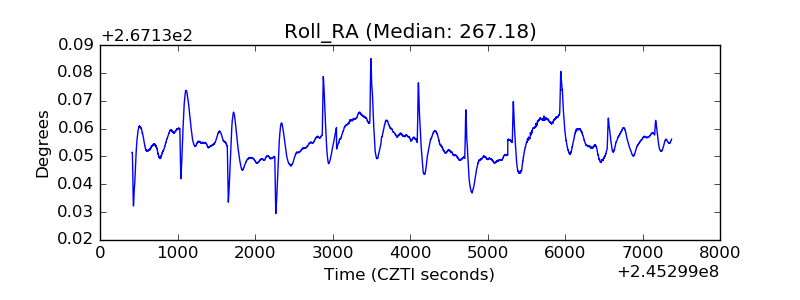 |
| Veto Counter | 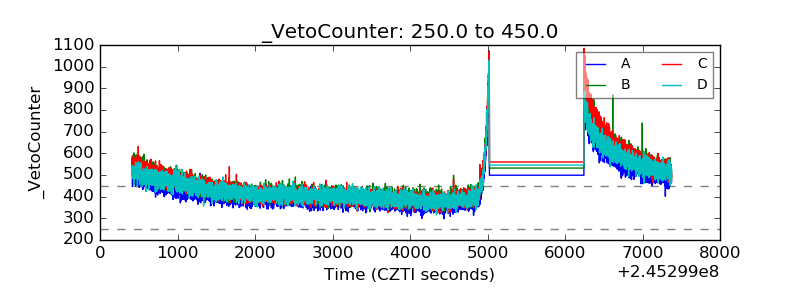 |