| Param | Original file | Final file |
|---|---|---|
| Filename | modeM0/AS1G08_027T06_9000001594_11003cztM0_level2.evt | modeM0/AS1G08_027T06_9000001594_11003cztM0_level2_quad_clean.evt |
| Size (bytes) | 554,520,960 | 102,585,600 |
| Size | 528.8 MB | 97.8 MB |
| Events in quadrant A | 3,774,181 | 665,083 |
| Events in quadrant B | 4,615,987 | 663,903 |
| Events in quadrant C | 3,377,969 | 655,422 |
| Events in quadrant D | 4,530,957 | 614,634 |
| Mode M9 | |||
|---|---|---|---|
| Quadrant | BADHDUFLAG | Total packets | Discarded packets |
| A | 0 | 6 | 0 |
| B | 0 | 6 | 0 |
| C | 0 | 6 | 0 |
| D | 0 | 6 | 0 |
| Mode M0 | |||
|---|---|---|---|
| Quadrant | BADHDUFLAG | Total packets | Discarded packets |
| A | 0 | 16089 | 3 |
| B | 0 | 18356 | 2 |
| C | 0 | 15135 | 2 |
| D | 0 | 18330 | 2 |
| Mode SS | |||
|---|---|---|---|
| Quadrant | BADHDUFLAG | Total packets | Discarded packets |
| A | 0 | 148 | 0 |
| B | 0 | 148 | 0 |
| C | 0 | 148 | 0 |
| D | 0 | 148 | 0 |
| Quadrant | Total seconds | Saturated seconds | Saturation percentage |
|---|---|---|---|
| A | 7290 | 180 | 2.469136% |
| B | 7290 | 354 | 4.855967% |
| C | 7290 | 68 | 0.932785% |
| D | 7291 | 219 | 3.003703% |
Noise dominated data is calculated using 1-second bins in cleaned event files. If a bin has >2000 counts, and if more than 50% of those come from <1% of pixels, then it is considered to be noise-dominated and hence unusable.
| Quadrant | # 1 sec bins | Bins with >0 counts | Bins with >2000 counts | High rate bins dominated by noise | Noise dominated (total time) | Noise dominated (detector-on time) | Marked lightcurve |
|---|---|---|---|---|---|---|---|
| A | 7885 | 7291 | 24 | 24 | 0.30% | 0.33% | 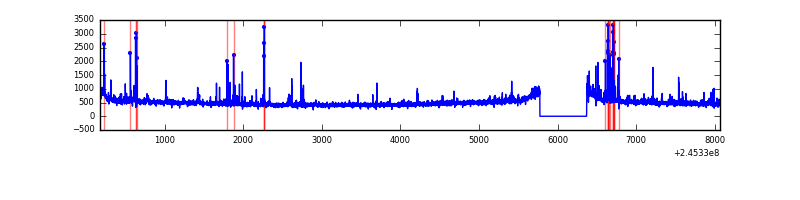 |
| B | 7885 | 7290 | 116 | 116 | 1.47% | 1.59% | 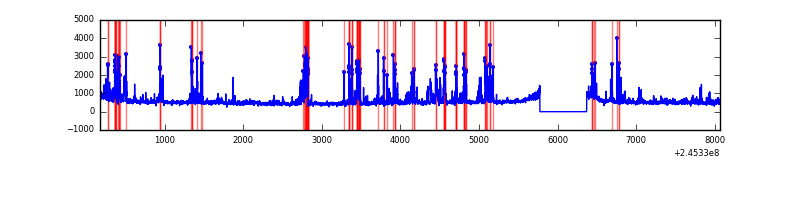 |
| C | 7885 | 7291 | 0 | 0 | 0.00% | 0.00% | 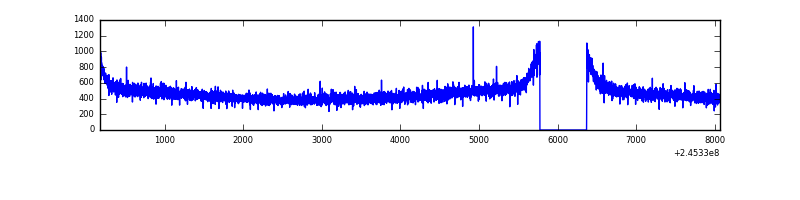 |
| D | 7886 | 7292 | 102 | 102 | 1.29% | 1.40% | 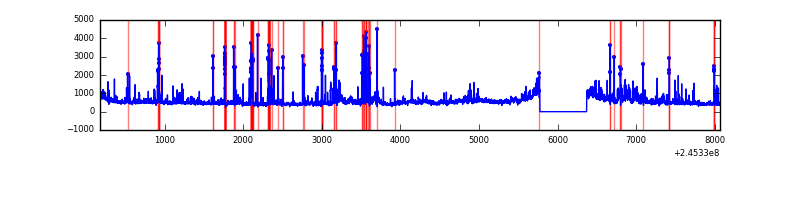 |
Top three noisy pixels from each quadrant. If the there are fewer than three noisy pixels in the level2.evt file, extra rows are filled as -1
| Pixel properties | Quadrant properties | ||||||
|---|---|---|---|---|---|---|---|
| Quadrant | DetID | PixID | Counts | Sigma | Mean | Median | Sigma |
| A | 8 | 5 | 262700 | 1424.06 | 903 | 883 | 183.9 |
| A | 14 | 254 | 20476 | 106.57 | 903 | 883 | 183.9 |
| A | 0 | 226 | 8553 | 41.72 | 903 | 883 | 183.9 |
| B | 4 | 239 | 937687 | 5497.94 | 893 | 873 | 170.4 |
| B | 0 | 214 | 64826 | 375.33 | 893 | 873 | 170.4 |
| B | 0 | 219 | 36140 | 206.97 | 893 | 873 | 170.4 |
| C | 13 | 61 | 6443 | 27.61 | 864 | 870 | 201.8 |
| C | 8 | 222 | 4372 | 17.35 | 864 | 870 | 201.8 |
| C | 14 | 67 | 3375 | 12.41 | 864 | 870 | 201.8 |
| D | 1 | 52 | 593381 | 2835.55 | 858 | 835 | 209.0 |
| D | 10 | 253 | 291407 | 1390.5 | 858 | 835 | 209.0 |
| D | 11 | 129 | 113384 | 538.59 | 858 | 835 | 209.0 |
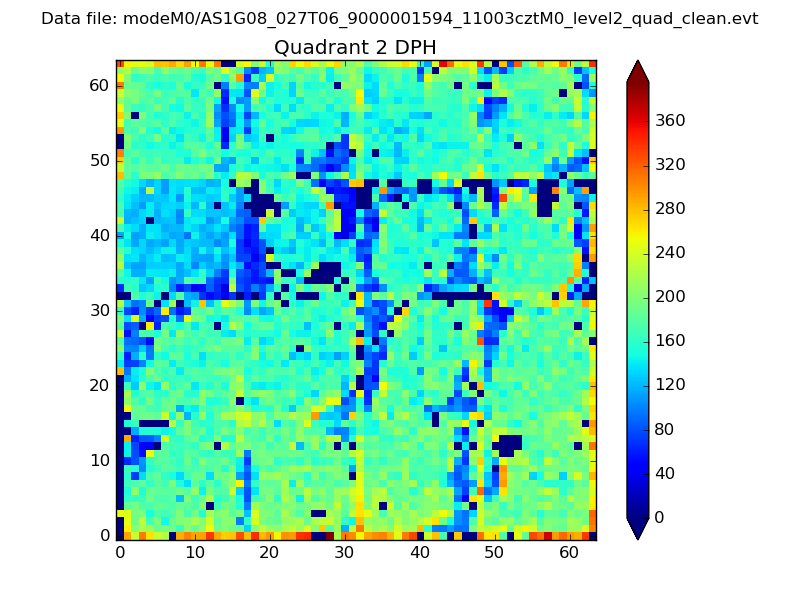
Histogram calculated using DETX and DETY for each event in the final _common_clean file
| Quadrant A |  |
 |
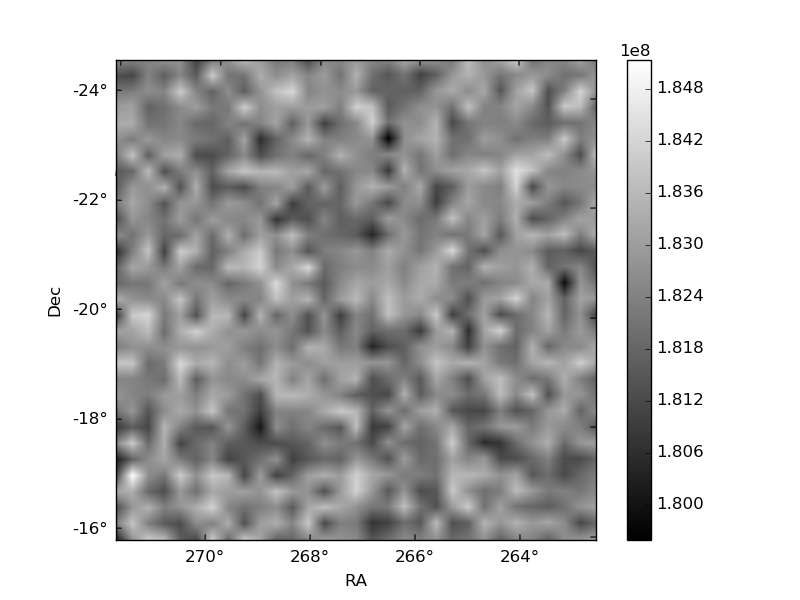
Quadrant B |
|---|---|---|---|
| Quadrant D | 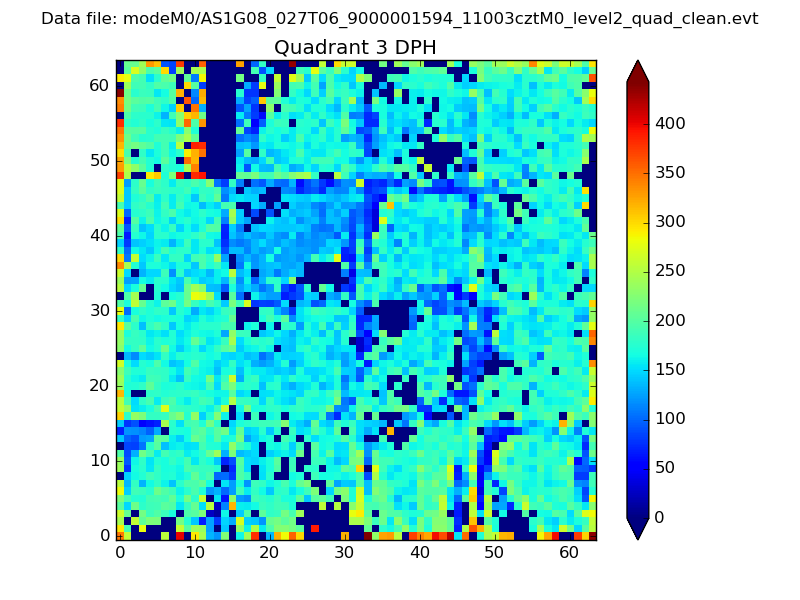 |
 |
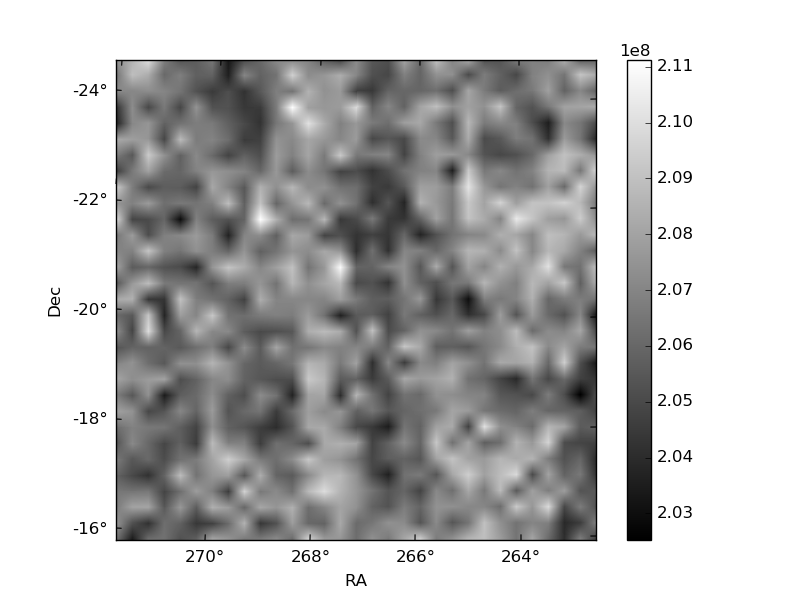
Quadrant C |
| Plot type | Count rate plots | Images |
|---|---|---|
| Comparison with Poisson distribution Blue bars denote a histogram of data divided into 1 sec bins. Red curve is a Poisson curve with rate = median count rate of data. |
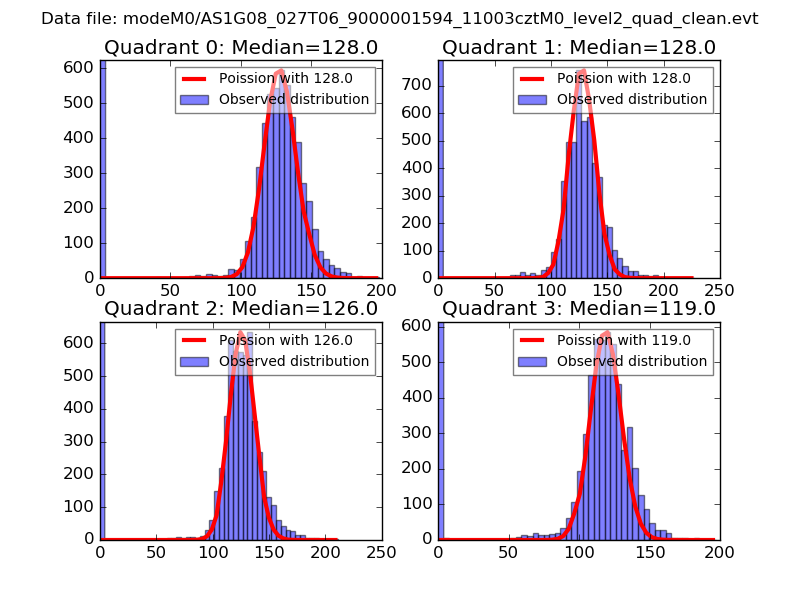 |
 |
| Quadrant-wise count rates Data is divided into 100 sec bins |
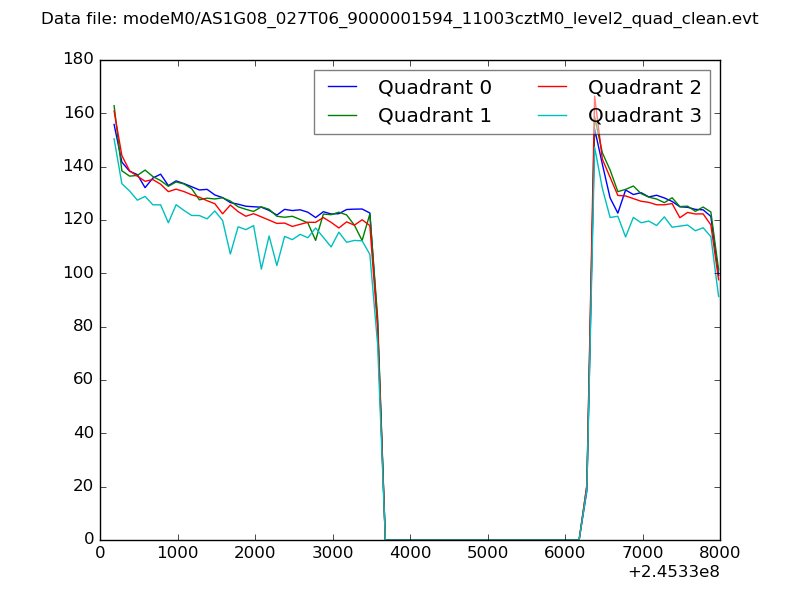 |
|
| Module-wise count rates for Quadrant A Data is divided into 100 sec bins |
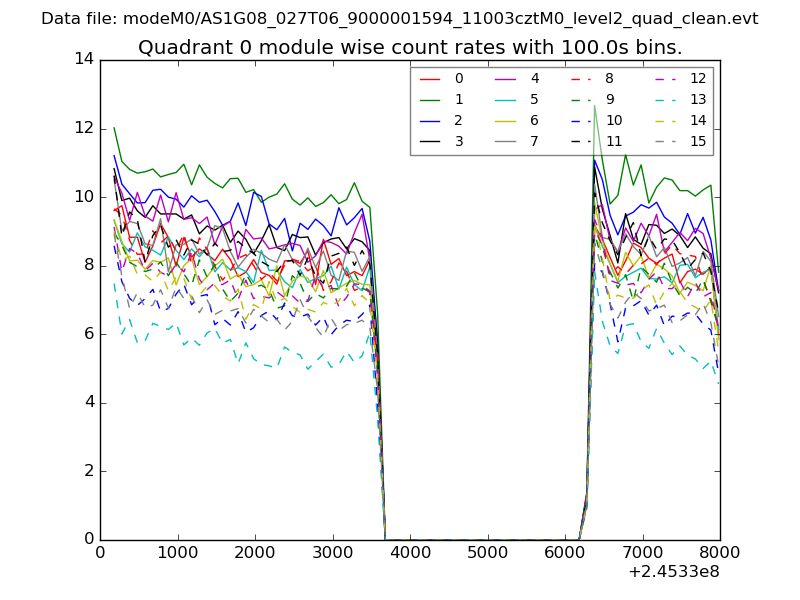 |
 |
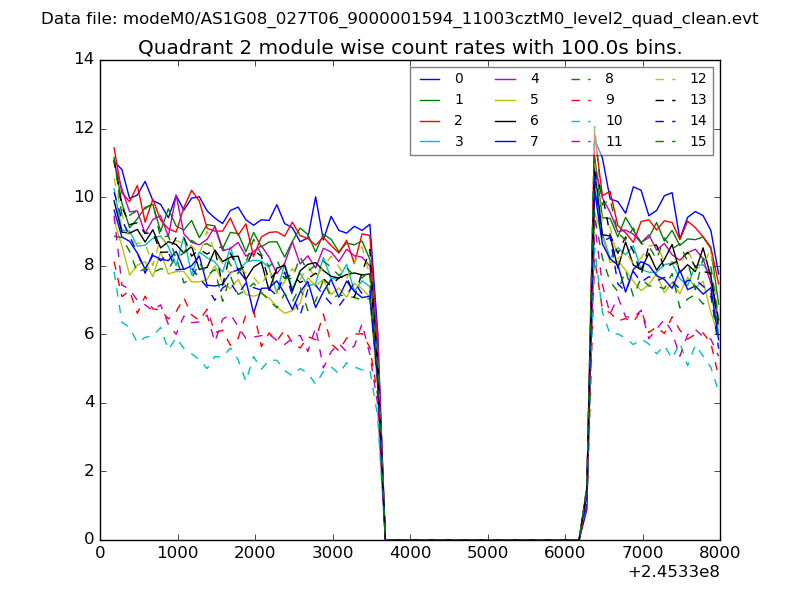
| Module-wise count rates for Quadrant B Data is divided into 100 sec bins |
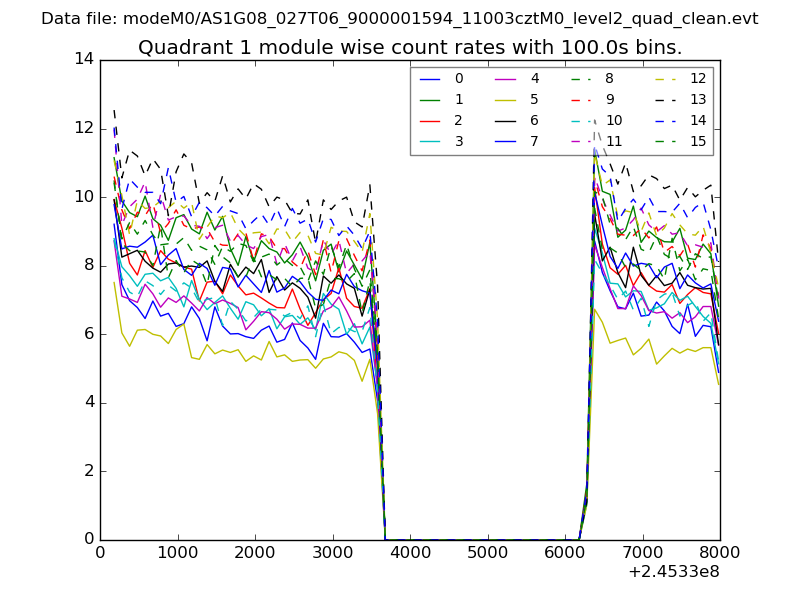 |
 |
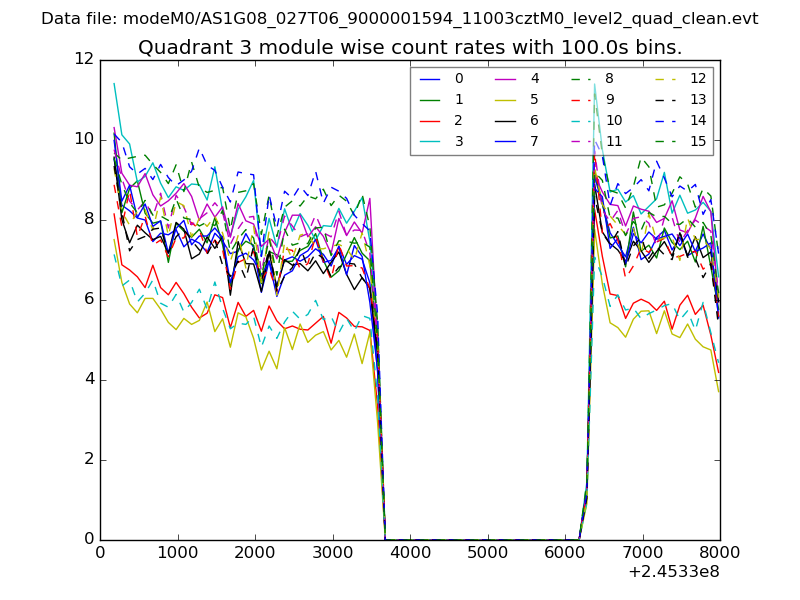
| Module-wise count rates for Quadrant C Data is divided into 100 sec bins |
 |
 |
| Module-wise count rates for Quadrant D Data is divided into 100 sec bins |
 |
 |
| Parameter | Plot |
|---|---|
| CZT HV Monitor | 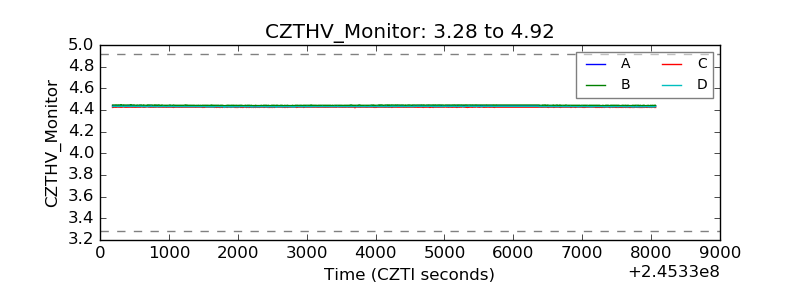 |
| D_VDD | 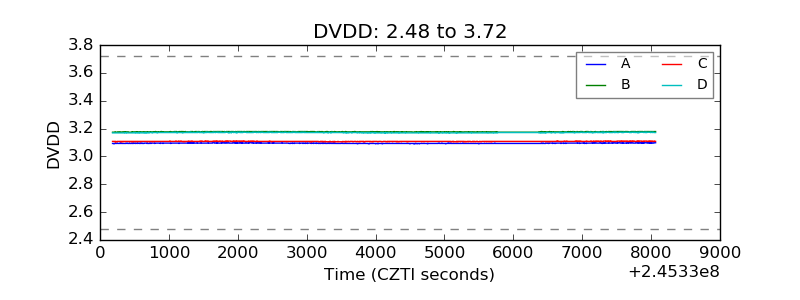 |
| Temperature 1 | 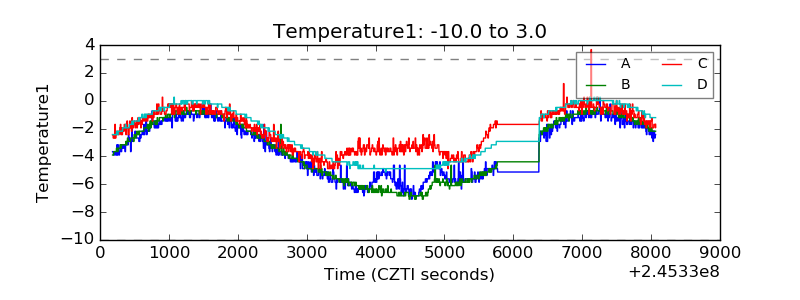 |
| Veto HV Monitor | 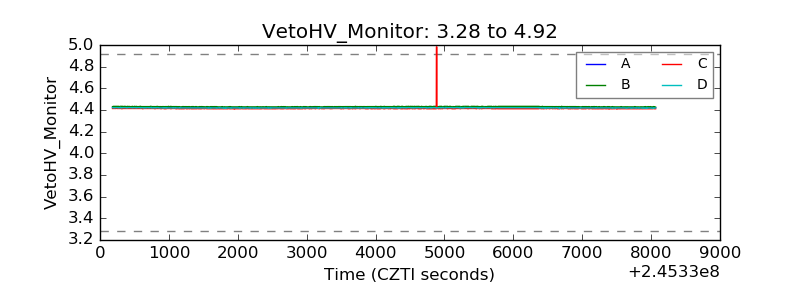 |
| Veto LLD | 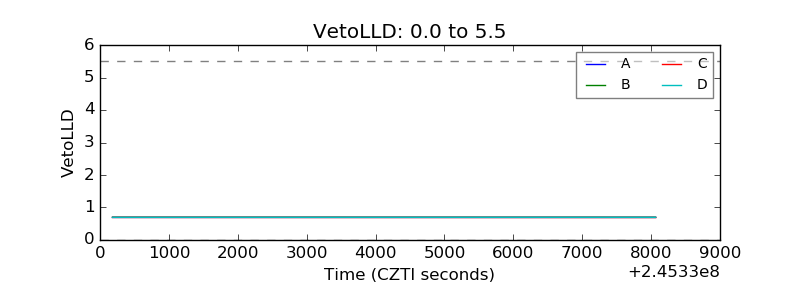 |
| Alpha Counter | 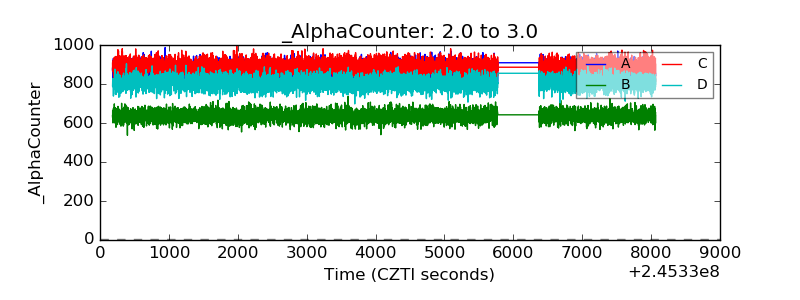 |
| _CPM_Rate | 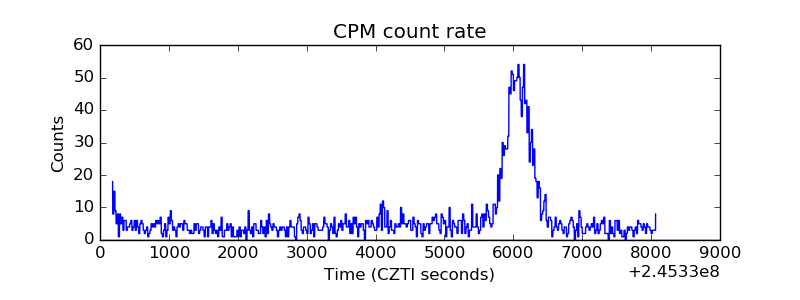 |
| CZT Counter | 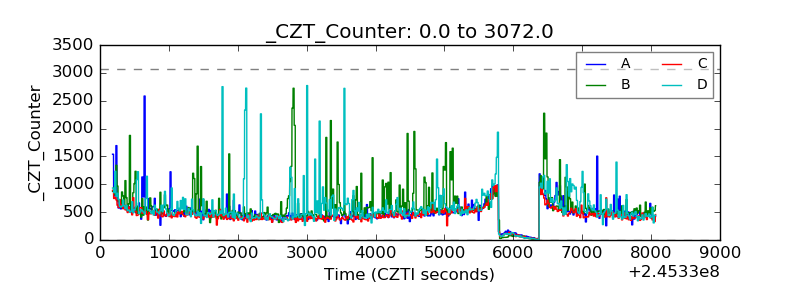 |
| +2.5 Volts monitor |  |
| +5 Volts monitor | 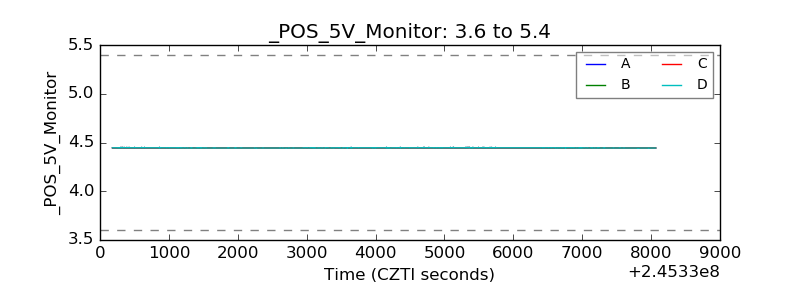 |
| _ROLL_ROT | 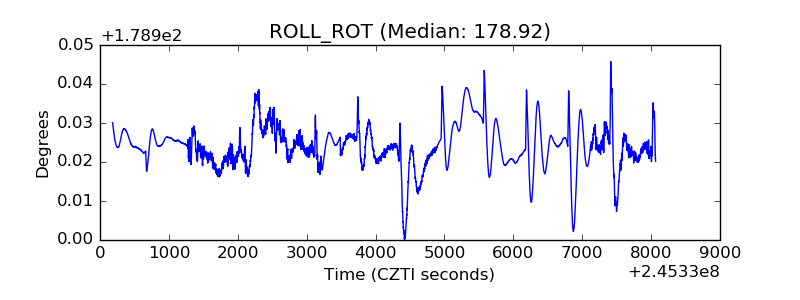 |
| _Roll_DEC | 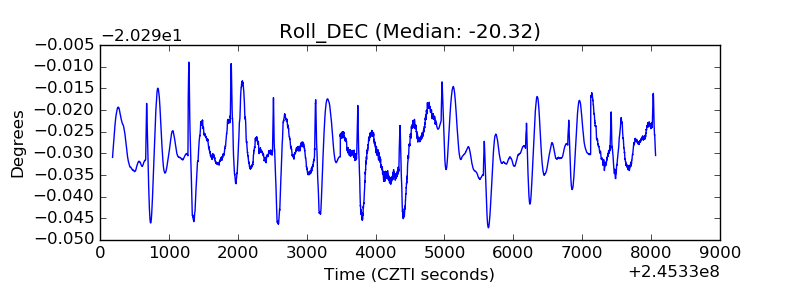 |
| _Roll_RA | 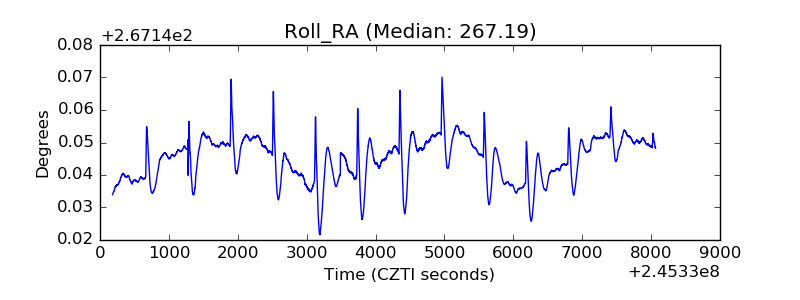 |
| Veto Counter | 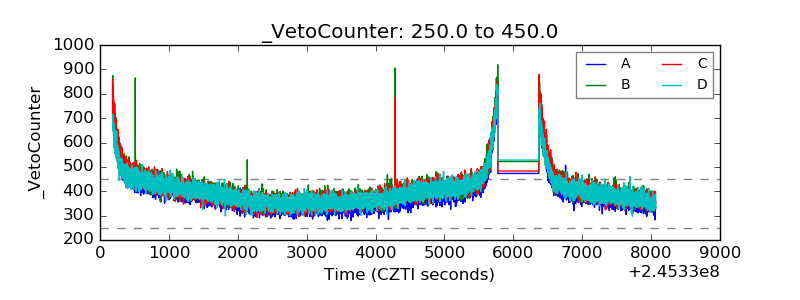 |