| Param | Original file | Final file |
|---|---|---|
| Filename | modeM0/AS1G08_027T06_9000001594_11005cztM0_level2.evt | modeM0/AS1G08_027T06_9000001594_11005cztM0_level2_quad_clean.evt |
| Size (bytes) | 531,993,600 | 92,004,480 |
| Size | 507.3 MB | 87.7 MB |
| Events in quadrant A | 3,506,065 | 592,918 |
| Events in quadrant B | 4,830,676 | 577,733 |
| Events in quadrant C | 3,139,098 | 580,093 |
| Events in quadrant D | 4,163,622 | 550,742 |
| Mode M9 | |||
|---|---|---|---|
| Quadrant | BADHDUFLAG | Total packets | Discarded packets |
| A | 0 | 1 | 0 |
| B | 0 | 1 | 0 |
| C | 0 | 1 | 0 |
| D | 0 | 1 | 0 |
| Mode M0 | |||
|---|---|---|---|
| Quadrant | BADHDUFLAG | Total packets | Discarded packets |
| A | 0 | 15156 | 2 |
| B | 0 | 18919 | 6 |
| C | 0 | 14332 | 1 |
| D | 0 | 17031 | 1 |
| Mode SS | |||
|---|---|---|---|
| Quadrant | BADHDUFLAG | Total packets | Discarded packets |
| A | 0 | 142 | 0 |
| B | 0 | 142 | 0 |
| C | 0 | 142 | 0 |
| D | 0 | 142 | 0 |
| Quadrant | Total seconds | Saturated seconds | Saturation percentage |
|---|---|---|---|
| A | 6954 | 71 | 1.020995% |
| B | 6953 | 456 | 6.558320% |
| C | 6954 | 23 | 0.330745% |
| D | 6954 | 129 | 1.855047% |
Noise dominated data is calculated using 1-second bins in cleaned event files. If a bin has >2000 counts, and if more than 50% of those come from <1% of pixels, then it is considered to be noise-dominated and hence unusable.
| Quadrant | # 1 sec bins | Bins with >0 counts | Bins with >2000 counts | High rate bins dominated by noise | Noise dominated (total time) | Noise dominated (detector-on time) | Marked lightcurve |
|---|---|---|---|---|---|---|---|
| A | 7074 | 6955 | 22 | 22 | 0.31% | 0.32% | 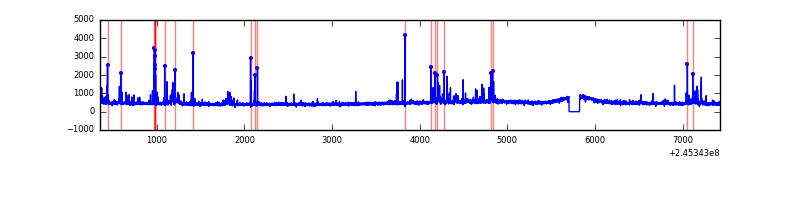 |
| B | 7074 | 6954 | 296 | 296 | 4.18% | 4.26% | 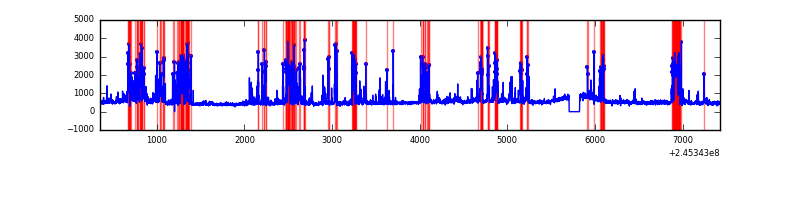 |
| C | 7074 | 6955 | 1 | 1 | 0.01% | 0.01% | 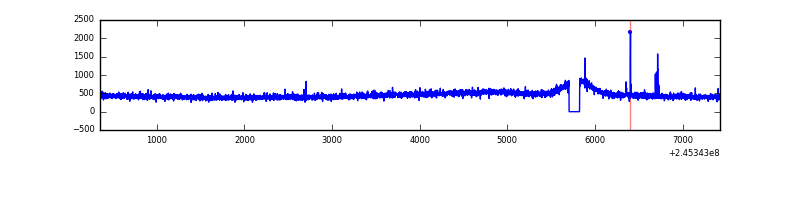 |
| D | 7074 | 6955 | 36 | 36 | 0.51% | 0.52% | 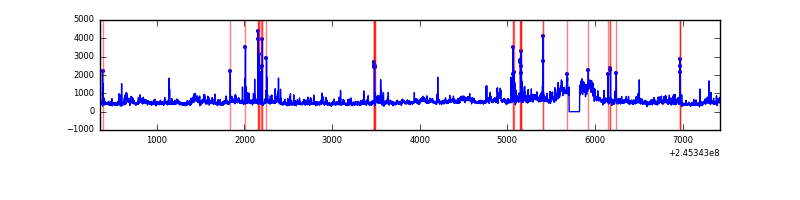 |
Top three noisy pixels from each quadrant. If the there are fewer than three noisy pixels in the level2.evt file, extra rows are filled as -1
| Pixel properties | Quadrant properties | ||||||
|---|---|---|---|---|---|---|---|
| Quadrant | DetID | PixID | Counts | Sigma | Mean | Median | Sigma |
| A | 8 | 5 | 306996 | 1803.31 | 825 | 806 | 169.8 |
| A | 0 | 226 | 7593 | 39.97 | 825 | 806 | 169.8 |
| A | 11 | 29 | 7213 | 37.73 | 825 | 806 | 169.8 |
| B | 4 | 239 | 1480604 | 9469.73 | 811 | 792 | 156.3 |
| B | 0 | 219 | 51555 | 324.85 | 811 | 792 | 156.3 |
| B | 15 | 204 | 42930 | 269.65 | 811 | 792 | 156.3 |
| C | 0 | 207 | 21750 | 112.61 | 794 | 796 | 186.1 |
| C | 8 | 128 | 7610 | 36.62 | 794 | 796 | 186.1 |
| C | 13 | 61 | 6047 | 28.22 | 794 | 796 | 186.1 |
| D | 11 | 129 | 581864 | 3021.94 | 787 | 764 | 192.3 |
| D | 8 | 195 | 175549 | 908.95 | 787 | 764 | 192.3 |
| D | 1 | 52 | 120115 | 620.67 | 787 | 764 | 192.3 |
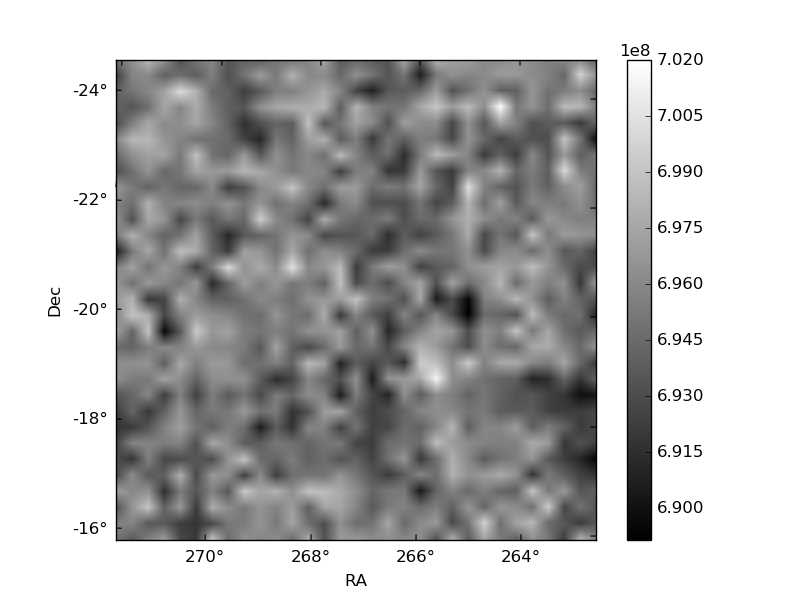
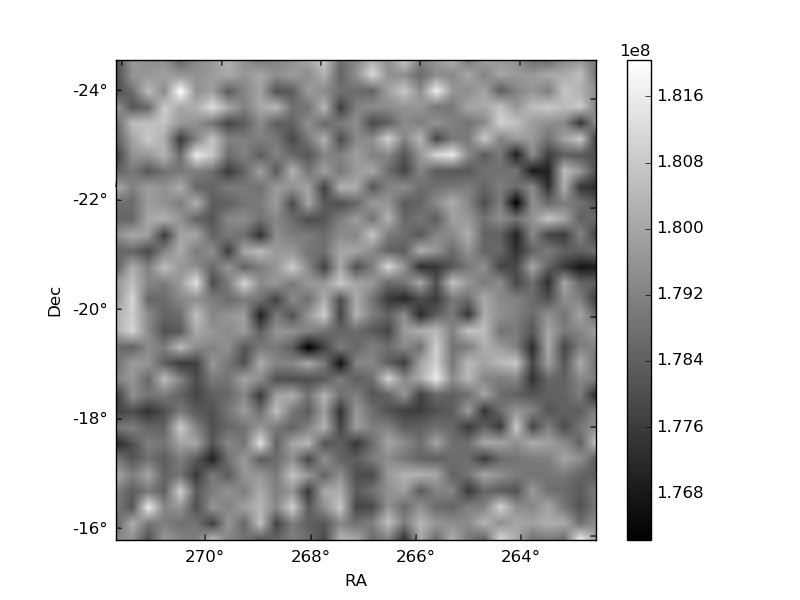
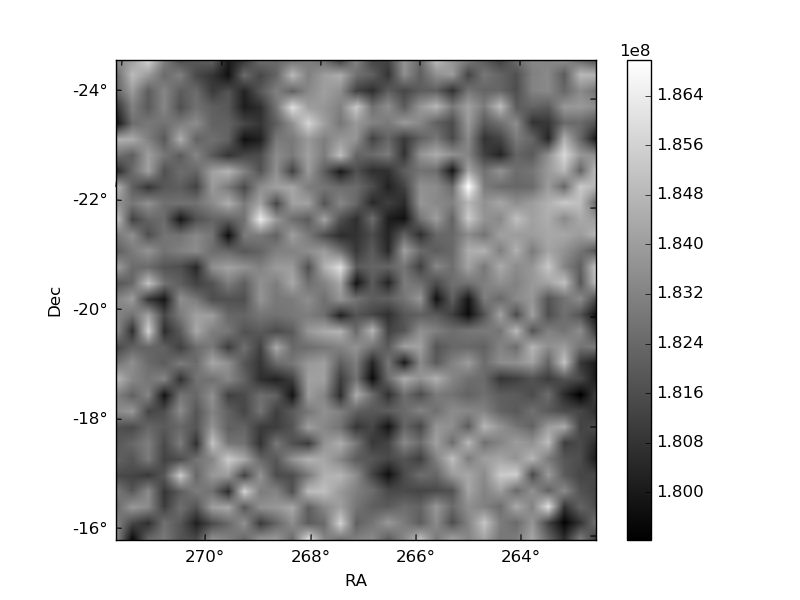
Histogram calculated using DETX and DETY for each event in the final _common_clean file
| Quadrant A | 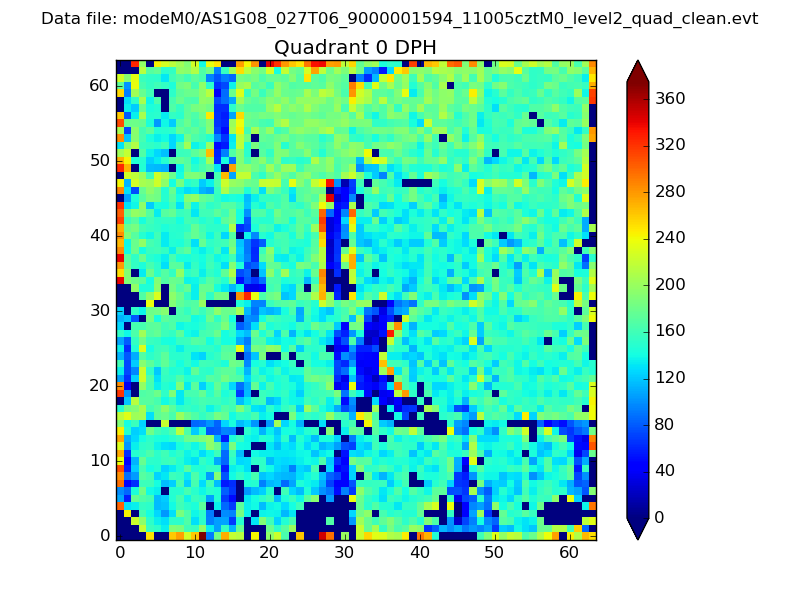 |
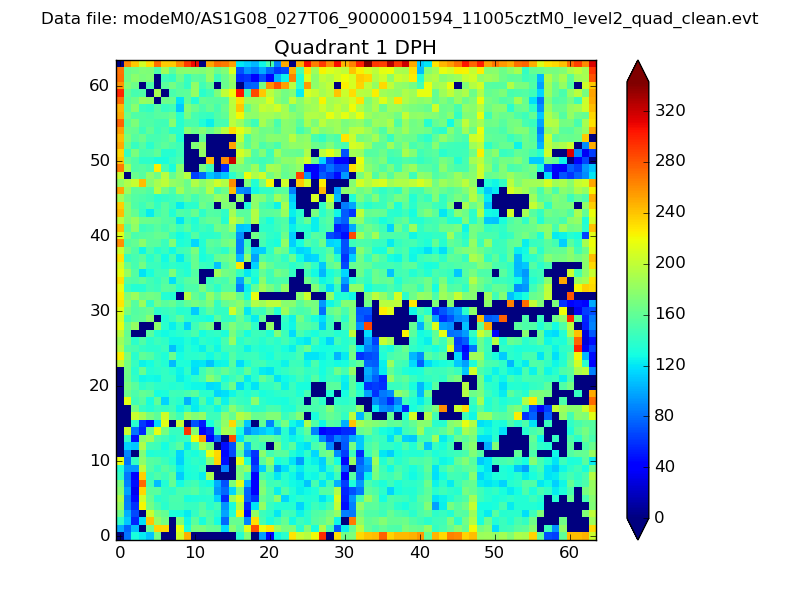 |
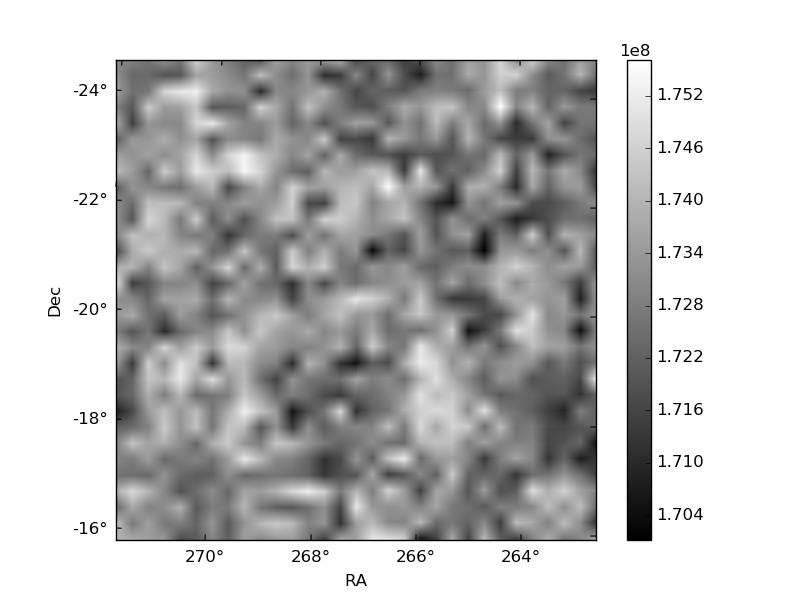
Quadrant B |
|---|---|---|---|
| Quadrant D | 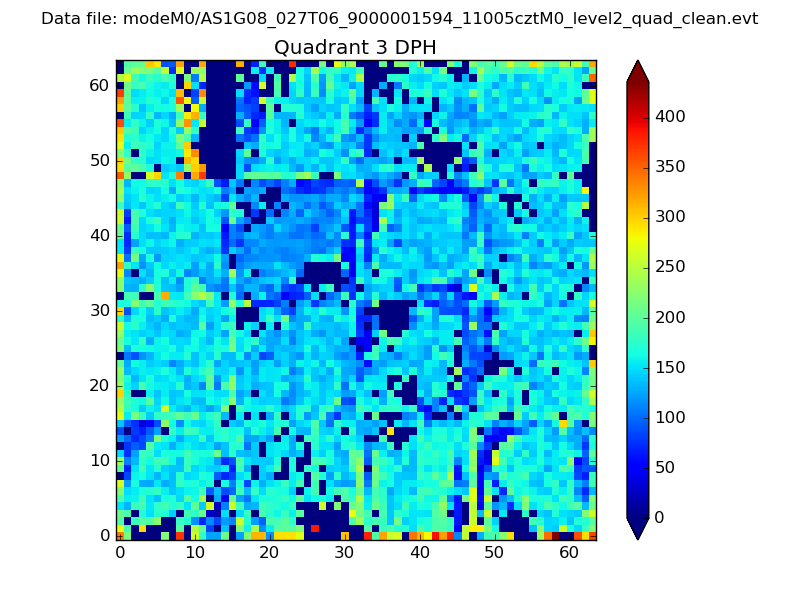 |
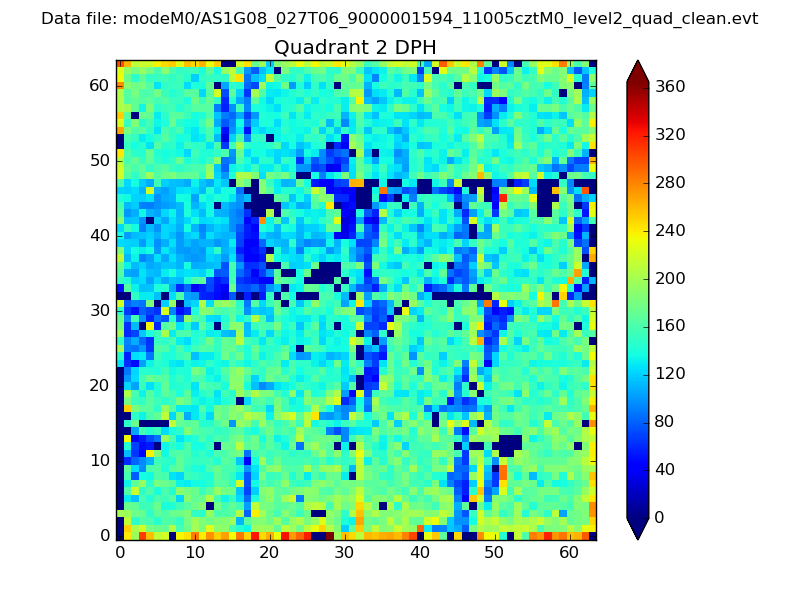 |
Quadrant C |
| Plot type | Count rate plots | Images |
|---|---|---|
| Comparison with Poisson distribution Blue bars denote a histogram of data divided into 1 sec bins. Red curve is a Poisson curve with rate = median count rate of data. |
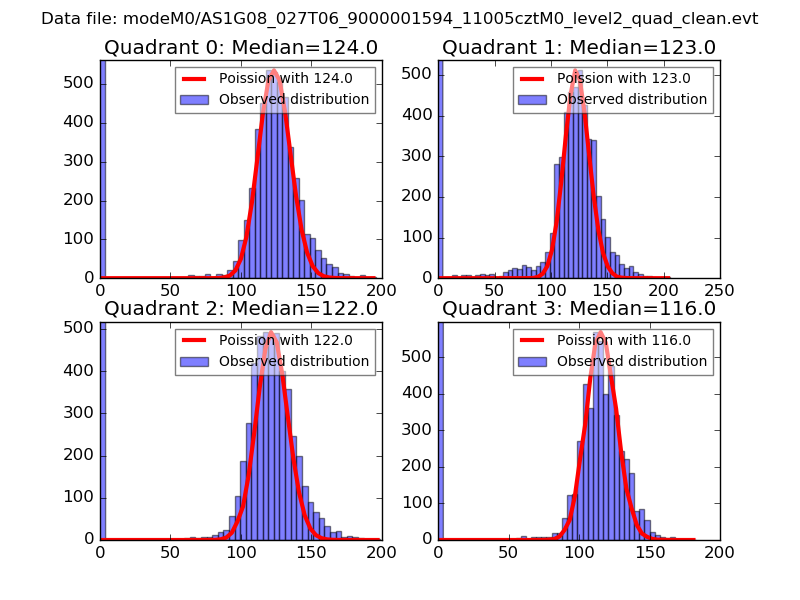 |
 |
| Quadrant-wise count rates Data is divided into 100 sec bins |
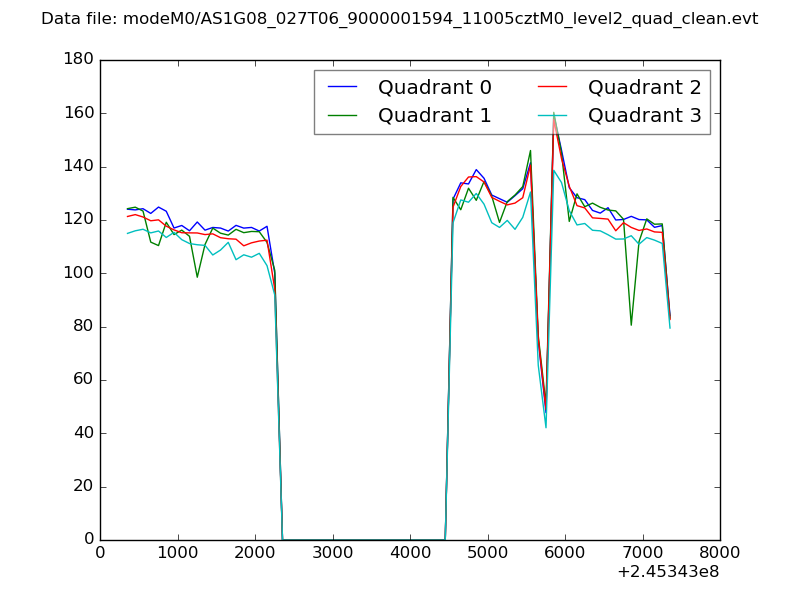 |
|
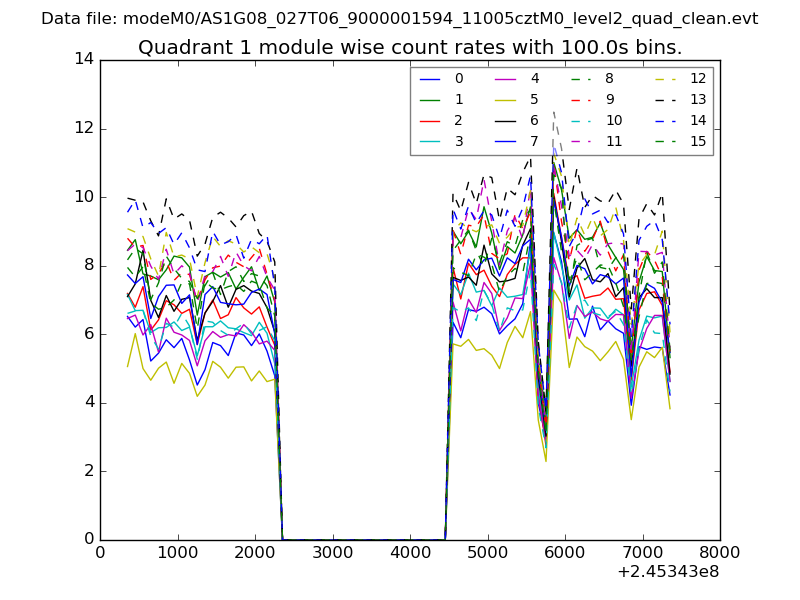
| Module-wise count rates for Quadrant A Data is divided into 100 sec bins |
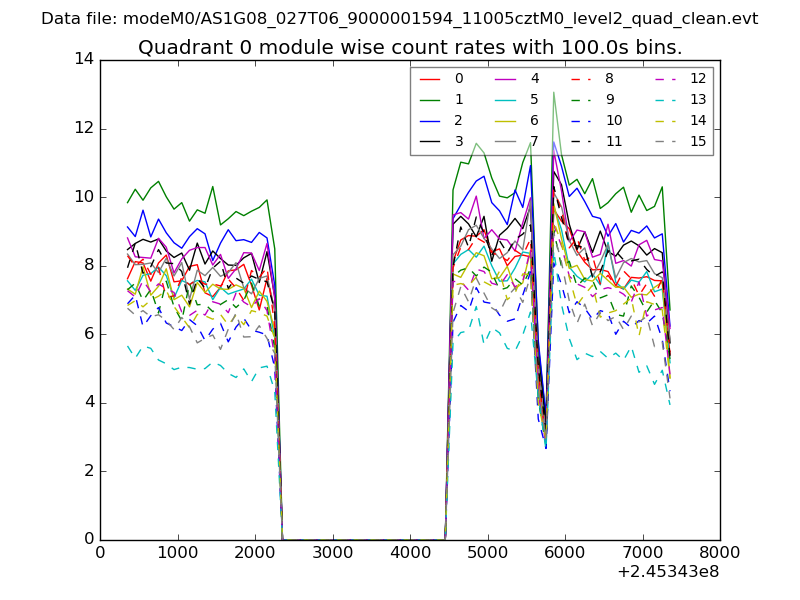 |
 |
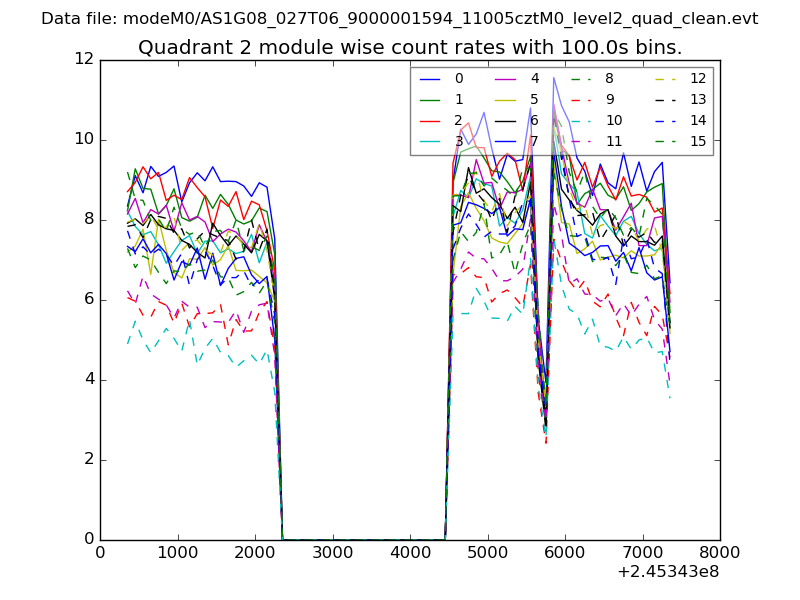
| Module-wise count rates for Quadrant B Data is divided into 100 sec bins |
 |
 |
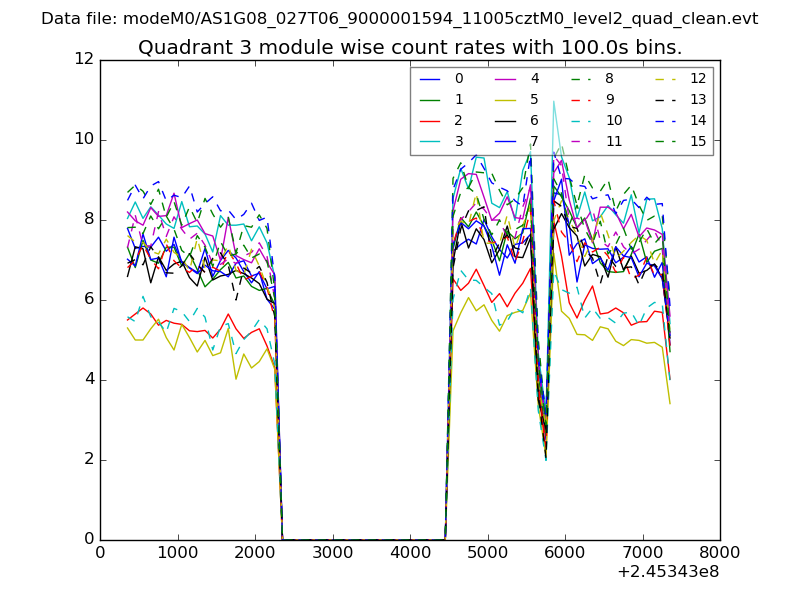
| Module-wise count rates for Quadrant C Data is divided into 100 sec bins |
 |
 |
| Module-wise count rates for Quadrant D Data is divided into 100 sec bins |
 |
 |
| Parameter | Plot |
|---|---|
| CZT HV Monitor | 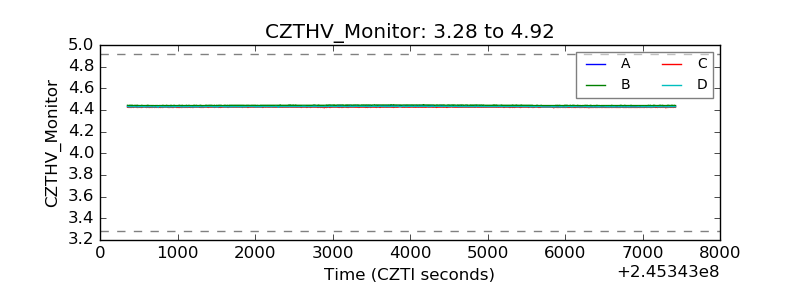 |
| D_VDD | 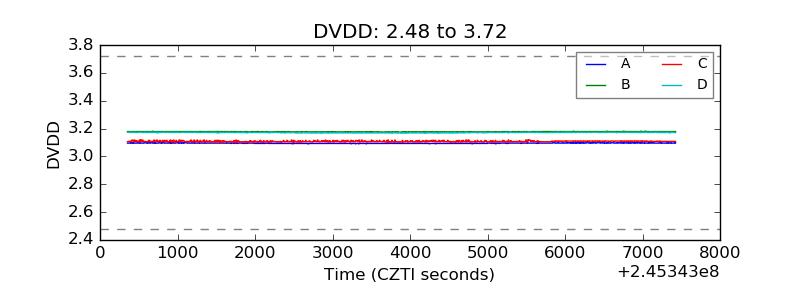 |
| Temperature 1 | 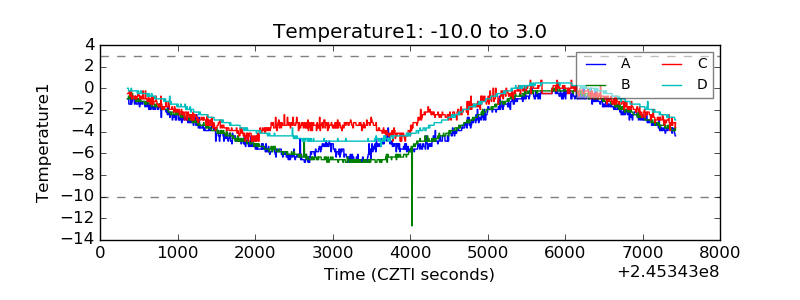 |
| Veto HV Monitor | 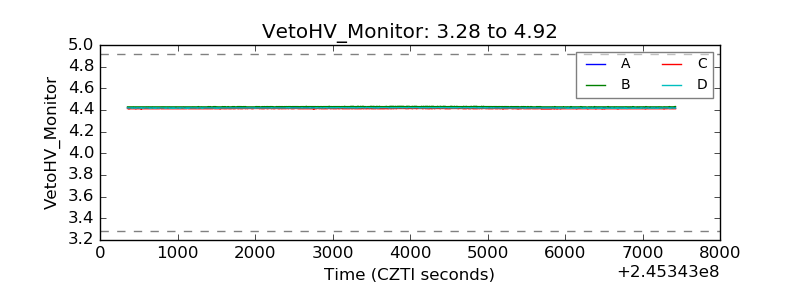 |
| Veto LLD | 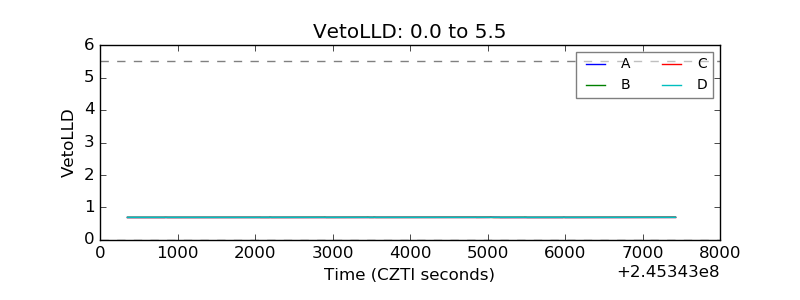 |
| Alpha Counter | 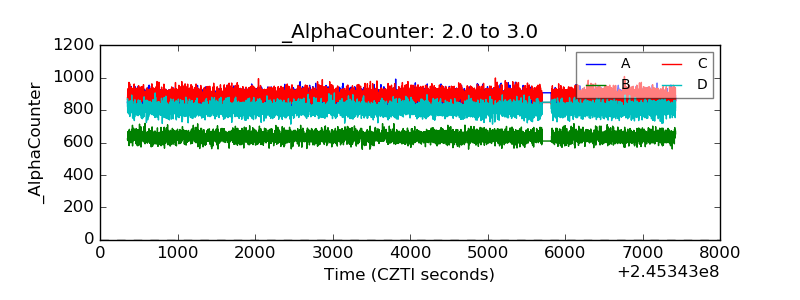 |
| _CPM_Rate | 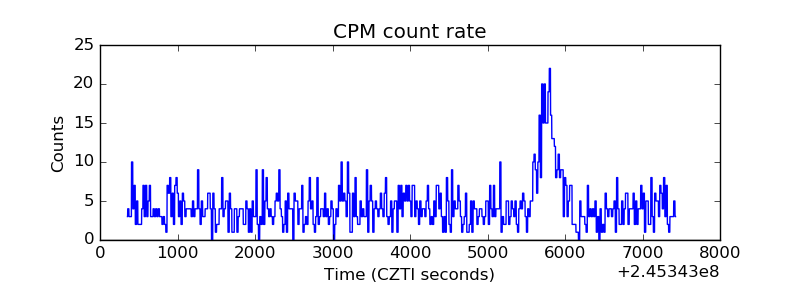 |
| CZT Counter | 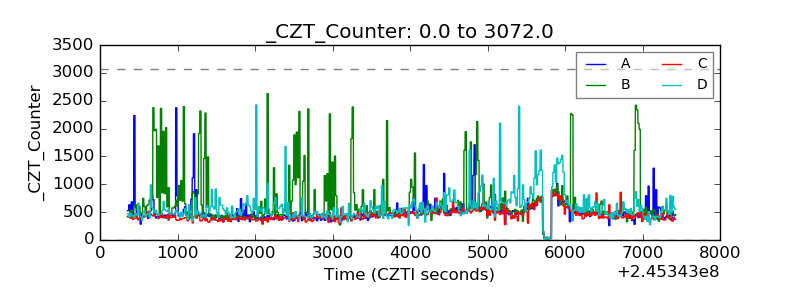 |
| +2.5 Volts monitor |  |
| +5 Volts monitor |  |
| _ROLL_ROT | 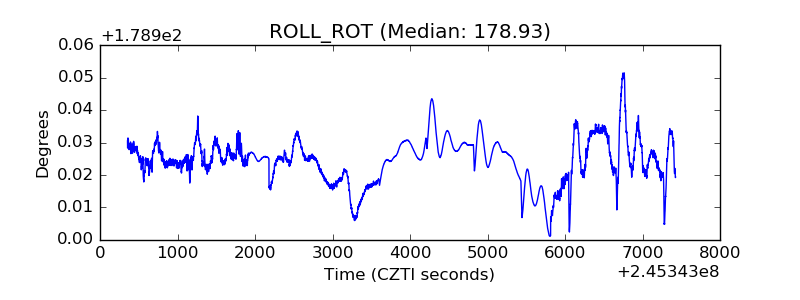 |
| _Roll_DEC | 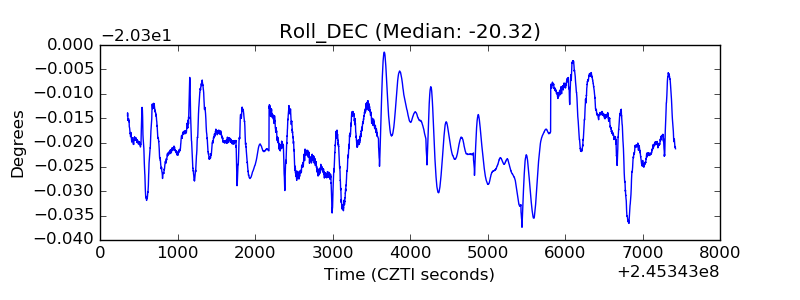 |
| _Roll_RA | 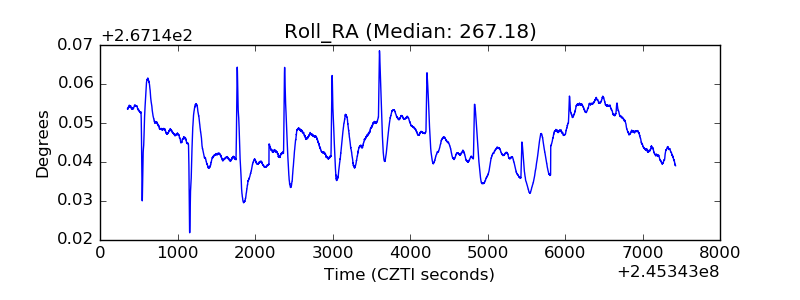 |
| Veto Counter | 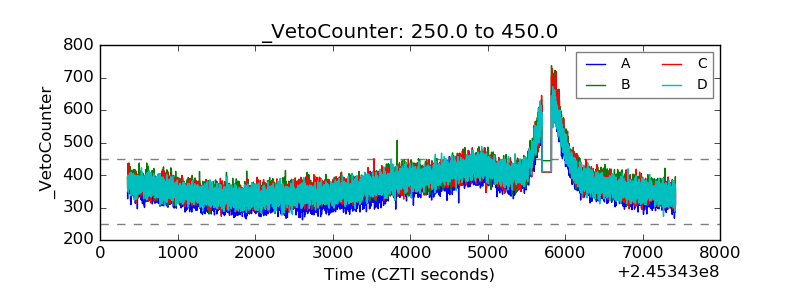 |