| Param | Original file | Final file |
|---|---|---|
| Filename | modeM0/AS1G08_027T06_9000001594_11009cztM0_level2.evt | modeM0/AS1G08_027T06_9000001594_11009cztM0_level2_quad_clean.evt |
| Size (bytes) | 14,345,280 | 2,041,920 |
| Size | 13.7 MB | 1.9 MB |
| Events in quadrant A | 112,233 | 8,941 |
| Events in quadrant B | 100,738 | 8,751 |
| Events in quadrant C | 107,930 | 10,804 |
| Events in quadrant D | 94,949 | 9,174 |
| Mode M9 | |||
|---|---|---|---|
| Quadrant | BADHDUFLAG | Total packets | Discarded packets |
| A | 0 | 3 | 2 |
| B | 0 | 3 | 2 |
| C | 0 | 3 | 2 |
| D | 0 | 3 | 2 |
| Mode M0 | |||
|---|---|---|---|
| Quadrant | BADHDUFLAG | Total packets | Discarded packets |
| A | 0 | 15907 | 15439 |
| B | 0 | 15309 | 14876 |
| C | 0 | 12221 | 11718 |
| D | 0 | 14751 | 14346 |
| Mode SS | |||
|---|---|---|---|
| Quadrant | BADHDUFLAG | Total packets | Discarded packets |
| A | 0 | 123 | 119 |
| B | 0 | 121 | 113 |
| C | 0 | 122 | 115 |
| D | 0 | 124 | 120 |
| Quadrant | Total seconds | Saturated seconds | Saturation percentage |
|---|---|---|---|
| A | 219 | 1 | 0.456621% |
| B | 207 | 1 | 0.483092% |
| C | 251 | 0 | 0.000000% |
| D | 190 | 1 | 0.526316% |
Noise dominated data is calculated using 1-second bins in cleaned event files. If a bin has >2000 counts, and if more than 50% of those come from <1% of pixels, then it is considered to be noise-dominated and hence unusable.
| Quadrant | # 1 sec bins | Bins with >0 counts | Bins with >2000 counts | High rate bins dominated by noise | Noise dominated (total time) | Noise dominated (detector-on time) | Marked lightcurve |
|---|---|---|---|---|---|---|---|
| A | 4890 | 397 | 1 | 1 | 0.02% | 0.25% | 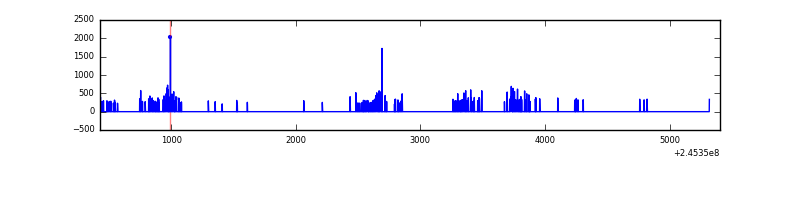 |
| B | 3992 | 371 | 1 | 1 | 0.03% | 0.27% | 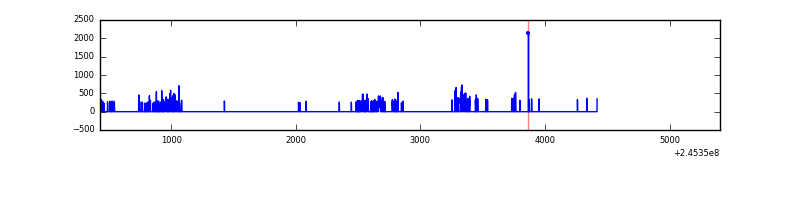 |
| C | 4971 | 446 | 0 | 0 | 0.00% | 0.00% | 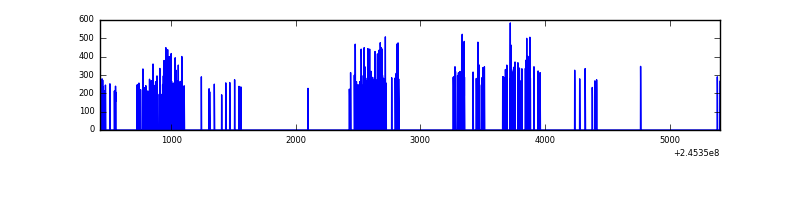 |
| D | 4791 | 342 | 0 | 0 | 0.00% | 0.00% | 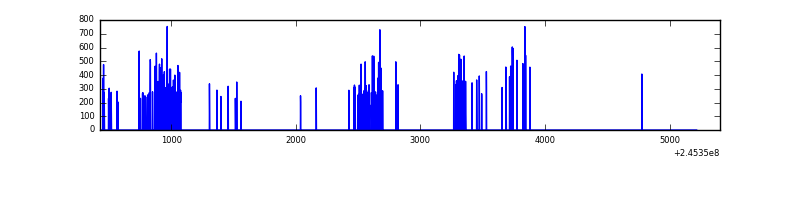 |
Top three noisy pixels from each quadrant. If the there are fewer than three noisy pixels in the level2.evt file, extra rows are filled as -1
| Pixel properties | Quadrant properties | ||||||
|---|---|---|---|---|---|---|---|
| Quadrant | DetID | PixID | Counts | Sigma | Mean | Median | Sigma |
| A | 8 | 5 | 10234 | 1407.0 | 25 | 24 | 7.3 |
| A | 8 | 15 | 3813 | 522.15 | 25 | 24 | 7.3 |
| A | 14 | 254 | 284 | 35.83 | 25 | 24 | 7.3 |
| B | 4 | 239 | 7299 | 1111.58 | 23 | 22 | 6.5 |
| B | 0 | 219 | 1113 | 166.65 | 23 | 22 | 6.5 |
| B | 0 | 189 | 660 | 97.46 | 23 | 22 | 6.5 |
| C | 13 | 61 | 204 | 21.76 | 27 | 27 | 8.1 |
| C | 8 | 222 | 95 | 8.36 | 27 | 27 | 8.1 |
| C | 3 | 202 | 81 | 6.64 | 27 | 27 | 8.1 |
| D | 11 | 129 | 10902 | 1634.25 | 20 | 19 | 6.7 |
| D | 1 | 52 | 4846 | 724.85 | 20 | 19 | 6.7 |
| D | 8 | 195 | 1565 | 232.16 | 20 | 19 | 6.7 |
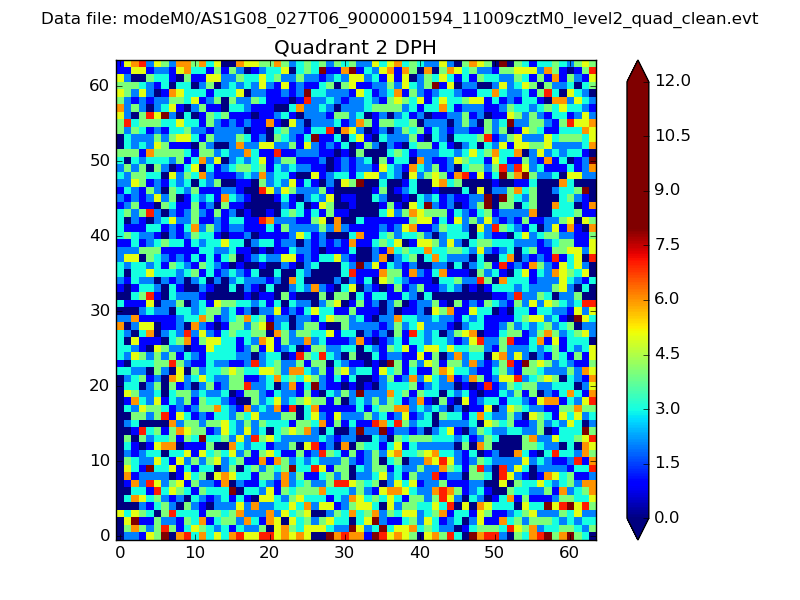
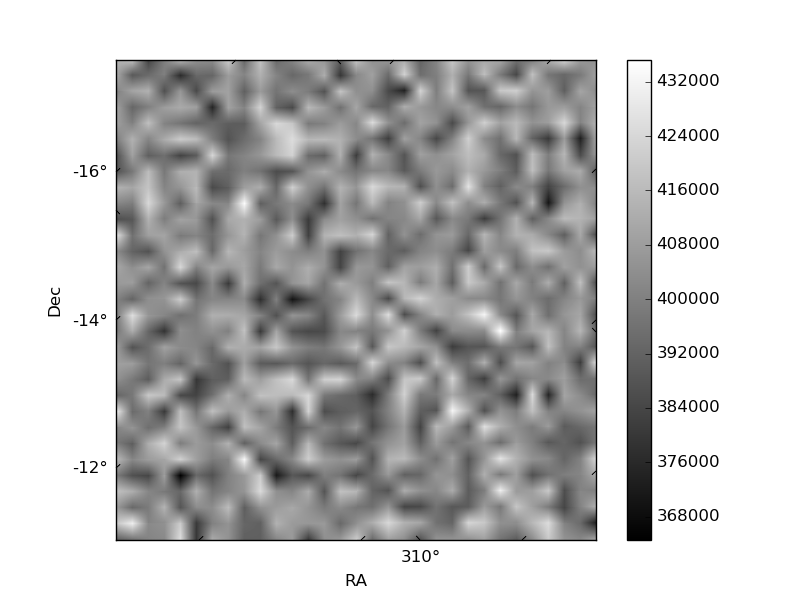
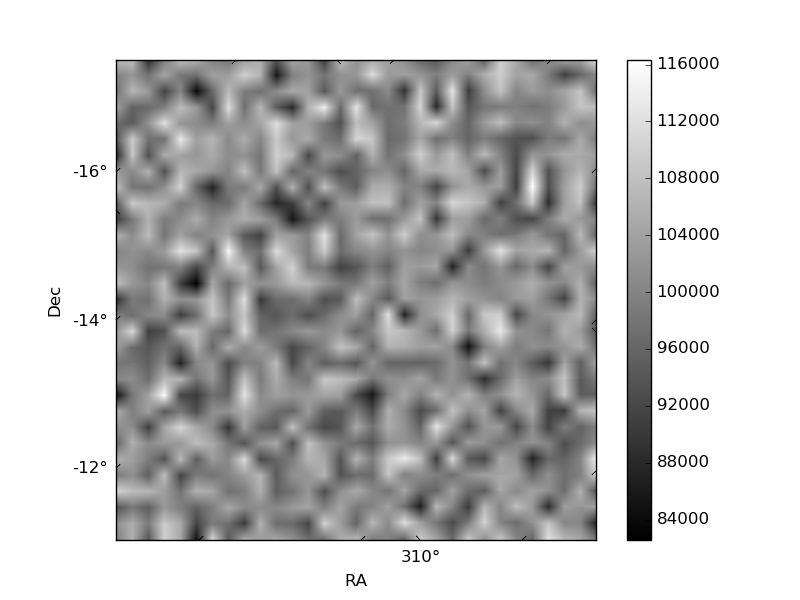
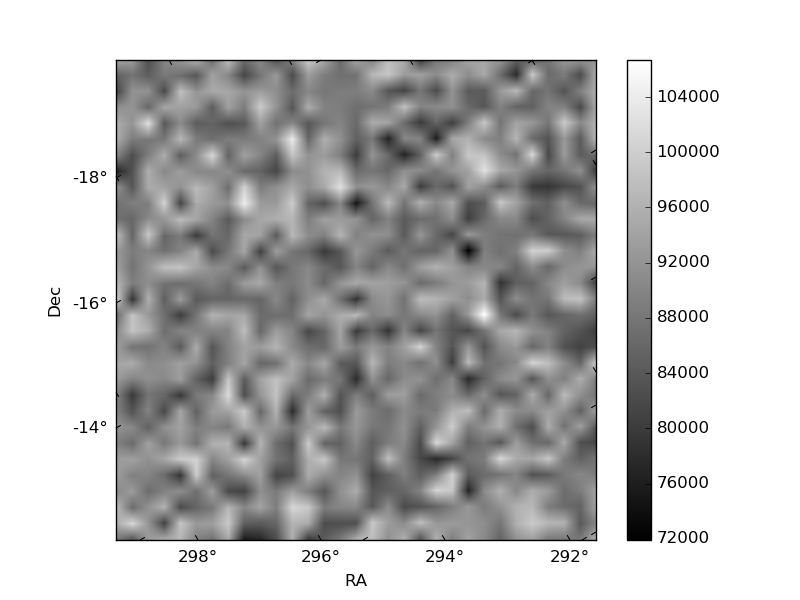
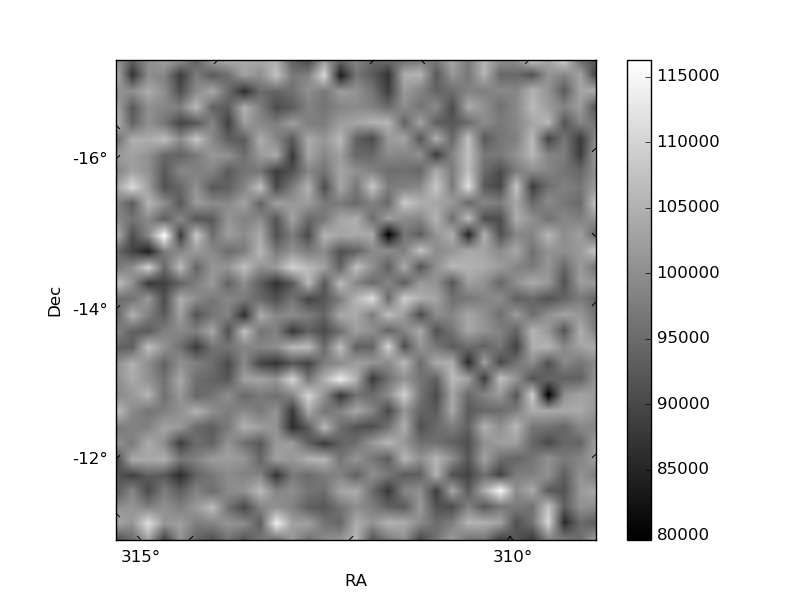
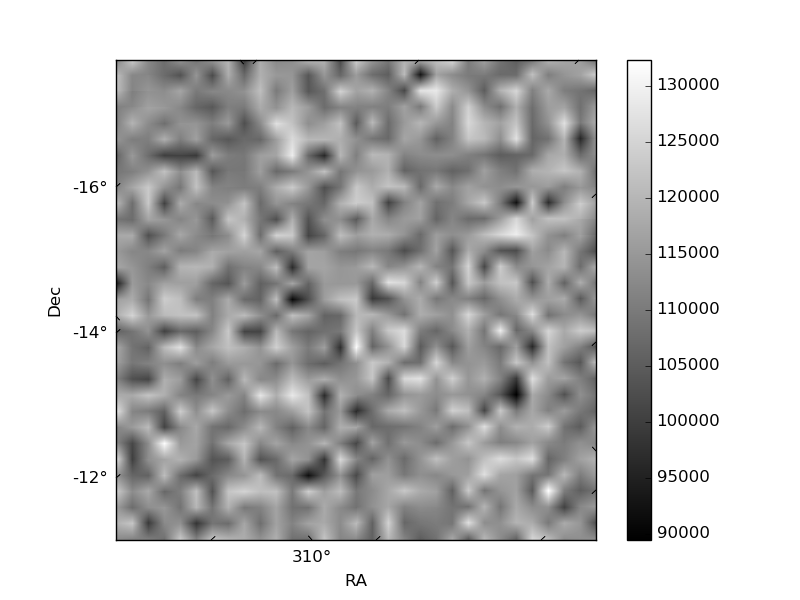
Histogram calculated using DETX and DETY for each event in the final _common_clean file
| Quadrant A | 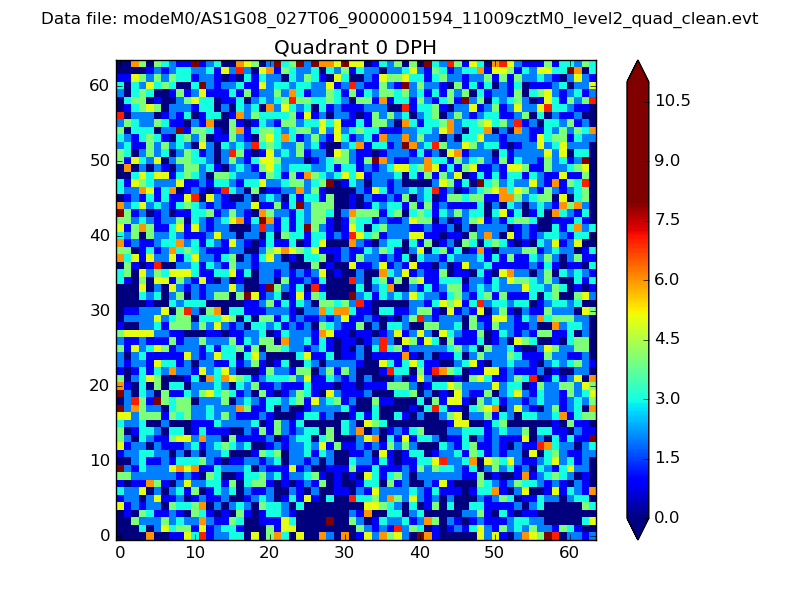 |
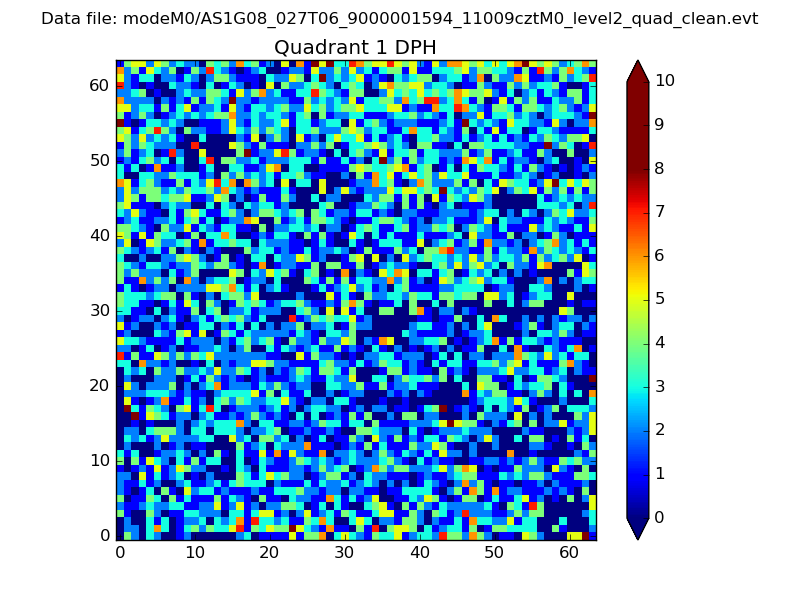 |
Quadrant B |
|---|---|---|---|
| Quadrant D | 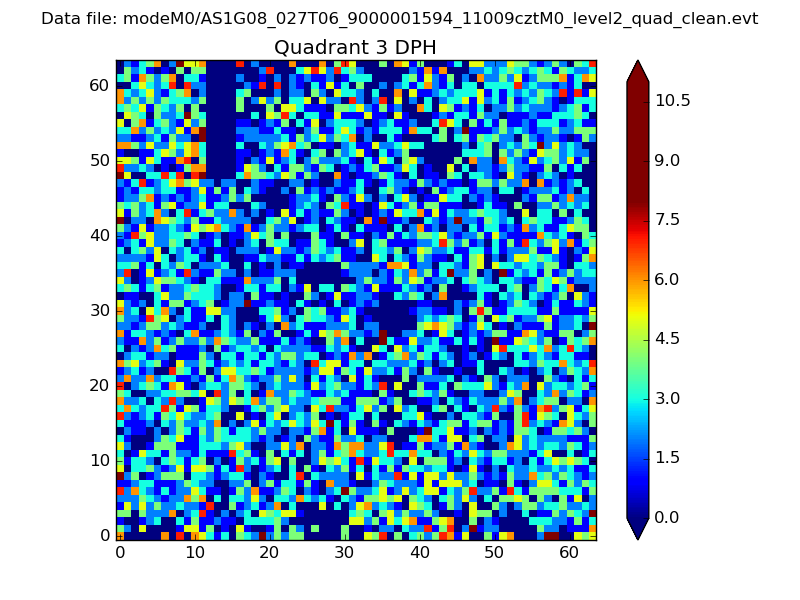 |
 |
Quadrant C |
| Plot type | Count rate plots | Images |
|---|---|---|
| Comparison with Poisson distribution Blue bars denote a histogram of data divided into 1 sec bins. Red curve is a Poisson curve with rate = median count rate of data. |
 |
 |
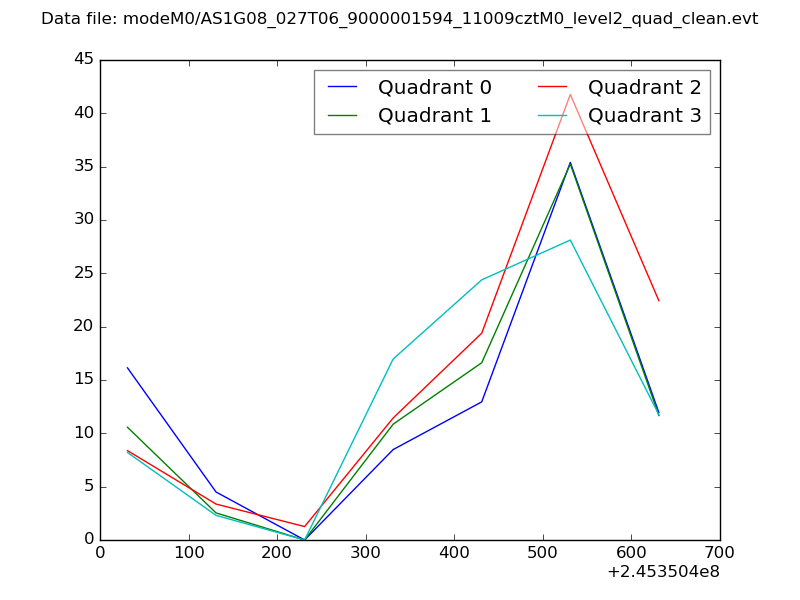
| Quadrant-wise count rates Data is divided into 100 sec bins |
 |
|
| Module-wise count rates for Quadrant A Data is divided into 100 sec bins |
 |
 |
| Module-wise count rates for Quadrant B Data is divided into 100 sec bins |
 |
 |
| Module-wise count rates for Quadrant C Data is divided into 100 sec bins |
 |
 |
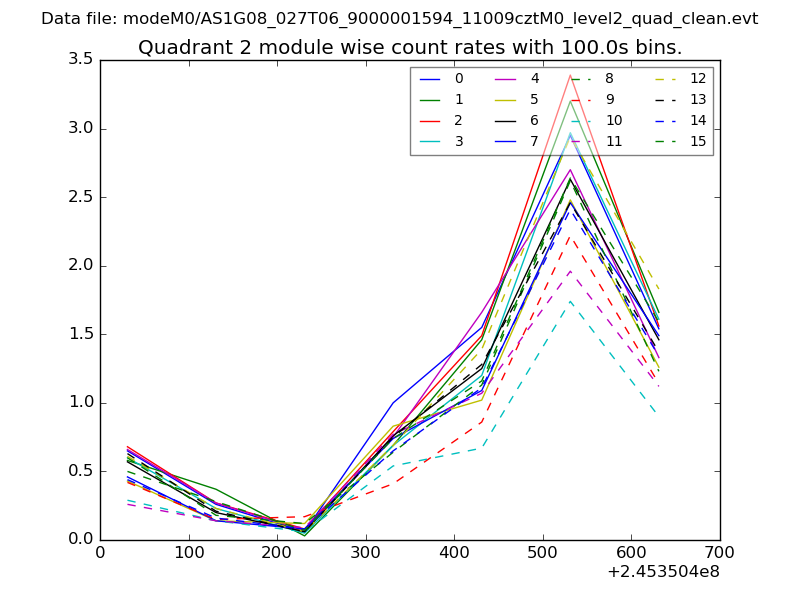
| Module-wise count rates for Quadrant D Data is divided into 100 sec bins |
 |
 |
| Parameter | Plot |
|---|---|
| CZT HV Monitor | 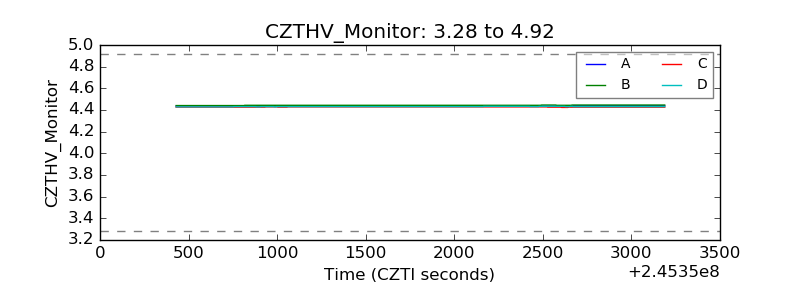 |
| D_VDD | 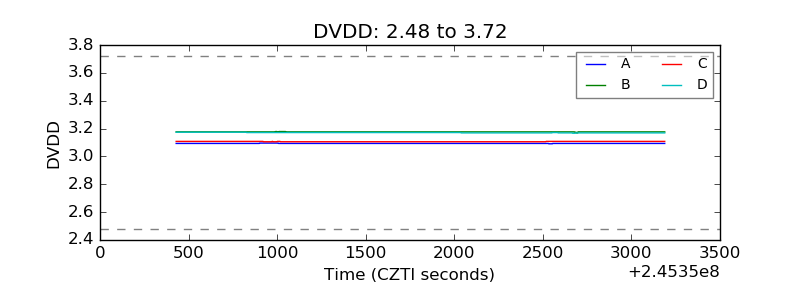 |
| Temperature 1 | 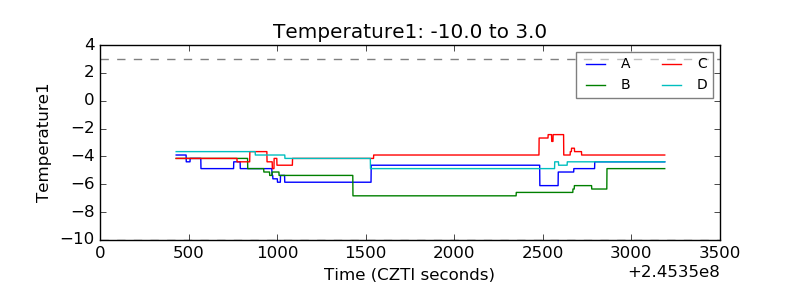 |
| Veto HV Monitor | 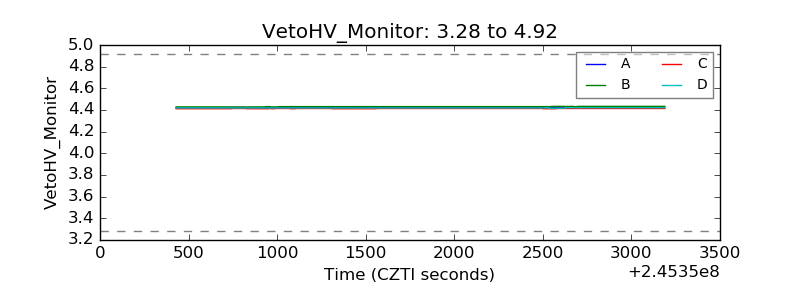 |
| Veto LLD | 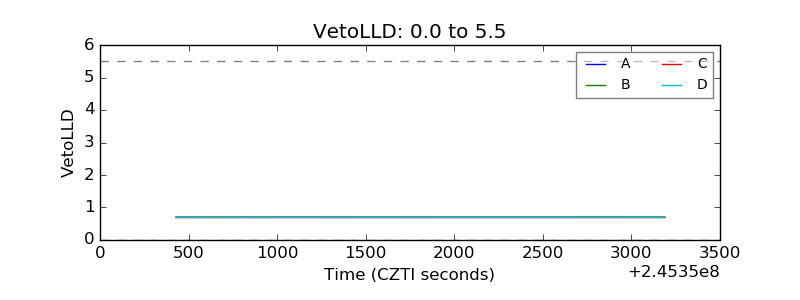 |
| Alpha Counter | 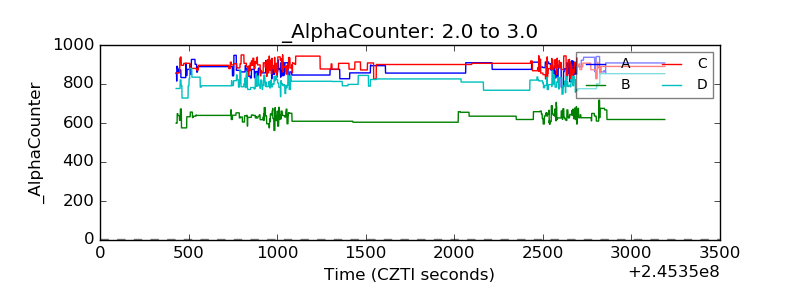 |
| _CPM_Rate | 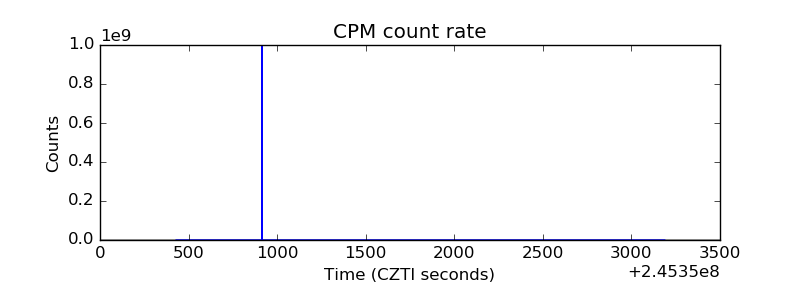 |
| CZT Counter | 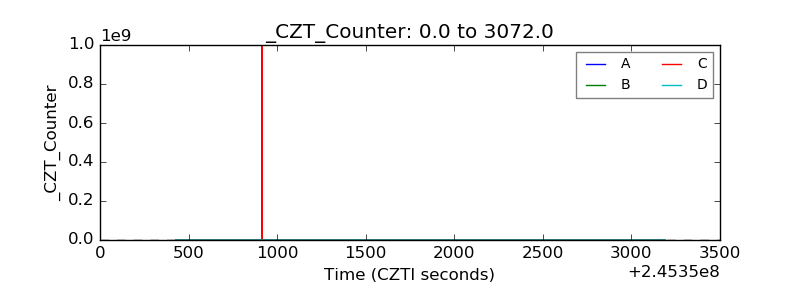 |
| +2.5 Volts monitor | 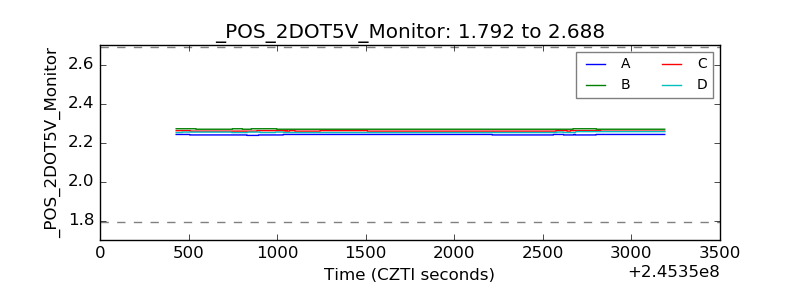 |
| +5 Volts monitor |  |
| _ROLL_ROT | 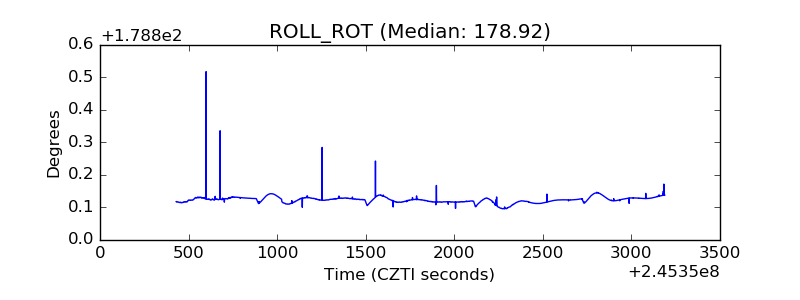 |
| _Roll_DEC | 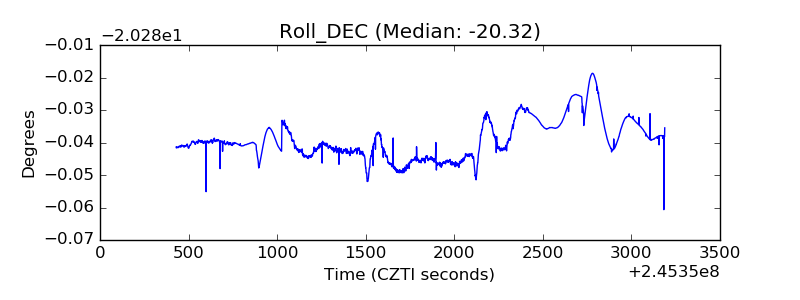 |
| _Roll_RA | 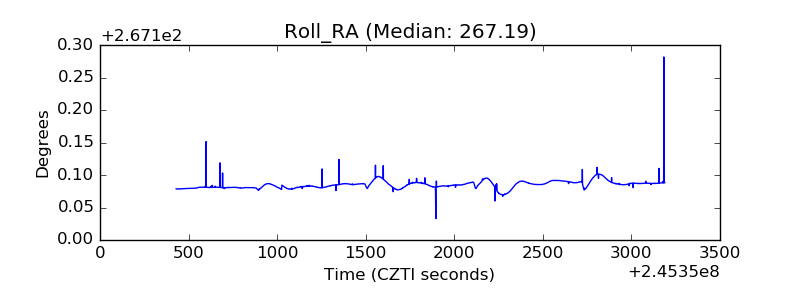 |
| Veto Counter | 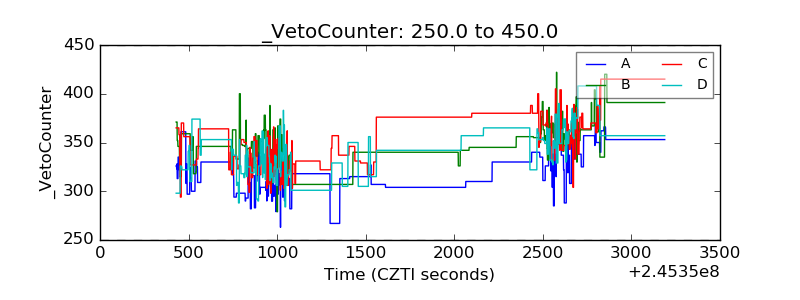 |