| Param | Original file | Final file |
|---|---|---|
| Filename | modeM0/AS1G08_027T06_9000001594_11010cztM0_level2.evt | modeM0/AS1G08_027T06_9000001594_11010cztM0_level2_quad_clean.evt |
| Size (bytes) | 490,720,320 | 75,144,960 |
| Size | 468.0 MB | 71.7 MB |
| Events in quadrant A | 4,133,205 | 465,032 |
| Events in quadrant B | 3,888,413 | 472,529 |
| Events in quadrant C | 2,738,780 | 469,661 |
| Events in quadrant D | 3,690,204 | 445,233 |
| Mode M9 | |||
|---|---|---|---|
| Quadrant | BADHDUFLAG | Total packets | Discarded packets |
| A | 0 | 3 | 0 |
| B | 0 | 3 | 0 |
| C | 0 | 3 | 0 |
| D | 0 | 3 | 0 |
| Mode M0 | |||
|---|---|---|---|
| Quadrant | BADHDUFLAG | Total packets | Discarded packets |
| A | 0 | 16273 | 12 |
| B | 0 | 15612 | 11 |
| C | 0 | 12500 | 15 |
| D | 0 | 15087 | 21 |
| Mode SS | |||
|---|---|---|---|
| Quadrant | BADHDUFLAG | Total packets | Discarded packets |
| A | 0 | 124 | 0 |
| B | 0 | 124 | 0 |
| C | 0 | 124 | 0 |
| D | 0 | 124 | 0 |
| Quadrant | Total seconds | Saturated seconds | Saturation percentage |
|---|---|---|---|
| A | 6052 | 313 | 5.171844% |
| B | 6052 | 315 | 5.204891% |
| C | 6049 | 22 | 0.363696% |
| D | 6049 | 67 | 1.107621% |
Noise dominated data is calculated using 1-second bins in cleaned event files. If a bin has >2000 counts, and if more than 50% of those come from <1% of pixels, then it is considered to be noise-dominated and hence unusable.
| Quadrant | # 1 sec bins | Bins with >0 counts | Bins with >2000 counts | High rate bins dominated by noise | Noise dominated (total time) | Noise dominated (detector-on time) | Marked lightcurve |
|---|---|---|---|---|---|---|---|
| A | 6381 | 6057 | 206 | 206 | 3.23% | 3.40% | 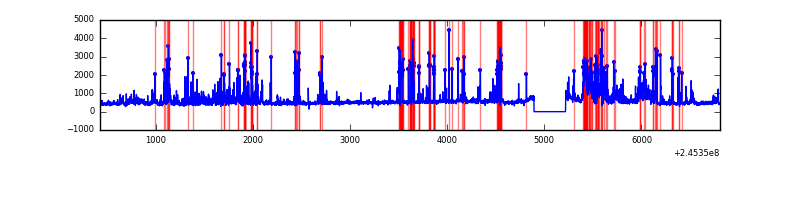 |
| B | 6381 | 6057 | 164 | 164 | 2.57% | 2.71% | 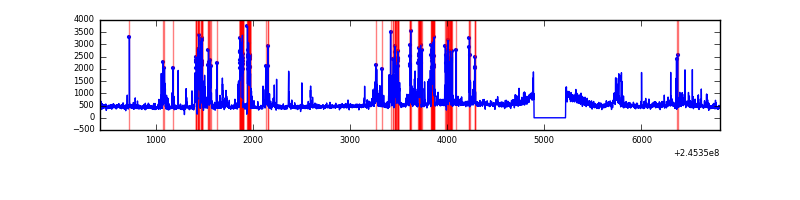 |
| C | 6381 | 6057 | 5 | 5 | 0.08% | 0.08% | 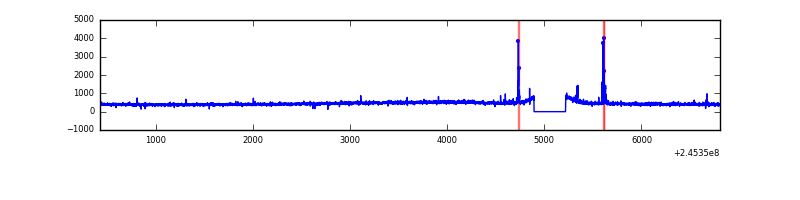 |
| D | 6381 | 6057 | 29 | 29 | 0.45% | 0.48% | 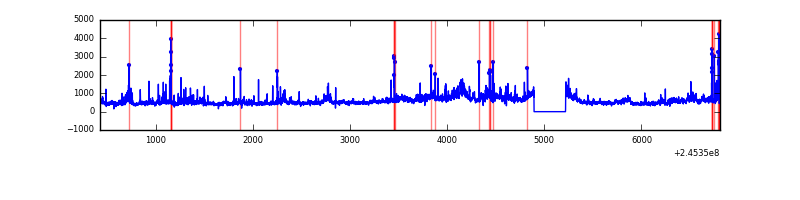 |
Top three noisy pixels from each quadrant. If the there are fewer than three noisy pixels in the level2.evt file, extra rows are filled as -1
| Pixel properties | Quadrant properties | ||||||
|---|---|---|---|---|---|---|---|
| Quadrant | DetID | PixID | Counts | Sigma | Mean | Median | Sigma |
| A | 8 | 5 | 990388 | 6807.4 | 701 | 687 | 145.4 |
| A | 14 | 238 | 377184 | 2589.64 | 701 | 687 | 145.4 |
| A | 8 | 15 | 42597 | 288.27 | 701 | 687 | 145.4 |
| B | 4 | 239 | 907124 | 6703.13 | 703 | 688 | 135.2 |
| B | 0 | 219 | 83199 | 610.17 | 703 | 688 | 135.2 |
| B | 15 | 204 | 65821 | 481.66 | 703 | 688 | 135.2 |
| C | 0 | 207 | 62454 | 385.86 | 684 | 689 | 160.1 |
| C | 13 | 61 | 5160 | 27.93 | 684 | 689 | 160.1 |
| C | 8 | 222 | 3434 | 17.15 | 684 | 689 | 160.1 |
| D | 11 | 129 | 425875 | 2564.19 | 680 | 659 | 165.8 |
| D | 1 | 52 | 205876 | 1237.52 | 680 | 659 | 165.8 |
| D | 8 | 195 | 202628 | 1217.94 | 680 | 659 | 165.8 |
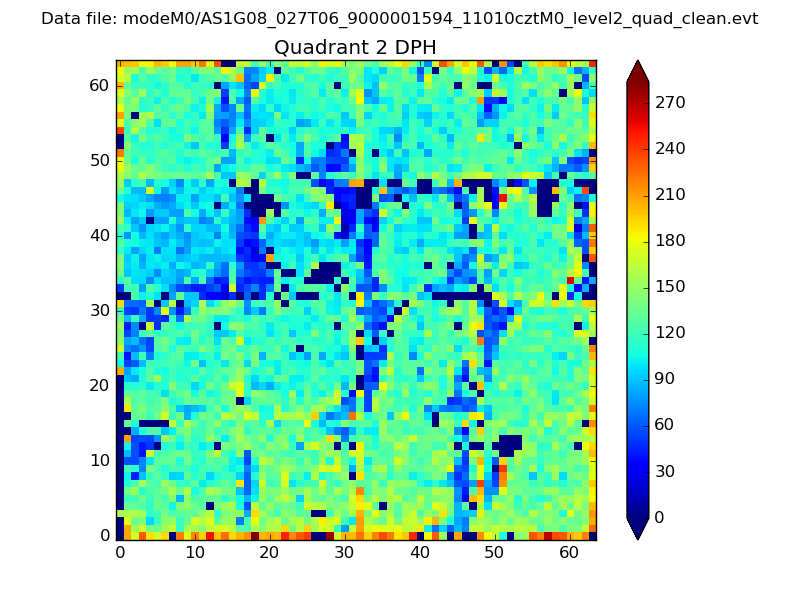
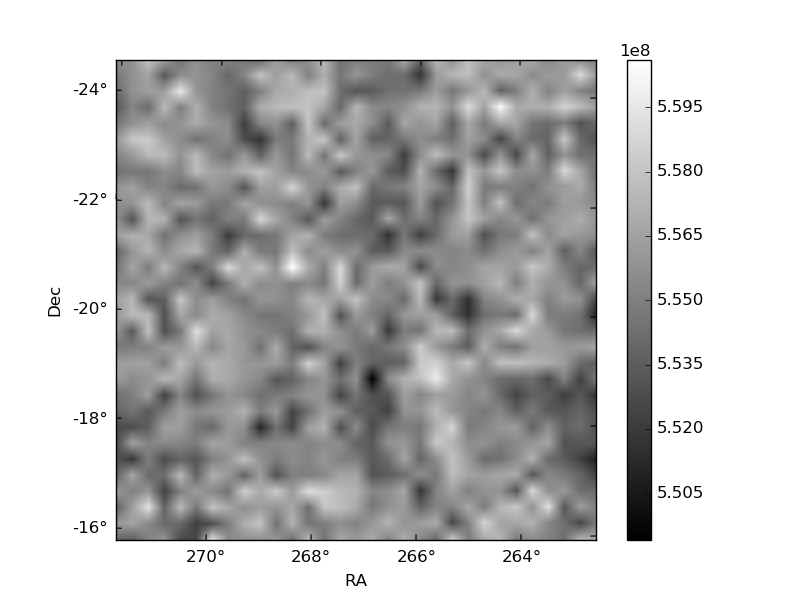
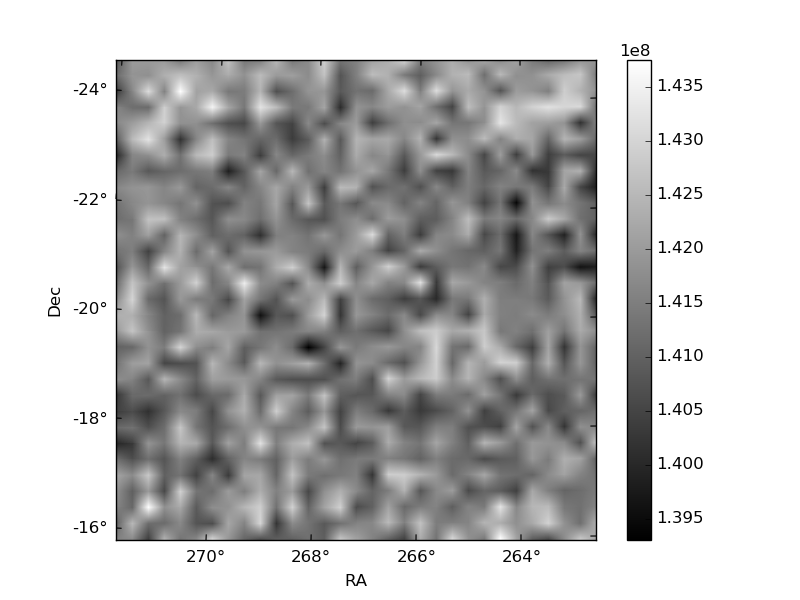
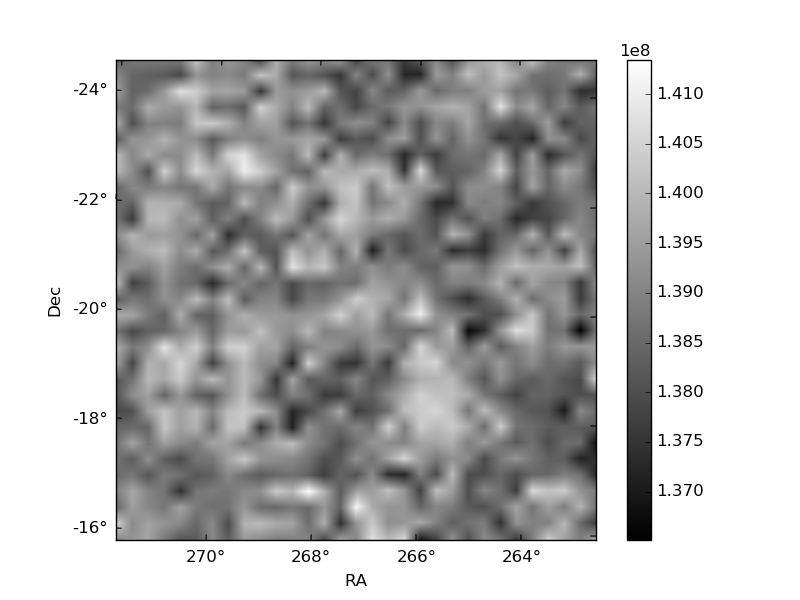
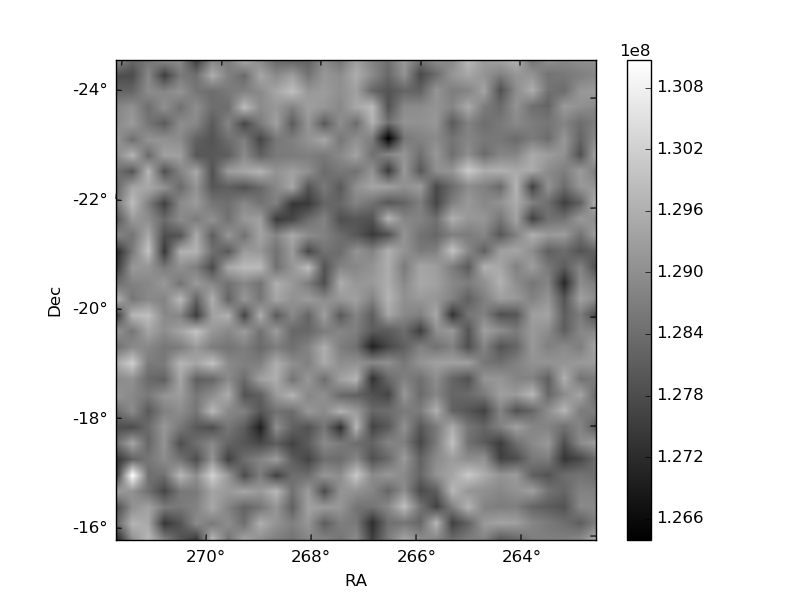
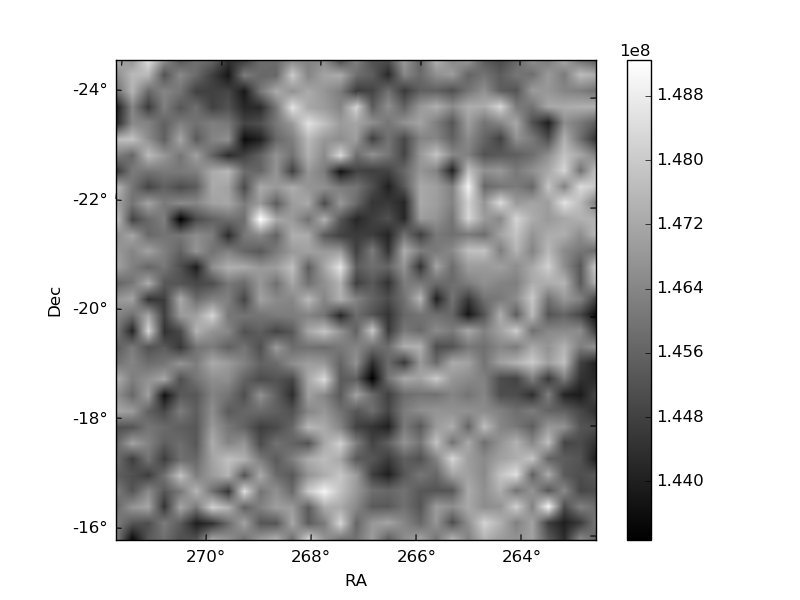
Histogram calculated using DETX and DETY for each event in the final _common_clean file
| Quadrant A | 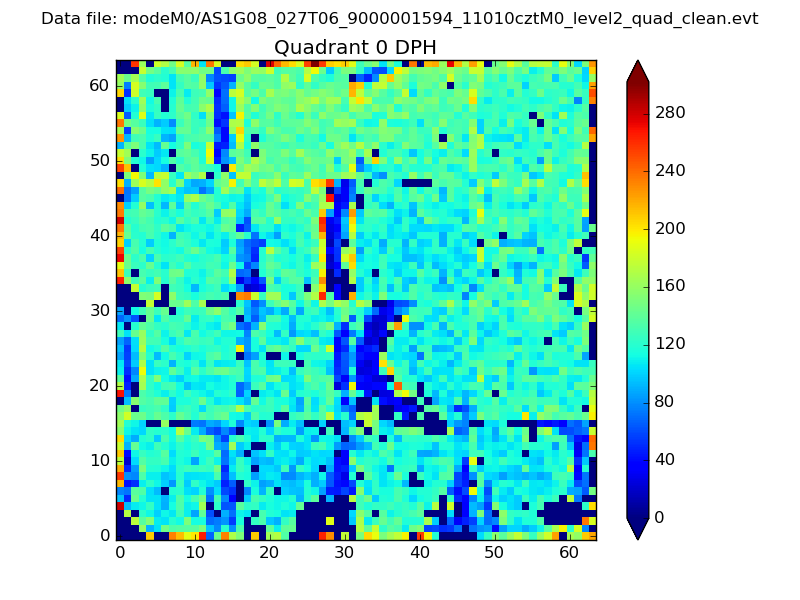 |
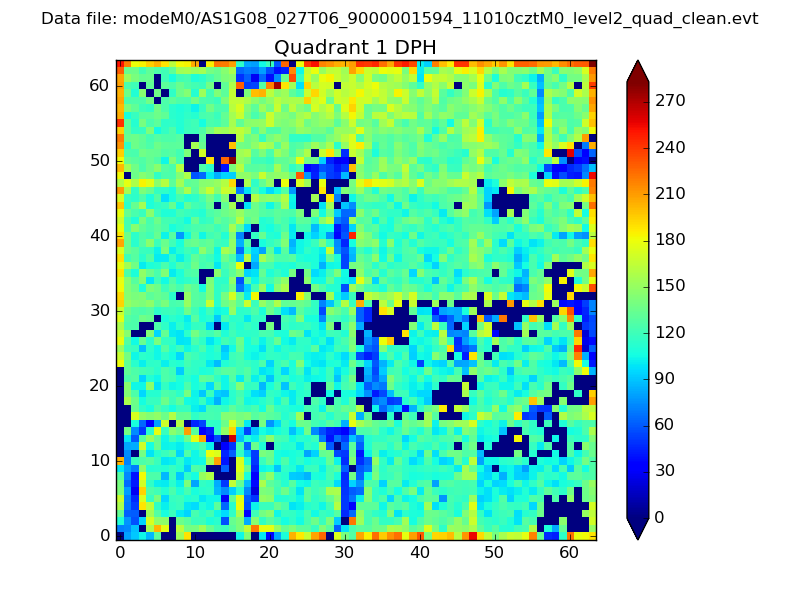 |
Quadrant B |
|---|---|---|---|
| Quadrant D | 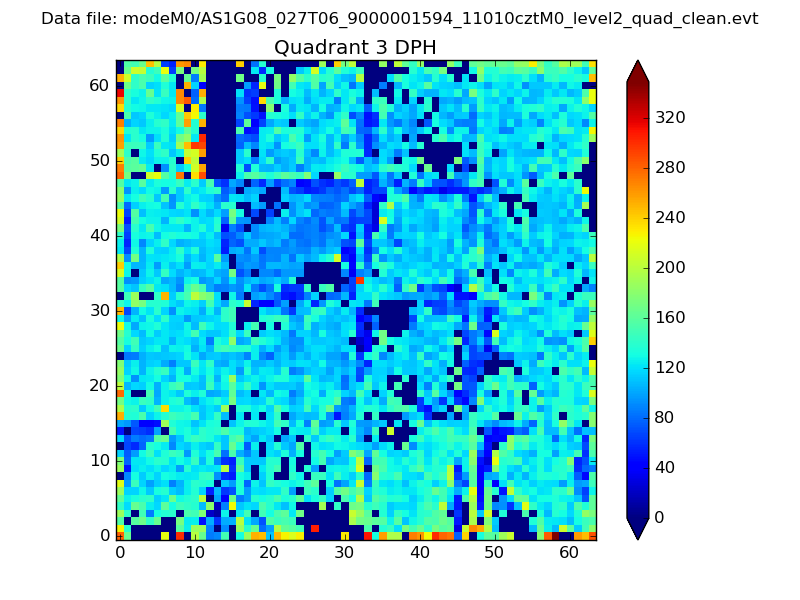 |
 |
Quadrant C |
| Plot type | Count rate plots | Images |
|---|---|---|
| Comparison with Poisson distribution Blue bars denote a histogram of data divided into 1 sec bins. Red curve is a Poisson curve with rate = median count rate of data. |
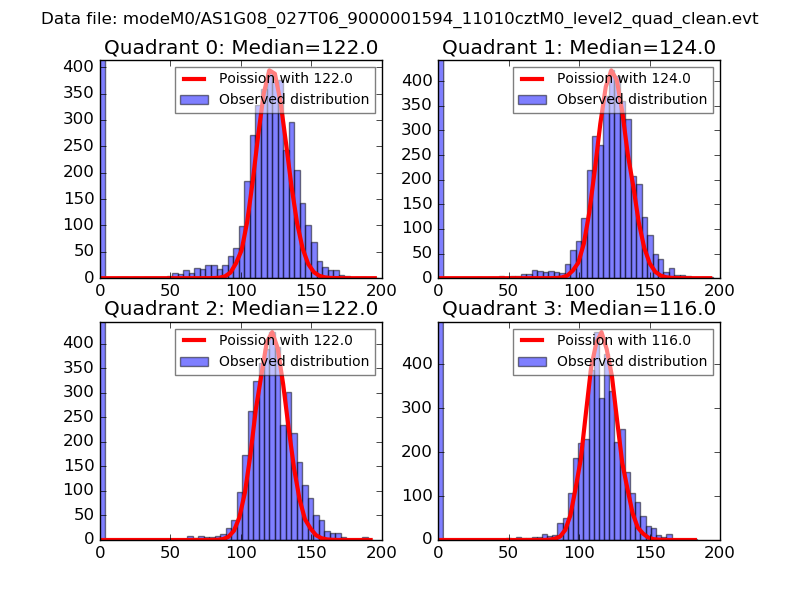 |
 |
| Quadrant-wise count rates Data is divided into 100 sec bins |
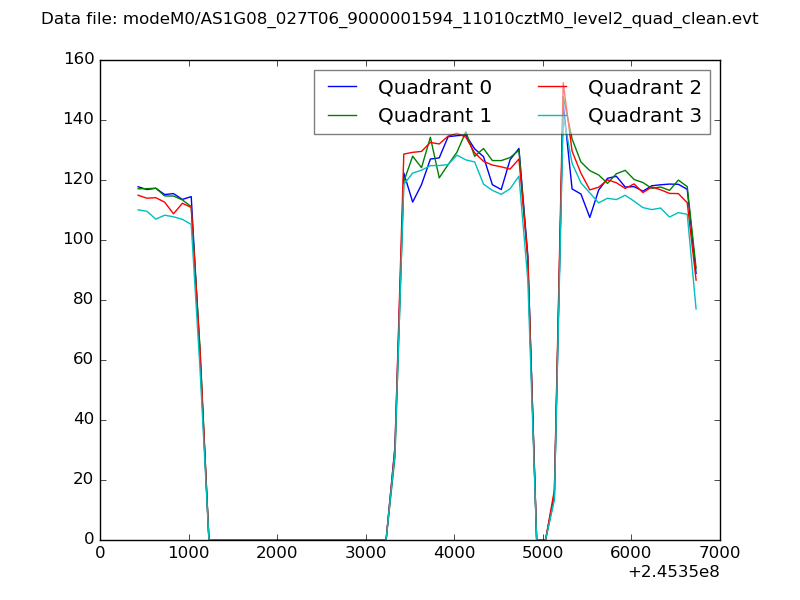 |
|
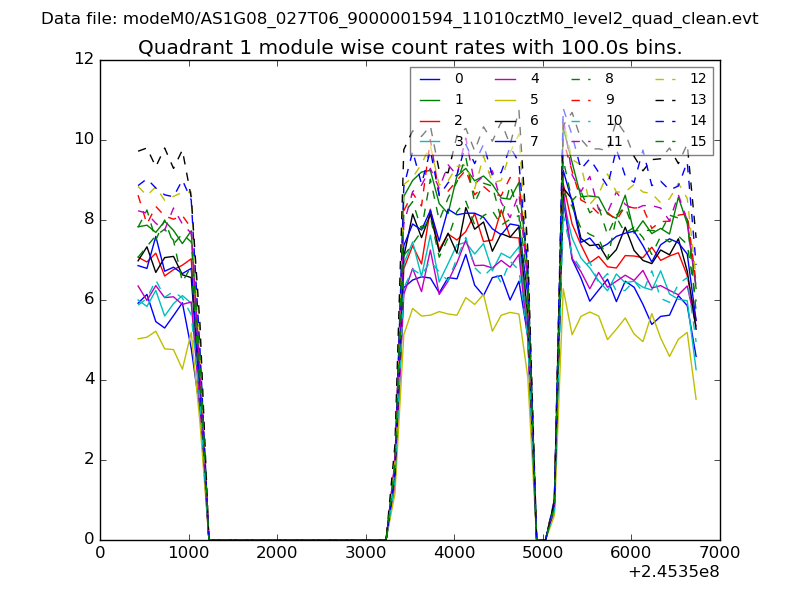
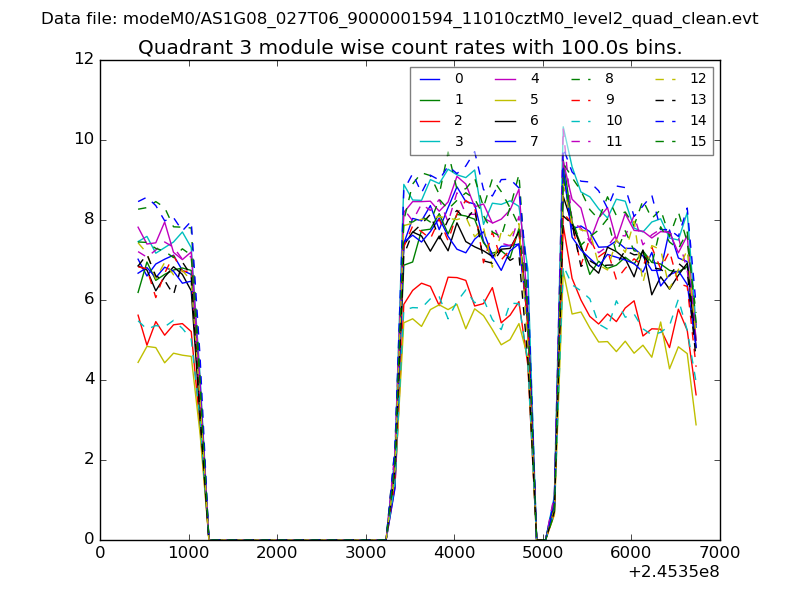
| Module-wise count rates for Quadrant A Data is divided into 100 sec bins |
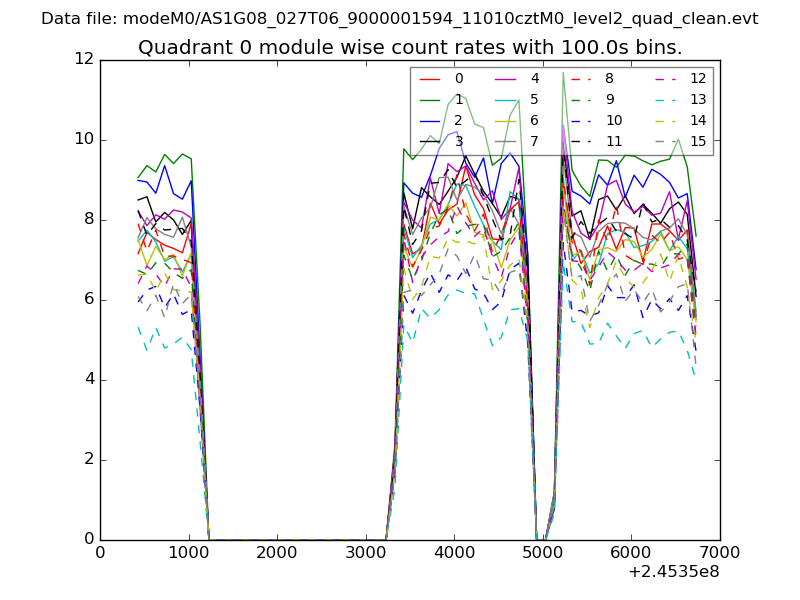 |
 |
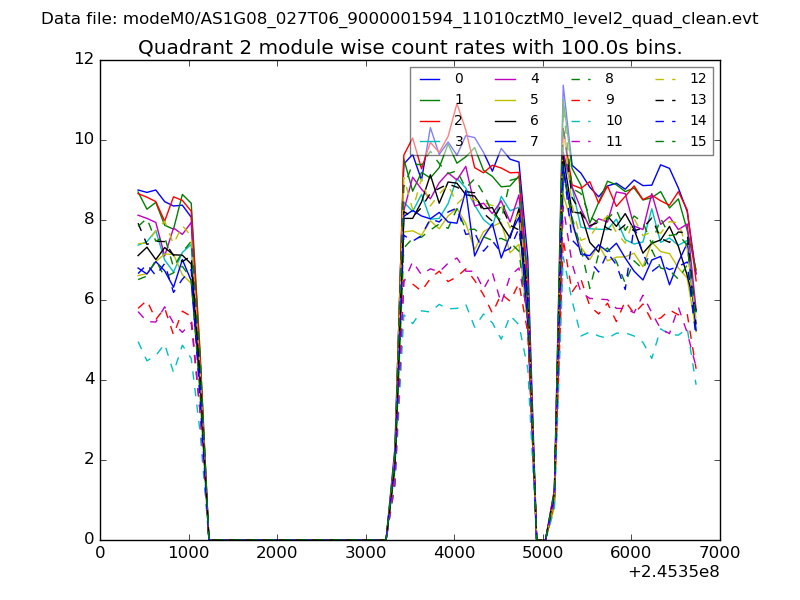
| Module-wise count rates for Quadrant B Data is divided into 100 sec bins |
 |
 |
| Module-wise count rates for Quadrant C Data is divided into 100 sec bins |
 |
 |
| Module-wise count rates for Quadrant D Data is divided into 100 sec bins |
 |
 |
| Parameter | Plot |
|---|---|
| CZT HV Monitor | 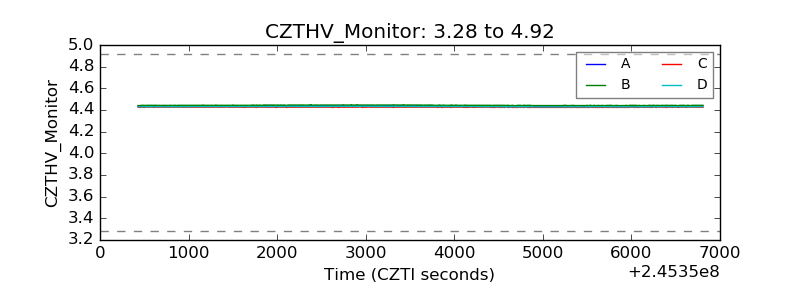 |
| D_VDD | 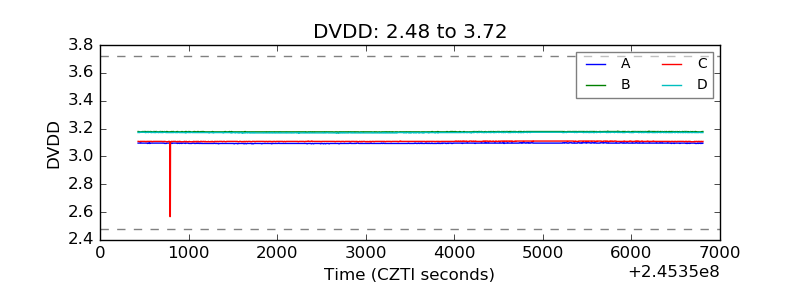 |
| Temperature 1 | 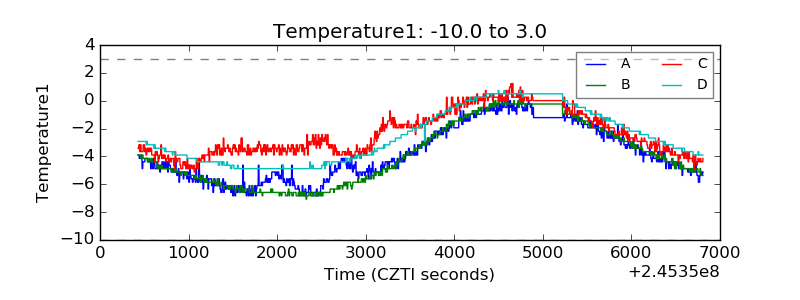 |
| Veto HV Monitor | 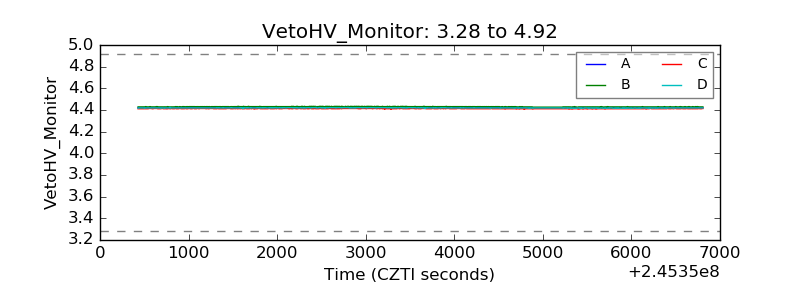 |
| Veto LLD | 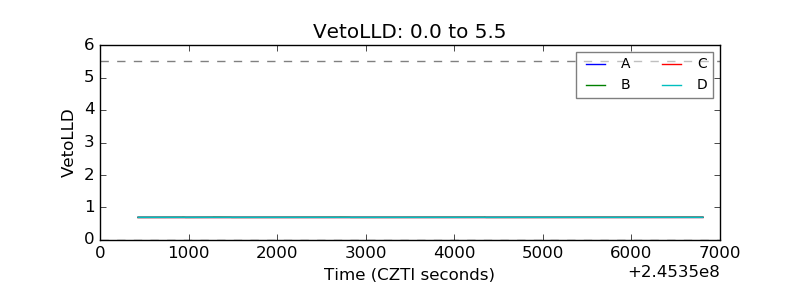 |
| Alpha Counter | 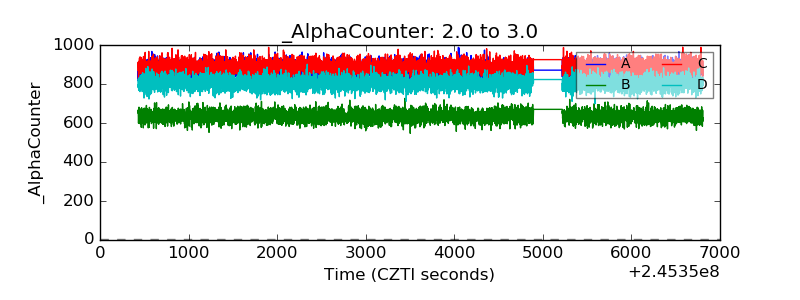 |
| _CPM_Rate | 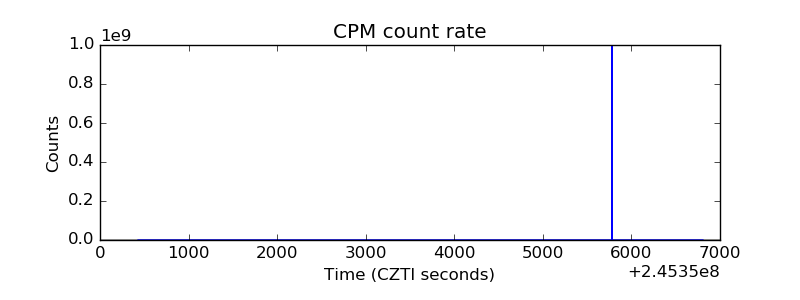 |
| CZT Counter | 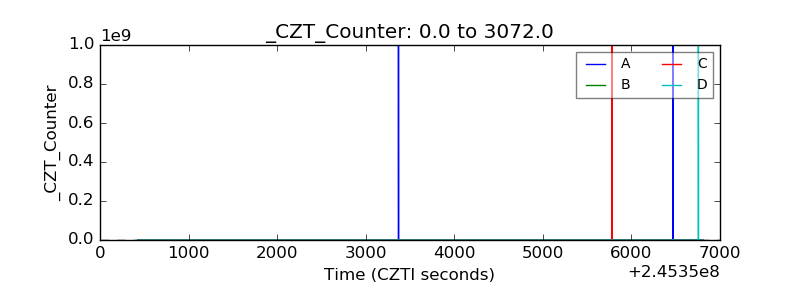 |
| +2.5 Volts monitor |  |
| +5 Volts monitor |  |
| _ROLL_ROT | 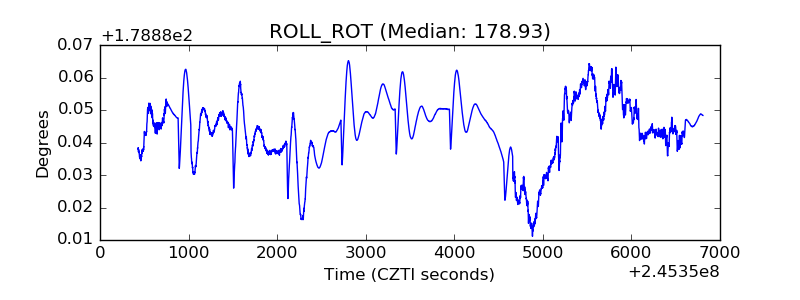 |
| _Roll_DEC | 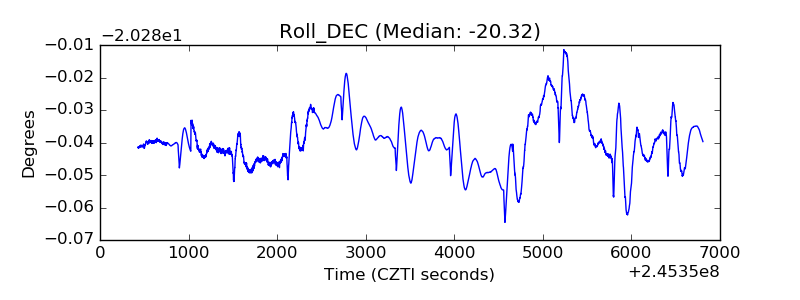 |
| _Roll_RA | 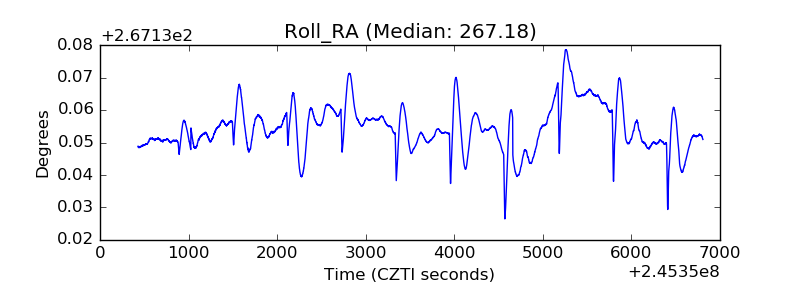 |
| Veto Counter | 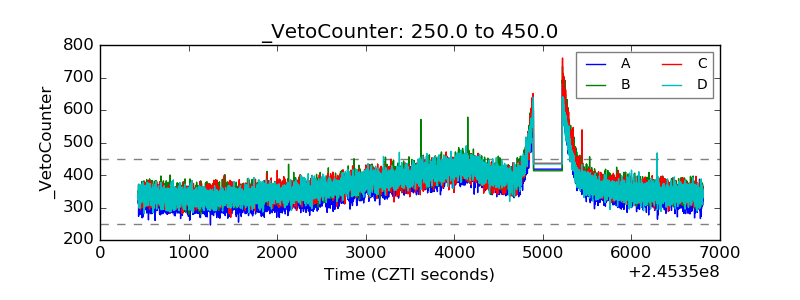 |