| Param | Original file | Final file |
|---|---|---|
| Filename | modeM0/AS1G08_027T06_9000001594_11178cztM0_level2.evt | modeM0/AS1G08_027T06_9000001594_11178cztM0_level2_quad_clean.evt |
| Size (bytes) | 406,569,600 | 67,052,160 |
| Size | 387.7 MB | 63.9 MB |
| Events in quadrant A | 3,596,431 | 429,893 |
| Events in quadrant B | 3,075,731 | 437,831 |
| Events in quadrant C | 2,154,127 | 438,550 |
| Events in quadrant D | 3,184,535 | 411,298 |
| Mode M9 | |||
|---|---|---|---|
| Quadrant | BADHDUFLAG | Total packets | Discarded packets |
| A | 1 | 273359709408 | 0 |
| B | 1 | -1 | -1 |
| C | 1 | -1 | -1 |
| D | 1 | -1 | -1 |
| Mode M0 | |||
|---|---|---|---|
| Quadrant | BADHDUFLAG | Total packets | Discarded packets |
| A | 0 | 15429 | 1537 |
| B | 0 | 13553 | 1499 |
| C | 0 | 10914 | 1159 |
| D | 0 | 13849 | 1386 |
| Mode SS | |||
|---|---|---|---|
| Quadrant | BADHDUFLAG | Total packets | Discarded packets |
| A | 0 | 101 | 11 |
| B | 0 | 99 | 7 |
| C | 0 | 102 | 10 |
| D | 0 | 103 | 15 |
| Quadrant | Total seconds | Saturated seconds | Saturation percentage |
|---|---|---|---|
| A | 4426 | 437 | 9.873475% |
| B | 4420 | 508 | 11.493213% |
| C | 4442 | 320 | 7.203962% |
| D | 4437 | 444 | 10.006761% |
Noise dominated data is calculated using 1-second bins in cleaned event files. If a bin has >2000 counts, and if more than 50% of those come from <1% of pixels, then it is considered to be noise-dominated and hence unusable.
| Quadrant | # 1 sec bins | Bins with >0 counts | Bins with >2000 counts | High rate bins dominated by noise | Noise dominated (total time) | Noise dominated (detector-on time) | Marked lightcurve |
|---|---|---|---|---|---|---|---|
| A | 4621 | 4492 | 35 | 35 | 0.76% | 0.78% | 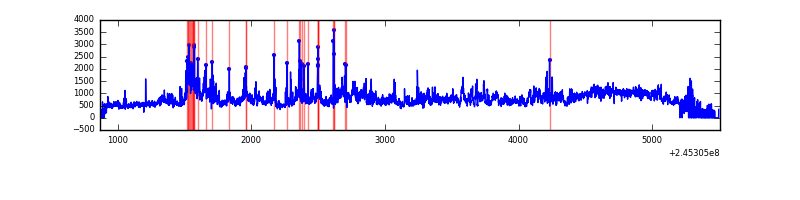 |
| B | 4608 | 4484 | 93 | 93 | 2.02% | 2.07% | 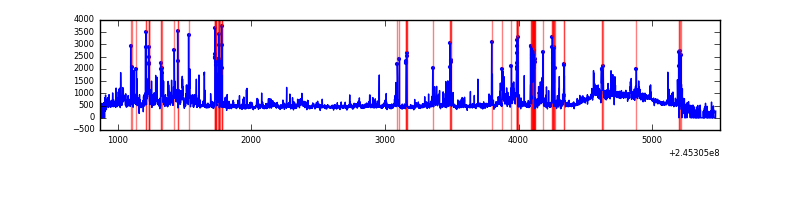 |
| C | 4637 | 4514 | 0 | 0 | 0.00% | 0.00% |  |
| D | 4612 | 4494 | 132 | 132 | 2.86% | 2.94% | 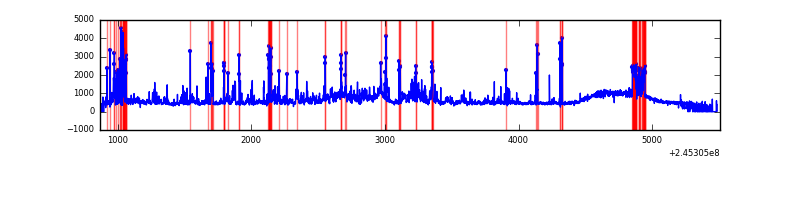 |
Top three noisy pixels from each quadrant. If the there are fewer than three noisy pixels in the level2.evt file, extra rows are filled as -1
| Pixel properties | Quadrant properties | ||||||
|---|---|---|---|---|---|---|---|
| Quadrant | DetID | PixID | Counts | Sigma | Mean | Median | Sigma |
| A | 8 | 15 | 934937 | 8021.63 | 555 | 540 | 116.5 |
| A | 8 | 5 | 285286 | 2444.49 | 555 | 540 | 116.5 |
| A | 14 | 238 | 215791 | 1847.89 | 555 | 540 | 116.5 |
| B | 4 | 239 | 531996 | 4838.65 | 551 | 536 | 109.8 |
| B | 15 | 204 | 125518 | 1137.89 | 551 | 536 | 109.8 |
| B | 11 | 51 | 72022 | 650.84 | 551 | 536 | 109.8 |
| C | 13 | 61 | 4140 | 27.28 | 551 | 552 | 131.5 |
| C | 14 | 234 | 2877 | 17.67 | 551 | 552 | 131.5 |
| C | 12 | 4 | 2292 | 13.23 | 551 | 552 | 131.5 |
| D | 1 | 52 | 341102 | 2586.07 | 535 | 520 | 131.7 |
| D | 10 | 199 | 185684 | 1405.97 | 535 | 520 | 131.7 |
| D | 10 | 157 | 136241 | 1030.54 | 535 | 520 | 131.7 |
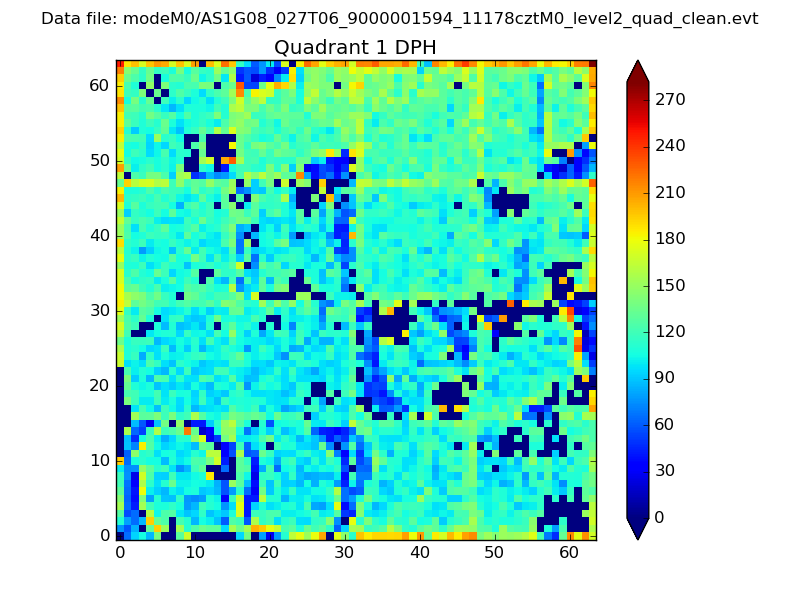
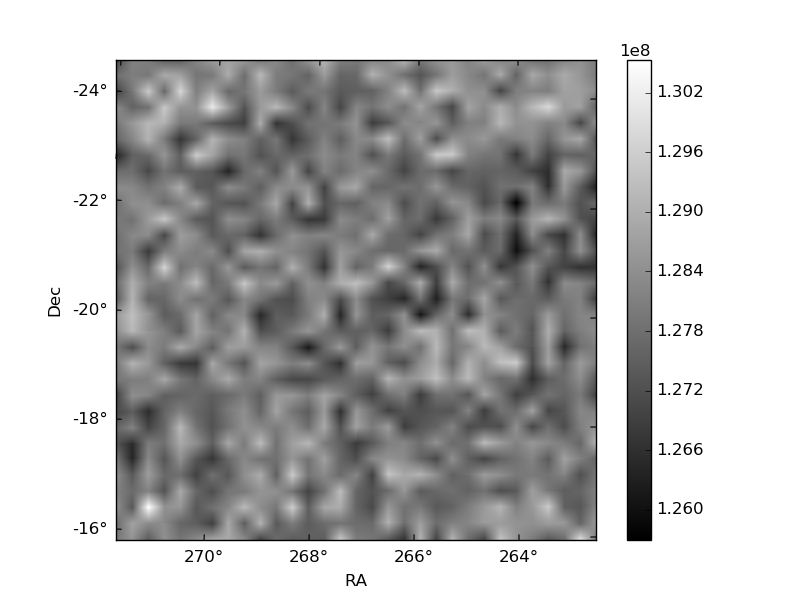
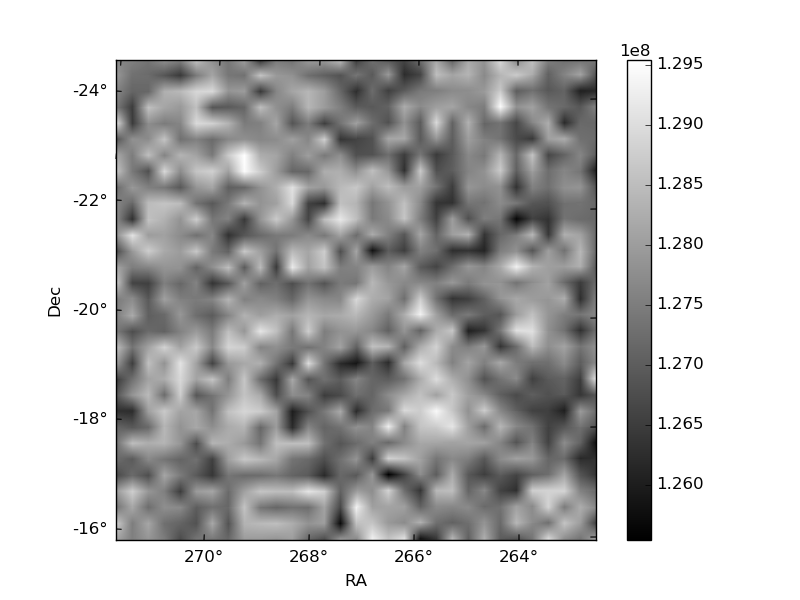
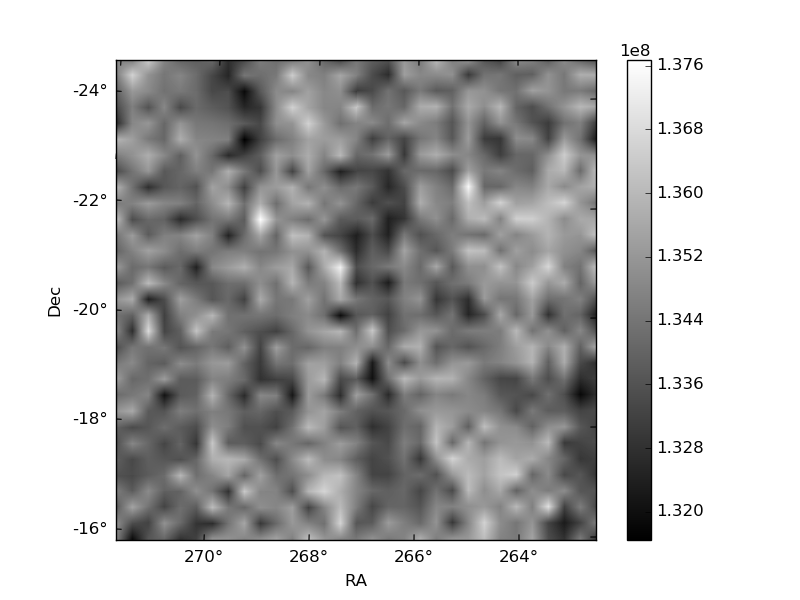
Histogram calculated using DETX and DETY for each event in the final _common_clean file
| Quadrant A | 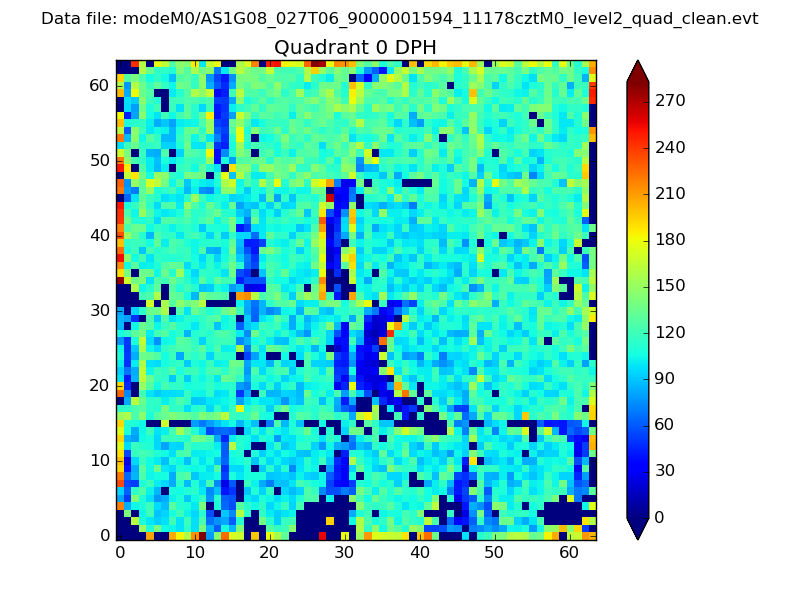 |
 |
Quadrant B |
|---|---|---|---|
| Quadrant D | 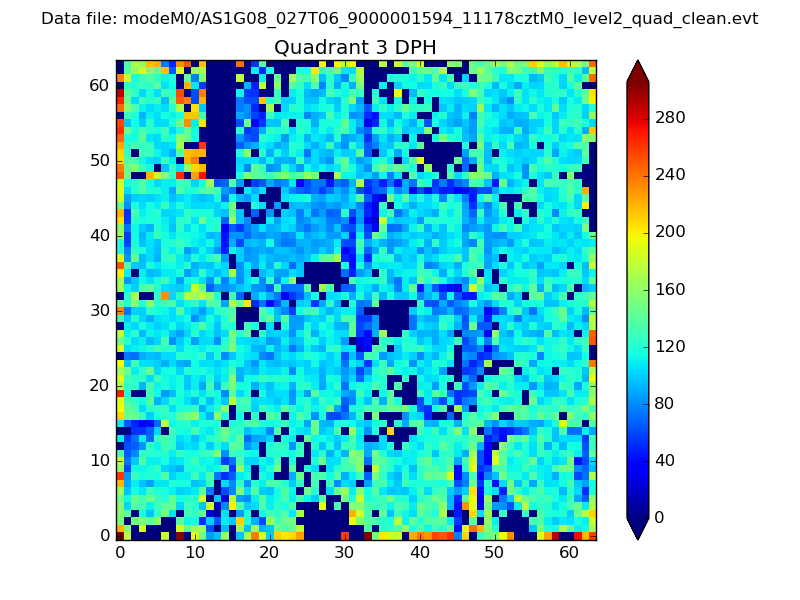 |
 |
Quadrant C |
| Plot type | Count rate plots | Images |
|---|---|---|
| Comparison with Poisson distribution Blue bars denote a histogram of data divided into 1 sec bins. Red curve is a Poisson curve with rate = median count rate of data. |
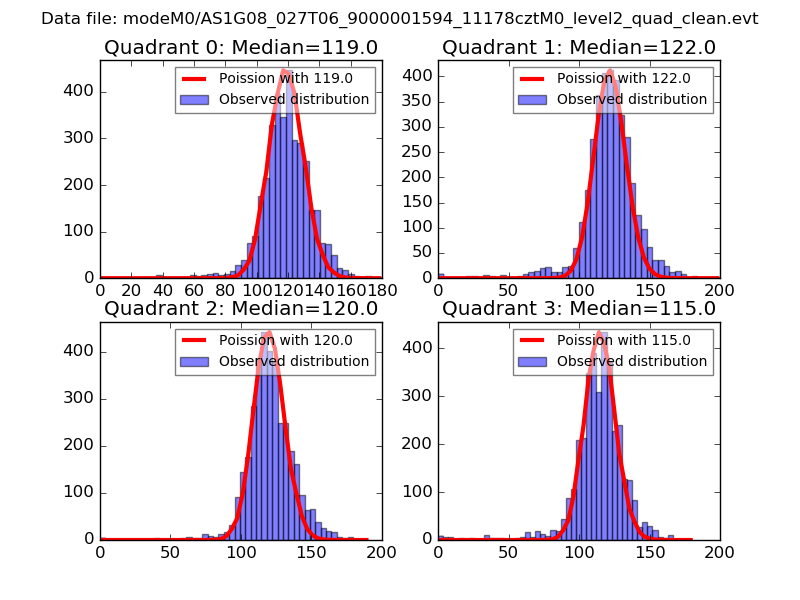 |
 |
| Quadrant-wise count rates Data is divided into 100 sec bins |
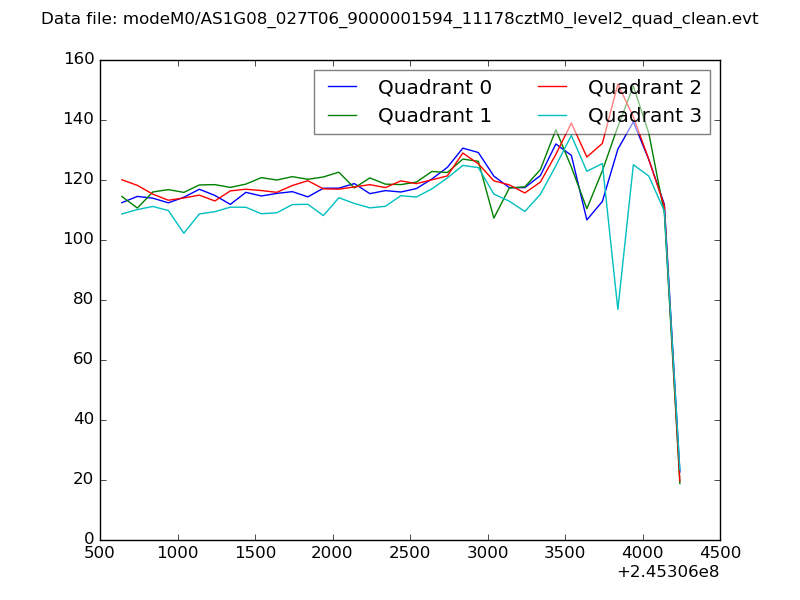 |
|
| Module-wise count rates for Quadrant A Data is divided into 100 sec bins |
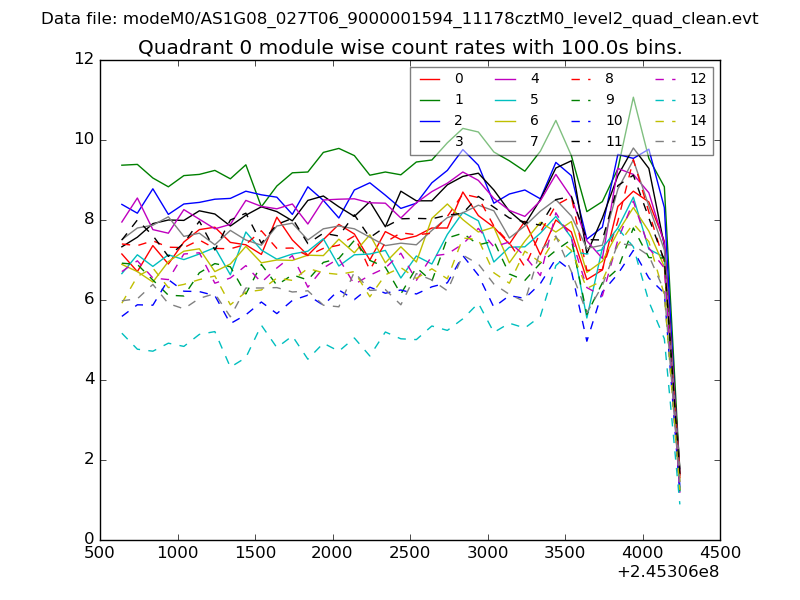 |
 |
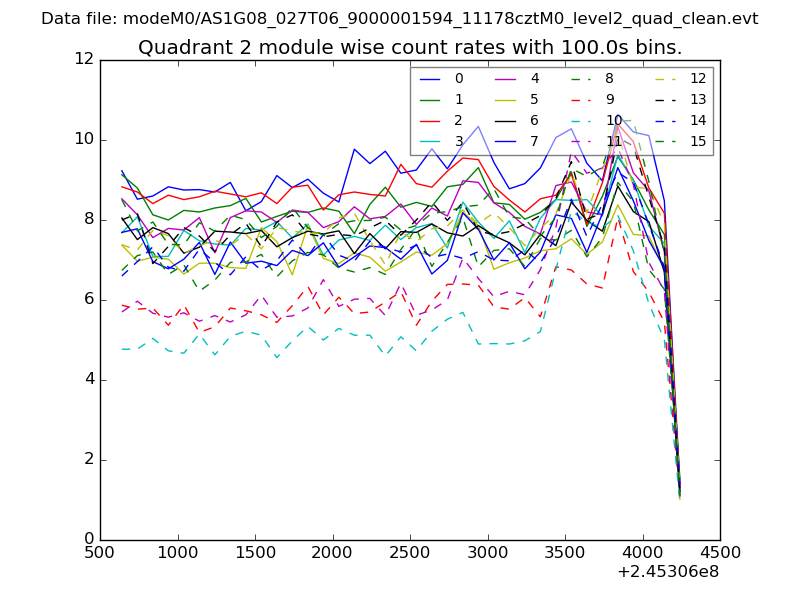
| Module-wise count rates for Quadrant B Data is divided into 100 sec bins |
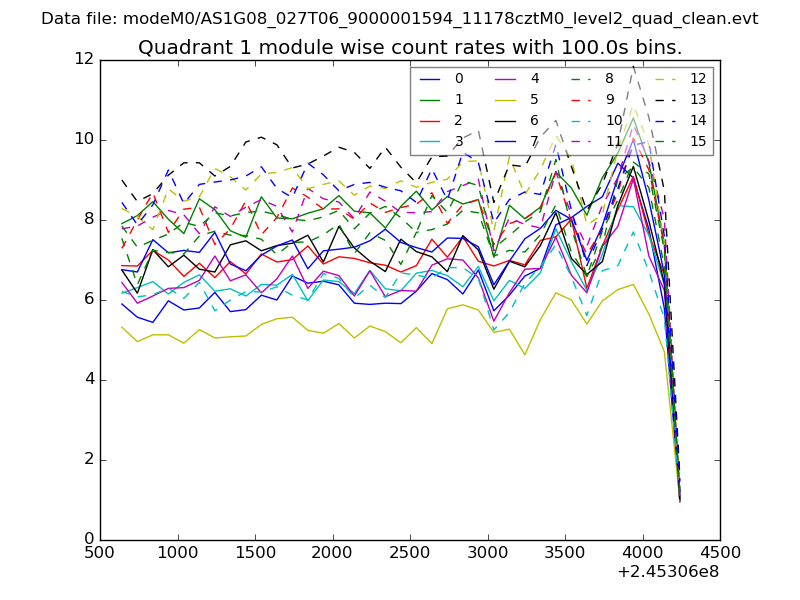 |
 |
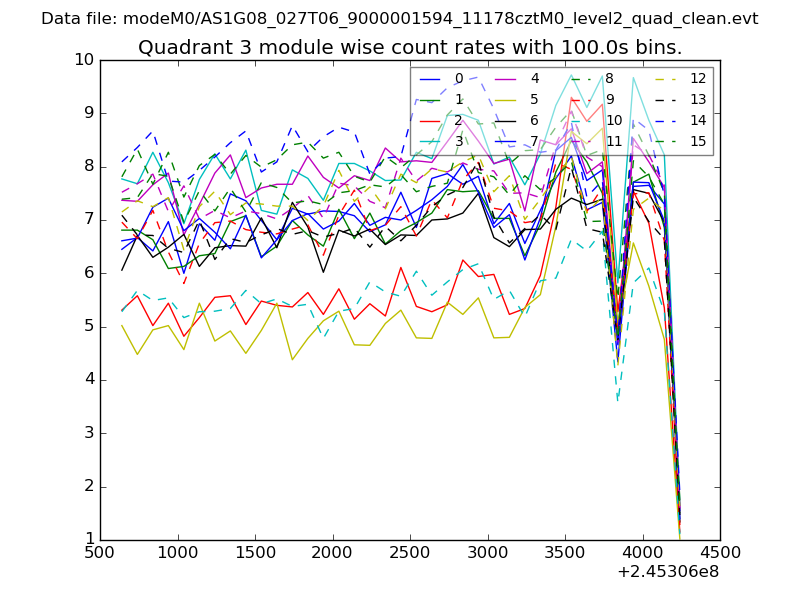
| Module-wise count rates for Quadrant C Data is divided into 100 sec bins |
 |
 |
| Module-wise count rates for Quadrant D Data is divided into 100 sec bins |
 |
 |
| Parameter | Plot |
|---|---|
| CZT HV Monitor | 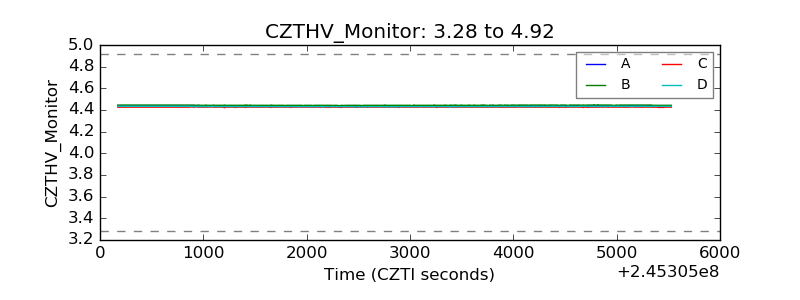 |
| D_VDD | 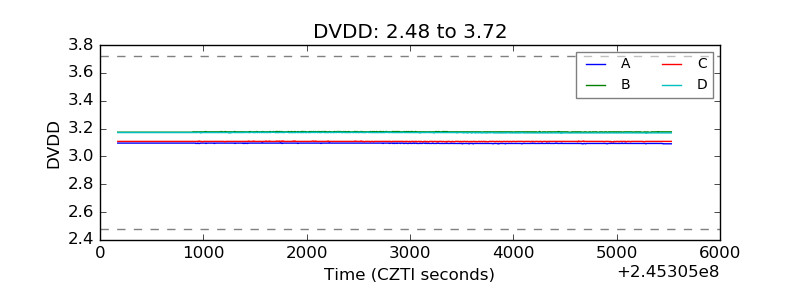 |
| Temperature 1 | 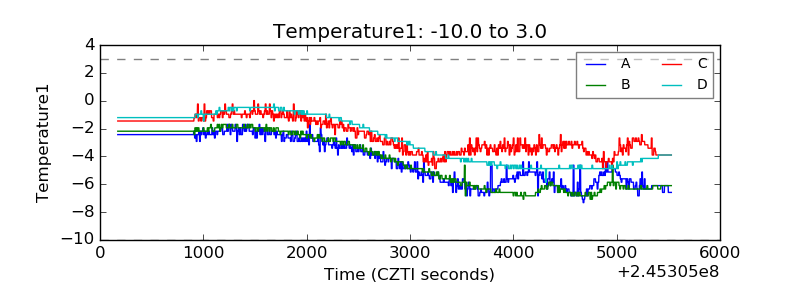 |
| Veto HV Monitor | 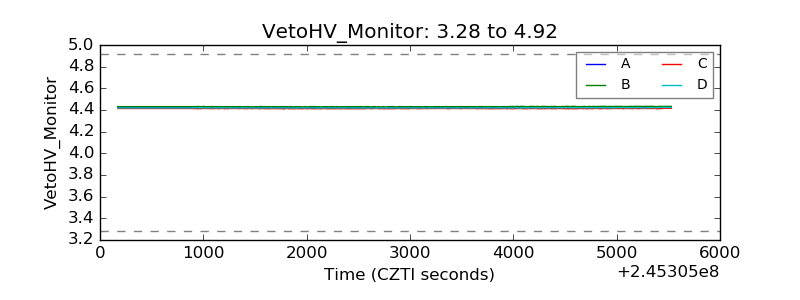 |
| Veto LLD | 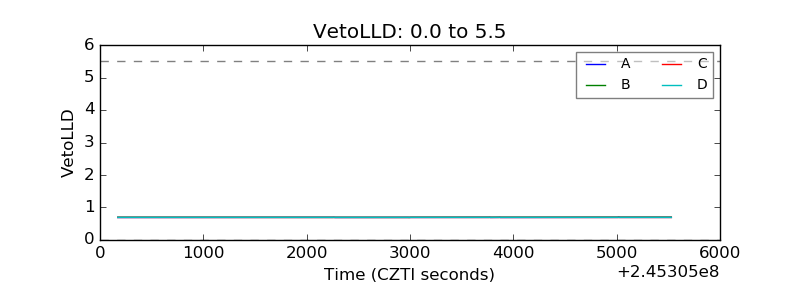 |
| Alpha Counter | 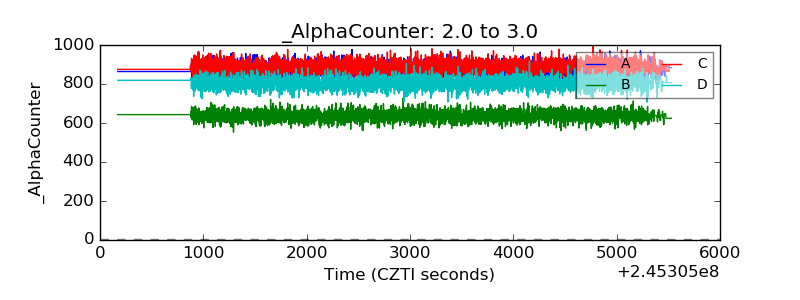 |
| _CPM_Rate | 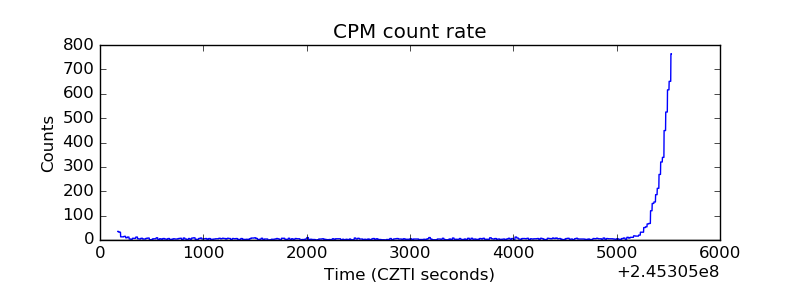 |
| CZT Counter |  |
| +2.5 Volts monitor |  |
| +5 Volts monitor |  |
| _ROLL_ROT | 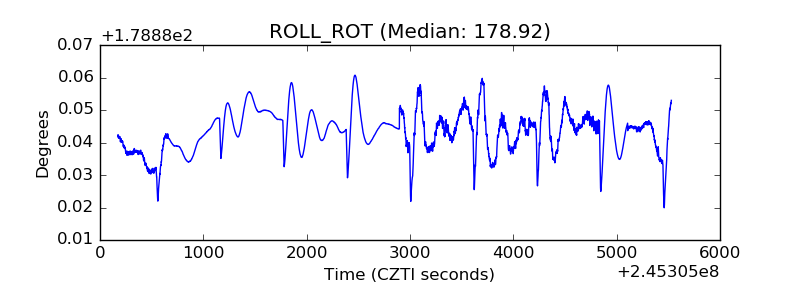 |
| _Roll_DEC |  |
| _Roll_RA | 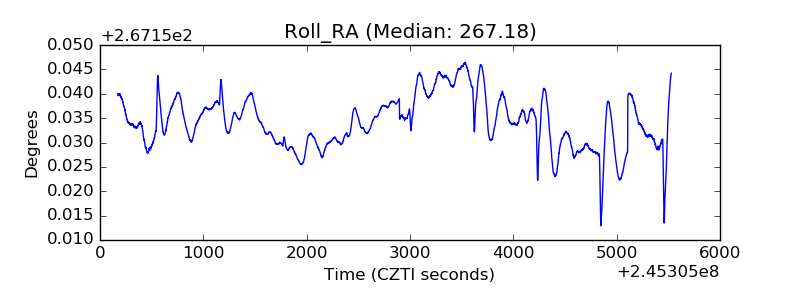 |
| Veto Counter | 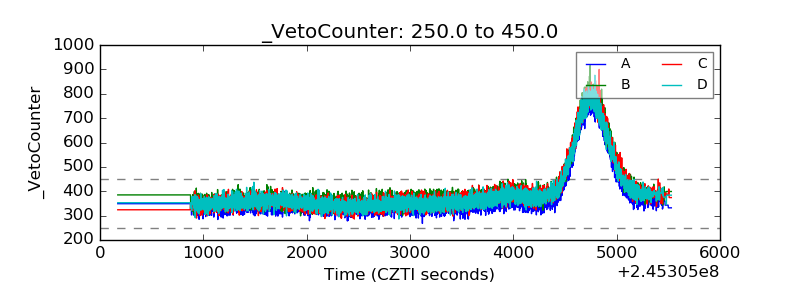 |