| Param | Original file | Final file |
|---|---|---|
| Filename | modeM0/AS1G08_030T01_9000001592cztM0_level2.fits | modeM0/AS1G08_030T01_9000001592cztM0_level2_quad_clean.evt |
| Size (bytes) | 184,285,440 | 148,602,240 |
| Size | 175.7 MB | 141.7 MB |
| Events in quadrant A | 1,099,414 | 762,877 |
| Events in quadrant B | 1,101,142 | 863,753 |
| Events in quadrant C | 1,122,088 | 834,858 |
| Events in quadrant D | 972,122 | 752,333 |
| Mode SS | |||
|---|---|---|---|
| Quadrant | BADHDUFLAG | Total packets | Discarded packets |
| A | 0 | 382 | 0 |
| B | 0 | 382 | 0 |
| C | 0 | 382 | 0 |
| D | 0 | 382 | 0 |
| Mode M9 | |||
|---|---|---|---|
| Quadrant | BADHDUFLAG | Total packets | Discarded packets |
| A | 0 | 46 | 0 |
| B | 0 | 46 | 0 |
| C | 0 | 46 | 0 |
| D | 0 | 46 | 0 |
| Mode M0 | |||
|---|---|---|---|
| Quadrant | BADHDUFLAG | Total packets | Discarded packets |
| A | 0 | 58777 | 0 |
| B | 0 | 46823 | 0 |
| C | 0 | 38338 | 0 |
| D | 0 | 44914 | 0 |
| Quadrant | Total seconds | Saturated seconds | Saturation percentage |
|---|---|---|---|
| A | 18652 | 2049 | 10.985417% |
| B | 18652 | 755 | 4.047823% |
| C | 18652 | 85 | 0.455715% |
| D | 18652 | 286 | 1.533348% |
Noise dominated data is calculated using 1-second bins in cleaned event files. If a bin has >2000 counts, and if more than 50% of those come from <1% of pixels, then it is considered to be noise-dominated and hence unusable.
| Quadrant | # 1 sec bins | Bins with >0 counts | Bins with >2000 counts | High rate bins dominated by noise | Noise dominated (total time) | Noise dominated (detector-on time) | Marked lightcurve |
|---|---|---|---|---|---|---|---|
| A | 23337 | 18643 | 0 | 0 | 0.00% | 0.00% |  |
| B | 23337 | 18648 | 0 | 0 | 0.00% | 0.00% |  |
| C | 23337 | 18652 | 0 | 0 | 0.00% | 0.00% |  |
| D | 23337 | 18652 | 0 | 0 | 0.00% | 0.00% |  |
Top three noisy pixels from each quadrant. If the there are fewer than three noisy pixels in the level2.evt file, extra rows are filled as -1
| Pixel properties | Quadrant properties | ||||||
|---|---|---|---|---|---|---|---|
| Quadrant | DetID | PixID | Counts | Sigma | Mean | Median | Sigma |
| A | 0 | 29 | 1082 | 11.36 | 286 | 269 | 71.5 |
| A | 0 | 30 | 857 | 8.22 | 286 | 269 | 71.5 |
| A | 7 | 110 | 817 | 7.66 | 286 | 269 | 71.5 |
| B | 2 | 9 | 911 | 10.57 | 290 | 277 | 60.0 |
| B | 5 | 128 | 765 | 8.14 | 290 | 277 | 60.0 |
| B | 3 | 17 | 734 | 7.62 | 290 | 277 | 60.0 |
| C | 1 | 81 | 832 | 7.07 | 296 | 275 | 78.8 |
| C | 1 | 80 | 806 | 6.74 | 296 | 275 | 78.8 |
| C | 7 | 111 | 770 | 6.28 | 296 | 275 | 78.8 |
| D | 3 | 14 | 687 | 5.73 | 277 | 253 | 75.8 |
| D | 7 | 3 | 685 | 5.7 | 277 | 253 | 75.8 |
| D | 6 | 231 | 685 | 5.7 | 277 | 253 | 75.8 |
Histogram calculated using DETX and DETY for each event in the final _common_clean file
| Quadrant A |  |
 |
Quadrant B |
|---|---|---|---|
| Quadrant D |  |
 |
Quadrant C |
| Plot type | Count rate plots | Images |
|---|---|---|
| Comparison with Poisson distribution Blue bars denote a histogram of data divided into 1 sec bins. Red curve is a Poisson curve with rate = median count rate of data. |
 |
 |
| Quadrant-wise count rates Data is divided into 100 sec bins |
 |
|
| Module-wise count rates for Quadrant A Data is divided into 100 sec bins |
 |
 |
| Module-wise count rates for Quadrant B Data is divided into 100 sec bins |
 |
 |
| Module-wise count rates for Quadrant C Data is divided into 100 sec bins |
 |
 |
| Module-wise count rates for Quadrant D Data is divided into 100 sec bins |
 |
 |
| Parameter | Plot |
|---|---|
| CZT HV Monitor |  |
| D_VDD |  |
| Temperature 1 |  |
| Veto HV Monitor |  |
| Veto LLD |  |
| Alpha Counter |  |
| _CPM_Rate |  |
| CZT Counter |  |
| +2.5 Volts monitor |  |
| +5 Volts monitor |  |
| _ROLL_ROT |  |
| _Roll_DEC | 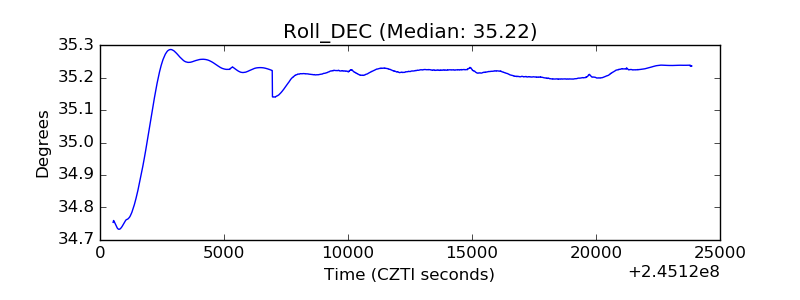 |
| _Roll_RA |  |
| Veto Counter |  |