| Param | Original file | Final file |
|---|---|---|
| Filename | modeM0/AS1G08_030T01_9000001592_10966cztM0_level2.evt | modeM0/AS1G08_030T01_9000001592_10966cztM0_level2_quad_clean.evt |
| Size (bytes) | 279,521,280 | 43,323,840 |
| Size | 266.6 MB | 41.3 MB |
| Events in quadrant A | 2,633,329 | 263,003 |
| Events in quadrant B | 2,061,627 | 276,654 |
| Events in quadrant C | 1,529,178 | 277,974 |
| Events in quadrant D | 2,018,559 | 262,460 |
| Mode SS | |||
|---|---|---|---|
| Quadrant | BADHDUFLAG | Total packets | Discarded packets |
| A | 0 | 66 | 0 |
| B | 0 | 66 | 0 |
| C | 0 | 66 | 0 |
| D | 0 | 66 | 0 |
| Mode M9 | |||
|---|---|---|---|
| Quadrant | BADHDUFLAG | Total packets | Discarded packets |
| A | 0 | 10 | 0 |
| B | 0 | 10 | 0 |
| C | 0 | 10 | 0 |
| D | 0 | 10 | 0 |
| Mode M0 | |||
|---|---|---|---|
| Quadrant | BADHDUFLAG | Total packets | Discarded packets |
| A | 0 | 9872 | 2 |
| B | 0 | 8107 | 1 |
| C | 0 | 6652 | 1 |
| D | 0 | 8136 | 1 |
| Quadrant | Total seconds | Saturated seconds | Saturation percentage |
|---|---|---|---|
| A | 3260 | 364 | 11.165644% |
| B | 3260 | 140 | 4.294479% |
| C | 3260 | 20 | 0.613497% |
| D | 3260 | 65 | 1.993865% |
Noise dominated data is calculated using 1-second bins in cleaned event files. If a bin has >2000 counts, and if more than 50% of those come from <1% of pixels, then it is considered to be noise-dominated and hence unusable.
| Quadrant | # 1 sec bins | Bins with >0 counts | Bins with >2000 counts | High rate bins dominated by noise | Noise dominated (total time) | Noise dominated (detector-on time) | Marked lightcurve |
|---|---|---|---|---|---|---|---|
| A | 4260 | 3261 | 265 | 265 | 6.22% | 8.13% | 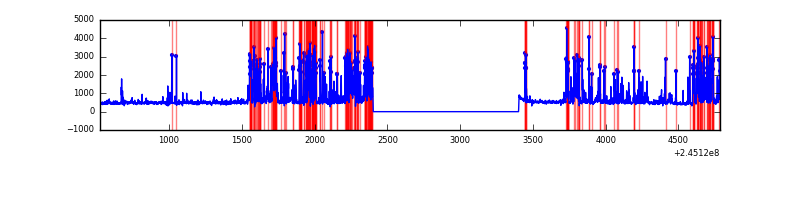 |
| B | 4260 | 3260 | 71 | 71 | 1.67% | 2.18% | 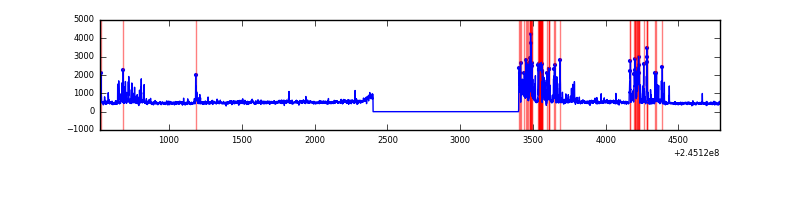 |
| C | 4260 | 3261 | 0 | 0 | 0.00% | 0.00% | 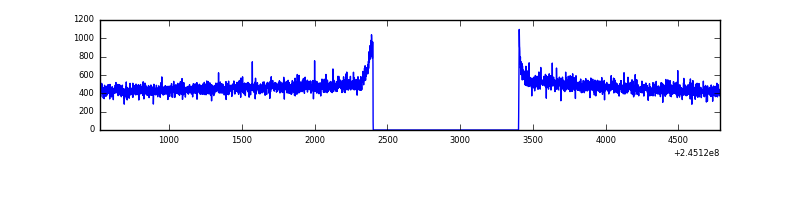 |
| D | 4260 | 3261 | 39 | 39 | 0.92% | 1.20% | 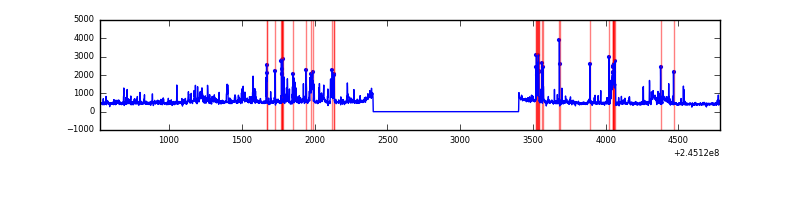 |
Top three noisy pixels from each quadrant. If the there are fewer than three noisy pixels in the level2.evt file, extra rows are filled as -1
| Pixel properties | Quadrant properties | ||||||
|---|---|---|---|---|---|---|---|
| Quadrant | DetID | PixID | Counts | Sigma | Mean | Median | Sigma |
| A | 8 | 5 | 1140235 | 14263.9 | 383 | 374 | 79.9 |
| A | 11 | 29 | 6817 | 80.63 | 383 | 374 | 79.9 |
| A | 13 | 251 | 4890 | 56.51 | 383 | 374 | 79.9 |
| B | 4 | 239 | 434527 | 5572.56 | 398 | 388 | 77.9 |
| B | 11 | 51 | 14640 | 182.94 | 398 | 388 | 77.9 |
| B | 0 | 229 | 13282 | 165.51 | 398 | 388 | 77.9 |
| C | 13 | 61 | 2896 | 27.15 | 391 | 393 | 92.2 |
| C | 14 | 234 | 1521 | 12.24 | 391 | 393 | 92.2 |
| C | 5 | 207 | 1452 | 11.49 | 391 | 393 | 92.2 |
| D | 1 | 52 | 342455 | 3568.47 | 389 | 379 | 95.9 |
| D | 13 | 104 | 63880 | 662.43 | 389 | 379 | 95.9 |
| D | 5 | 222 | 33999 | 350.72 | 389 | 379 | 95.9 |
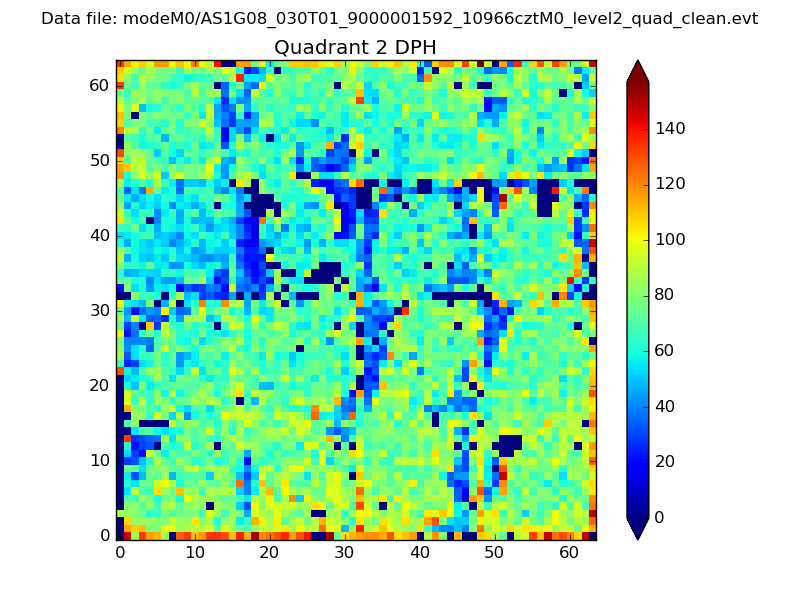
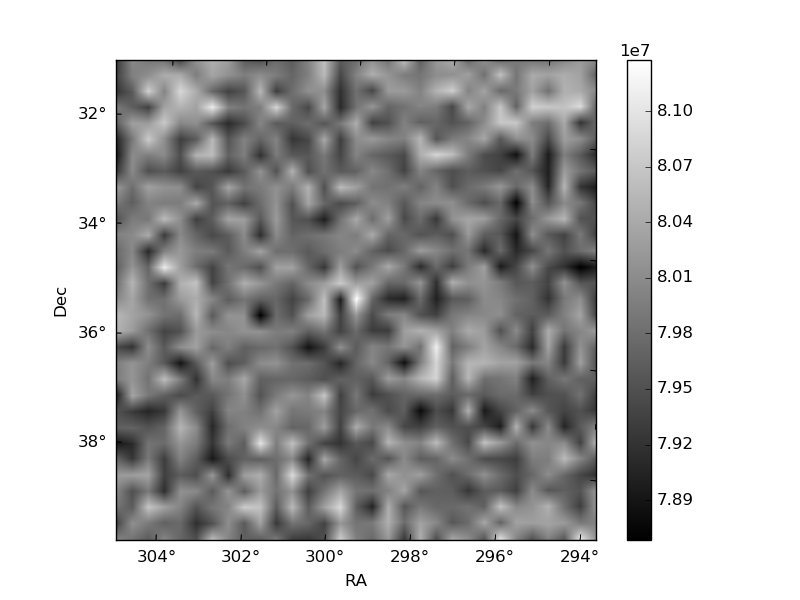
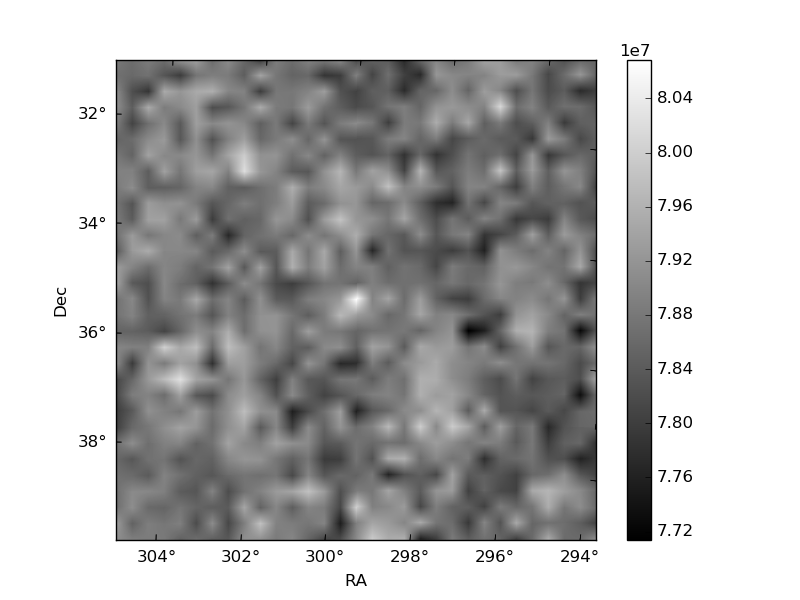
Histogram calculated using DETX and DETY for each event in the final _common_clean file
| Quadrant A | 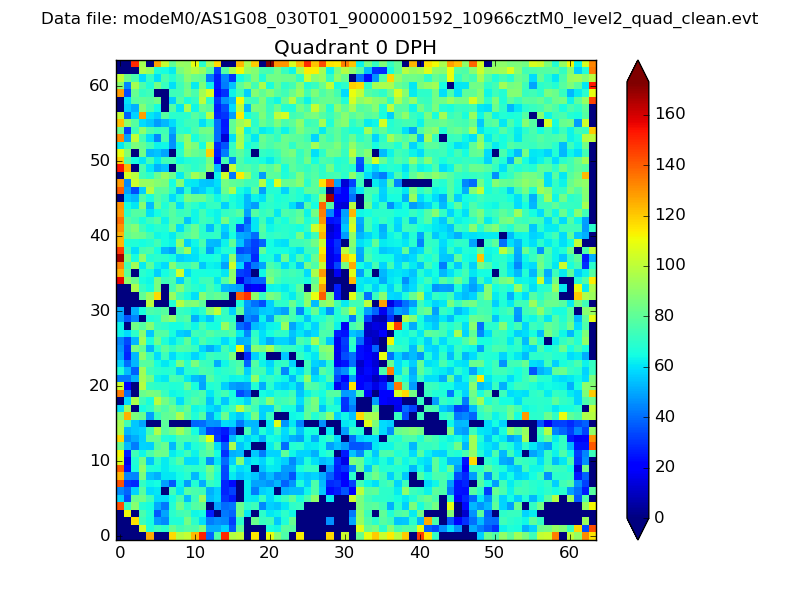 |
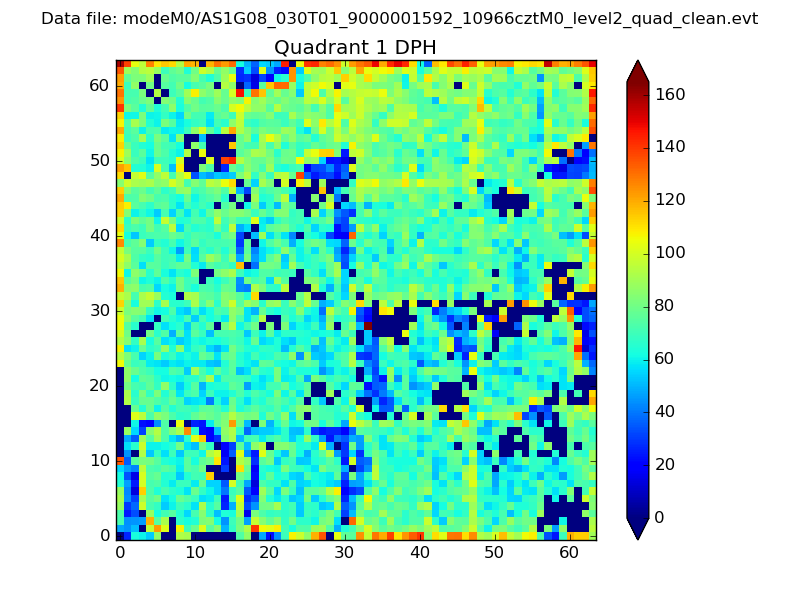 |
Quadrant B |
|---|---|---|---|
| Quadrant D | 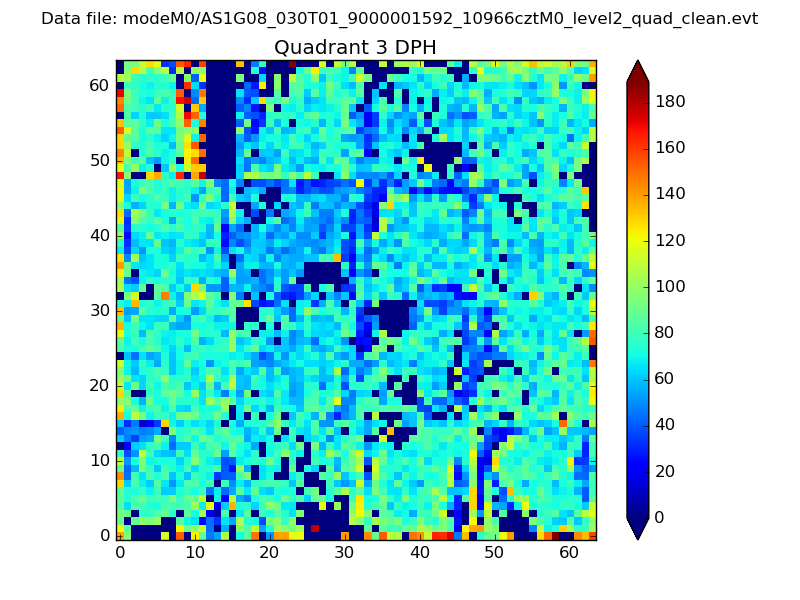 |
 |
Quadrant C |
| Plot type | Count rate plots | Images |
|---|---|---|
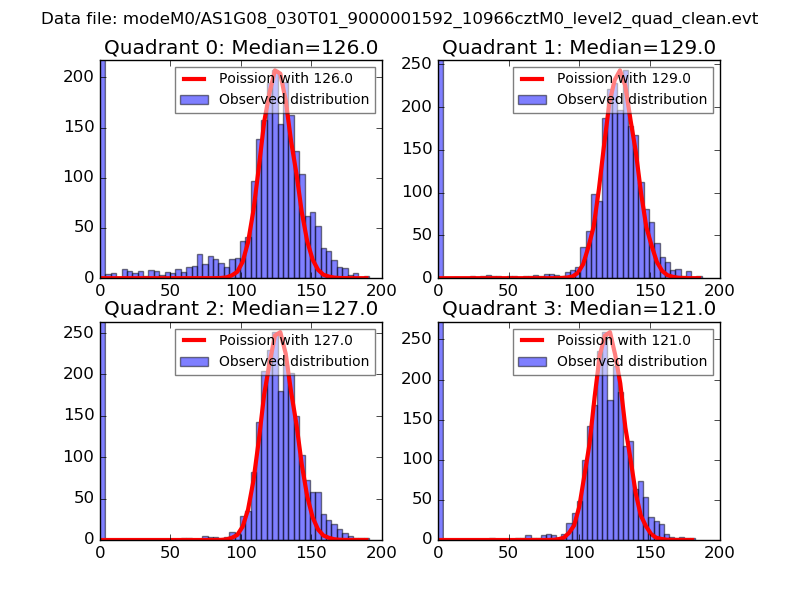
| Comparison with Poisson distribution Blue bars denote a histogram of data divided into 1 sec bins. Red curve is a Poisson curve with rate = median count rate of data. |
 |
 |
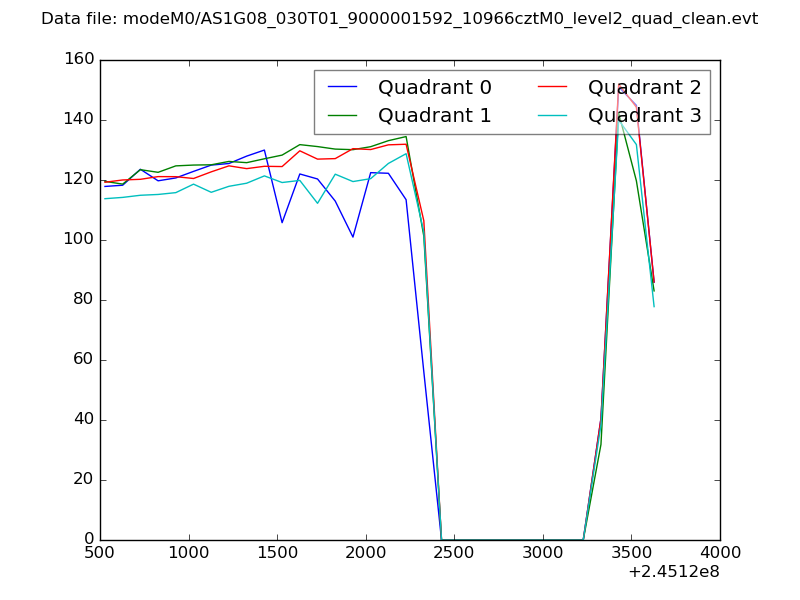
| Quadrant-wise count rates Data is divided into 100 sec bins |
 |
|
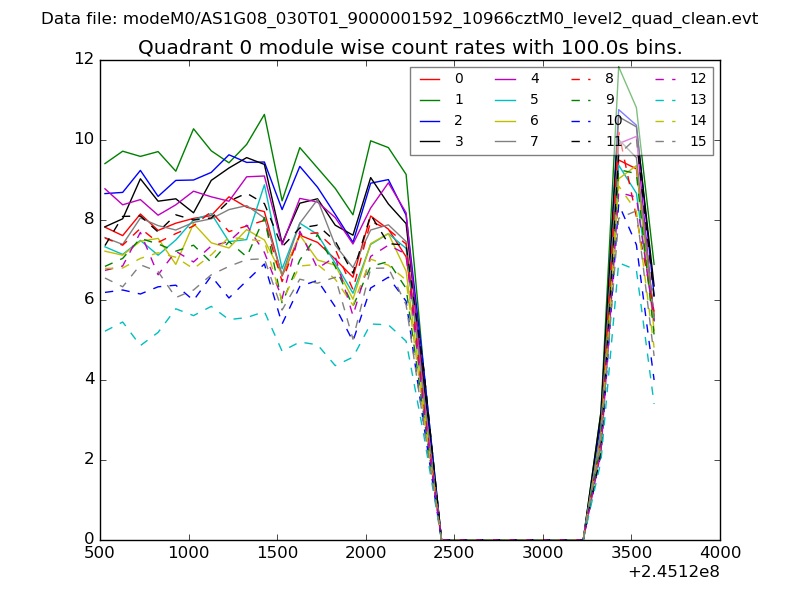
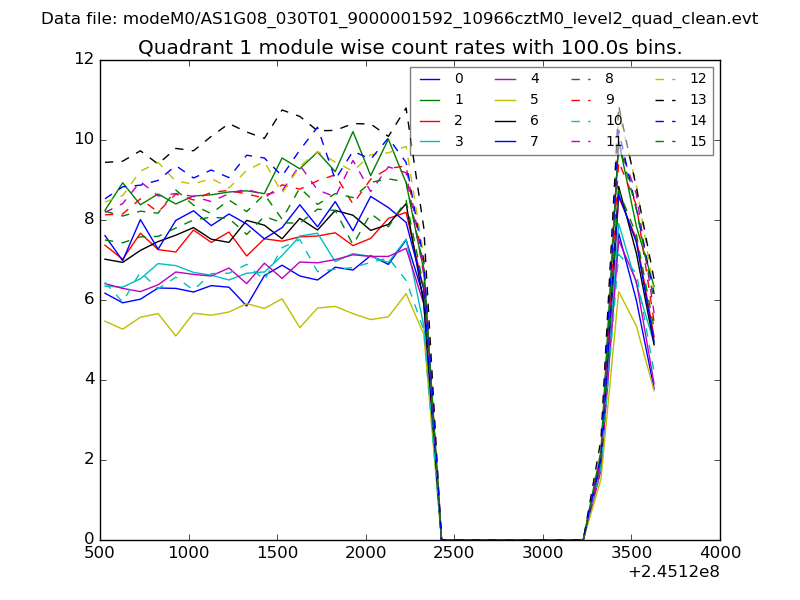
| Module-wise count rates for Quadrant A Data is divided into 100 sec bins |
 |
 |
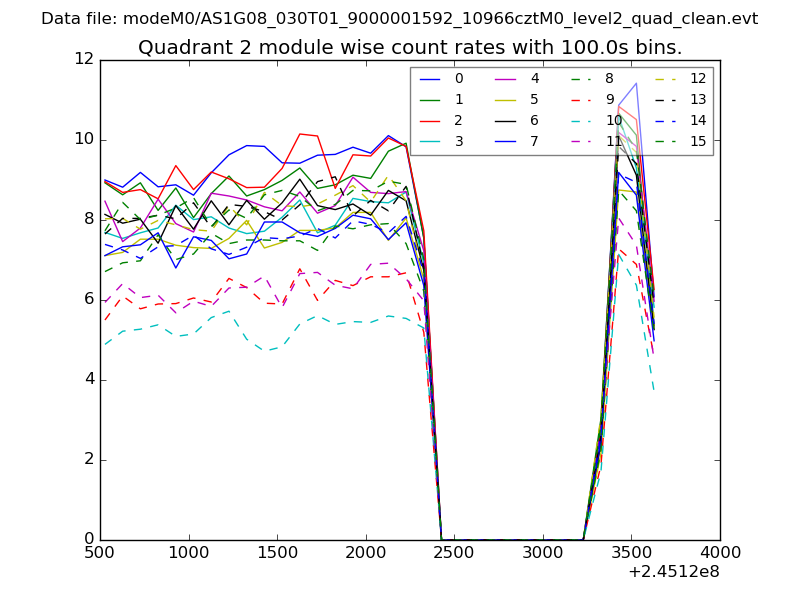
| Module-wise count rates for Quadrant B Data is divided into 100 sec bins |
 |
 |
| Module-wise count rates for Quadrant C Data is divided into 100 sec bins |
 |
 |
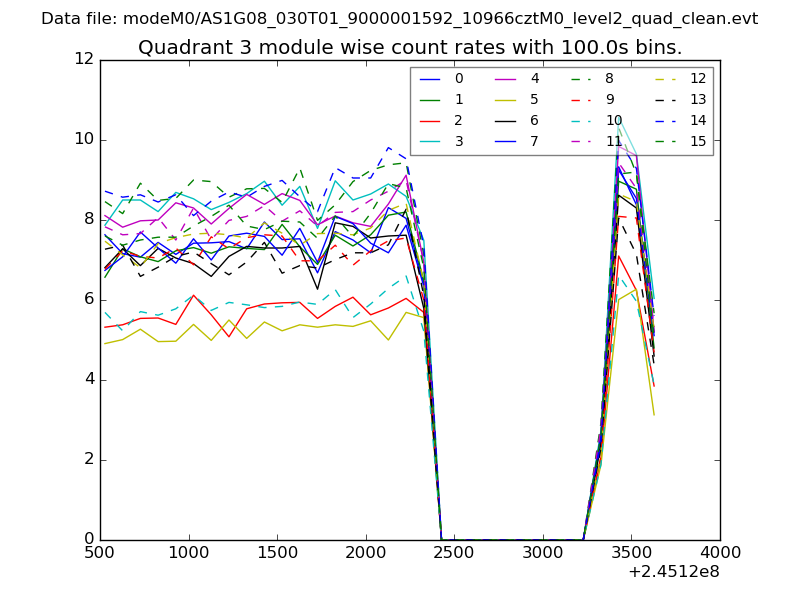
| Module-wise count rates for Quadrant D Data is divided into 100 sec bins |
 |
 |
| Parameter | Plot |
|---|---|
| CZT HV Monitor | 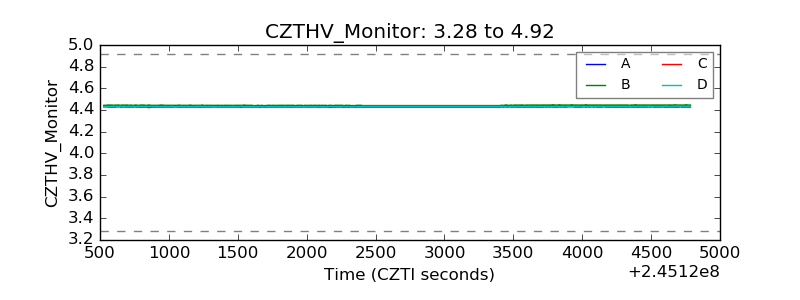 |
| D_VDD | 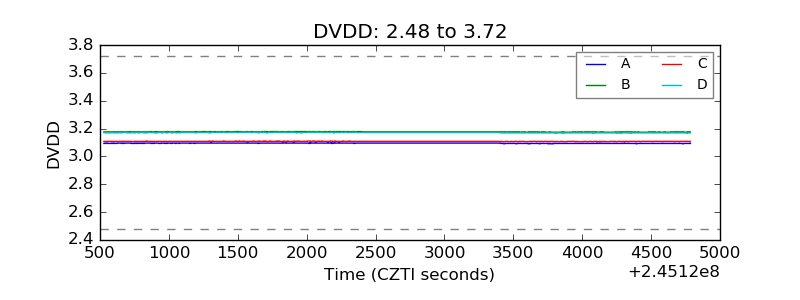 |
| Temperature 1 | 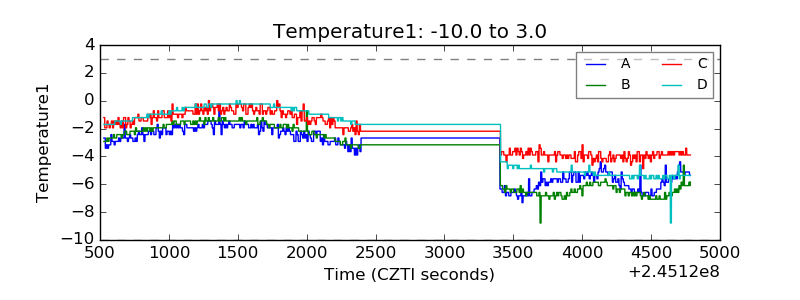 |
| Veto HV Monitor | 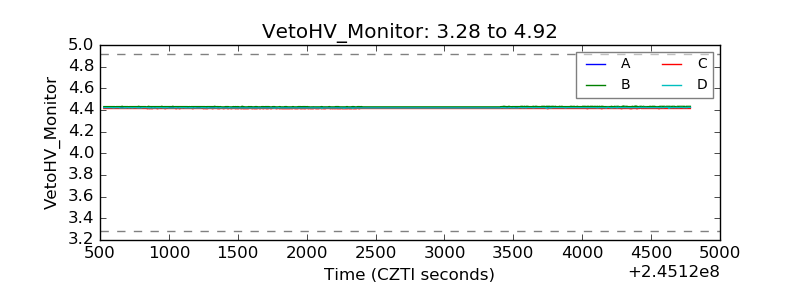 |
| Veto LLD | 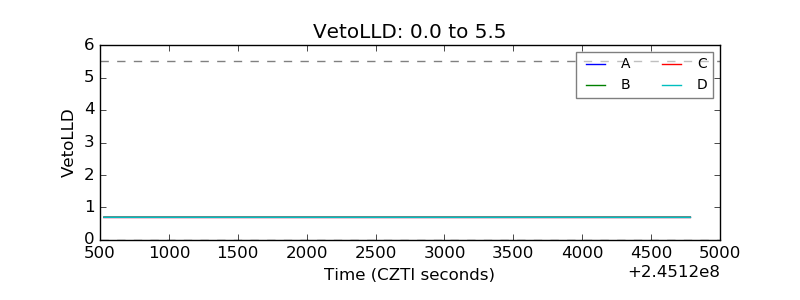 |
| Alpha Counter | 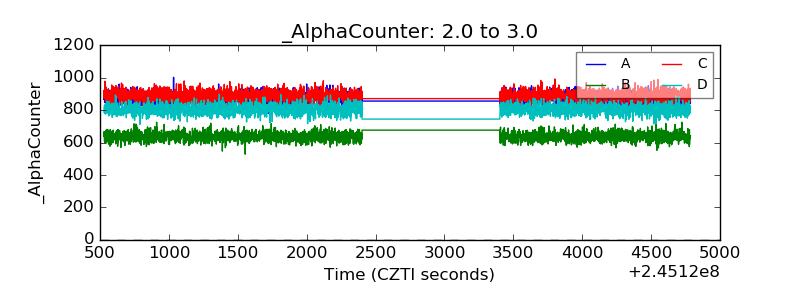 |
| _CPM_Rate | 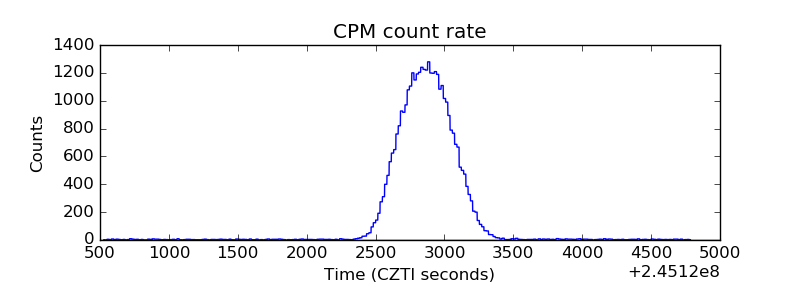 |
| CZT Counter | 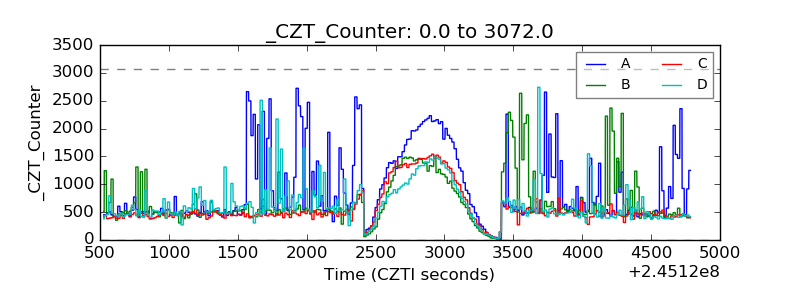 |
| +2.5 Volts monitor |  |
| +5 Volts monitor |  |
| _ROLL_ROT | 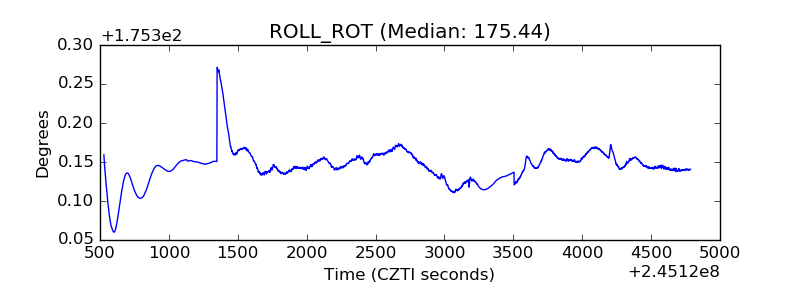 |
| _Roll_DEC | 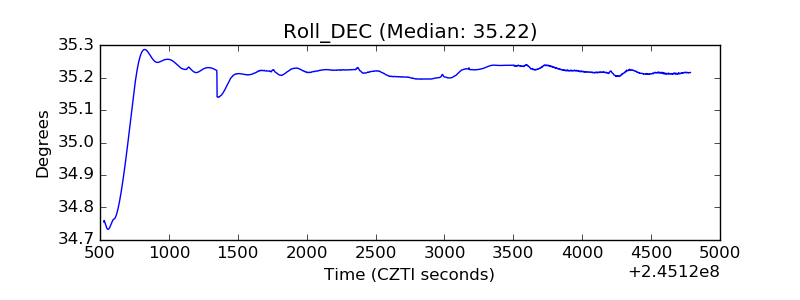 |
| _Roll_RA | 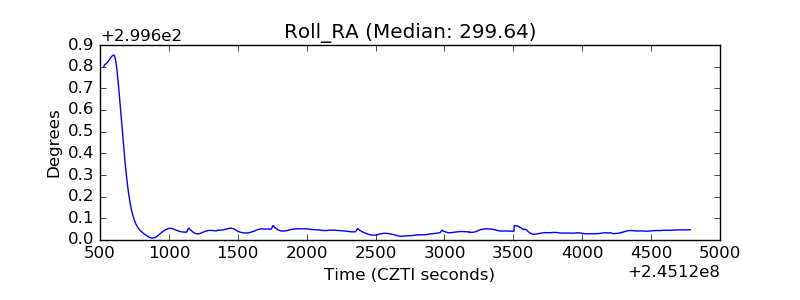 |
| Veto Counter | 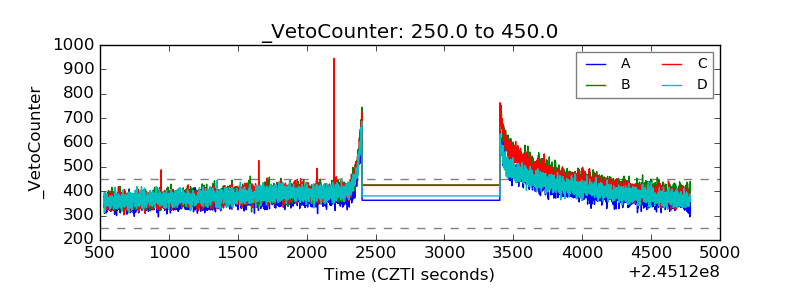 |