| Param | Original file | Final file |
|---|---|---|
| Filename | modeM0/AS1G08_030T01_9000001592_10968cztM0_level2.evt | modeM0/AS1G08_030T01_9000001592_10968cztM0_level2_quad_clean.evt |
| Size (bytes) | 551,851,200 | 56,782,080 |
| Size | 526.3 MB | 54.2 MB |
| Events in quadrant A | 6,585,928 | 270,617 |
| Events in quadrant B | 3,510,127 | 349,767 |
| Events in quadrant C | 2,764,016 | 345,677 |
| Events in quadrant D | 3,441,059 | 328,602 |
| Mode SS | |||
|---|---|---|---|
| Quadrant | BADHDUFLAG | Total packets | Discarded packets |
| A | 0 | 124 | 0 |
| B | 0 | 124 | 0 |
| C | 0 | 124 | 0 |
| D | 0 | 124 | 0 |
| Mode M9 | |||
|---|---|---|---|
| Quadrant | BADHDUFLAG | Total packets | Discarded packets |
| A | 0 | 11 | 0 |
| B | 0 | 11 | 0 |
| C | 0 | 11 | 0 |
| D | 0 | 11 | 0 |
| Mode M0 | |||
|---|---|---|---|
| Quadrant | BADHDUFLAG | Total packets | Discarded packets |
| A | 0 | 23654 | 2 |
| B | 0 | 14347 | 1 |
| C | 0 | 12332 | 1 |
| D | 0 | 14247 | 1 |
| Quadrant | Total seconds | Saturated seconds | Saturation percentage |
|---|---|---|---|
| A | 6068 | 1365 | 22.495056% |
| B | 6068 | 176 | 2.900461% |
| C | 6068 | 17 | 0.280158% |
| D | 6068 | 92 | 1.516150% |
Noise dominated data is calculated using 1-second bins in cleaned event files. If a bin has >2000 counts, and if more than 50% of those come from <1% of pixels, then it is considered to be noise-dominated and hence unusable.
| Quadrant | # 1 sec bins | Bins with >0 counts | Bins with >2000 counts | High rate bins dominated by noise | Noise dominated (total time) | Noise dominated (detector-on time) | Marked lightcurve |
|---|---|---|---|---|---|---|---|
| A | 7218 | 6069 | 1147 | 1147 | 15.89% | 18.90% | 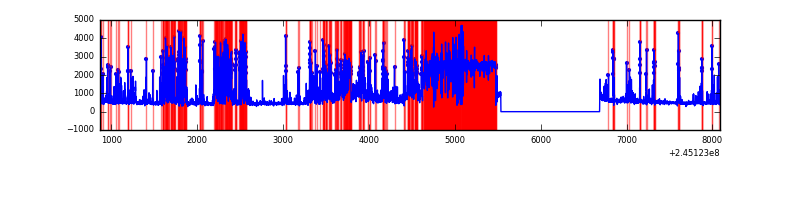 |
| B | 7218 | 6068 | 83 | 83 | 1.15% | 1.37% | 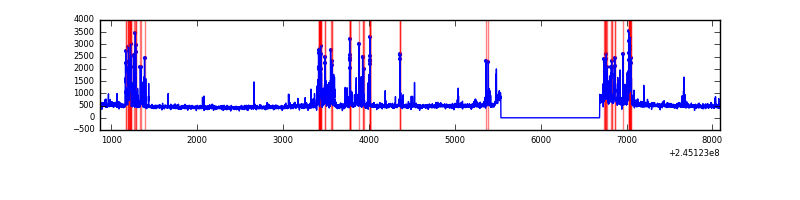 |
| C | 7218 | 6069 | 2 | 2 | 0.03% | 0.03% | 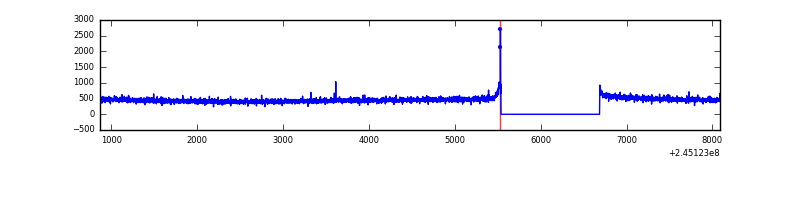 |
| D | 7218 | 6069 | 65 | 65 | 0.90% | 1.07% | 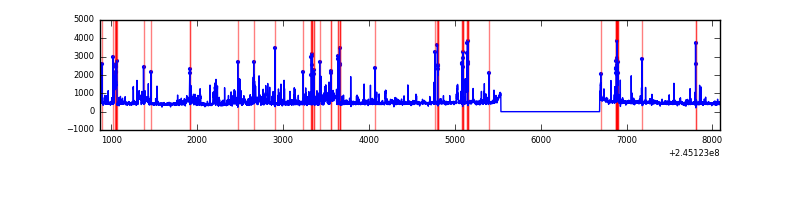 |
Top three noisy pixels from each quadrant. If the there are fewer than three noisy pixels in the level2.evt file, extra rows are filled as -1
| Pixel properties | Quadrant properties | ||||||
|---|---|---|---|---|---|---|---|
| Quadrant | DetID | PixID | Counts | Sigma | Mean | Median | Sigma |
| A | 13 | 210 | 2476990 | 18745.89 | 653 | 641 | 132.1 |
| A | 8 | 5 | 1578841 | 11946.93 | 653 | 641 | 132.1 |
| A | 11 | 29 | 8193 | 57.17 | 653 | 641 | 132.1 |
| B | 4 | 239 | 557630 | 4013.07 | 729 | 711 | 138.8 |
| B | 0 | 214 | 35846 | 253.17 | 729 | 711 | 138.8 |
| B | 0 | 187 | 26878 | 188.55 | 729 | 711 | 138.8 |
| C | 14 | 234 | 7245 | 39.63 | 707 | 712 | 164.9 |
| C | 13 | 61 | 5198 | 27.21 | 707 | 712 | 164.9 |
| C | 8 | 222 | 2391 | 10.18 | 707 | 712 | 164.9 |
| D | 1 | 52 | 450910 | 2668.3 | 697 | 678 | 168.7 |
| D | 5 | 222 | 122148 | 719.89 | 697 | 678 | 168.7 |
| D | 10 | 172 | 58109 | 340.36 | 697 | 678 | 168.7 |
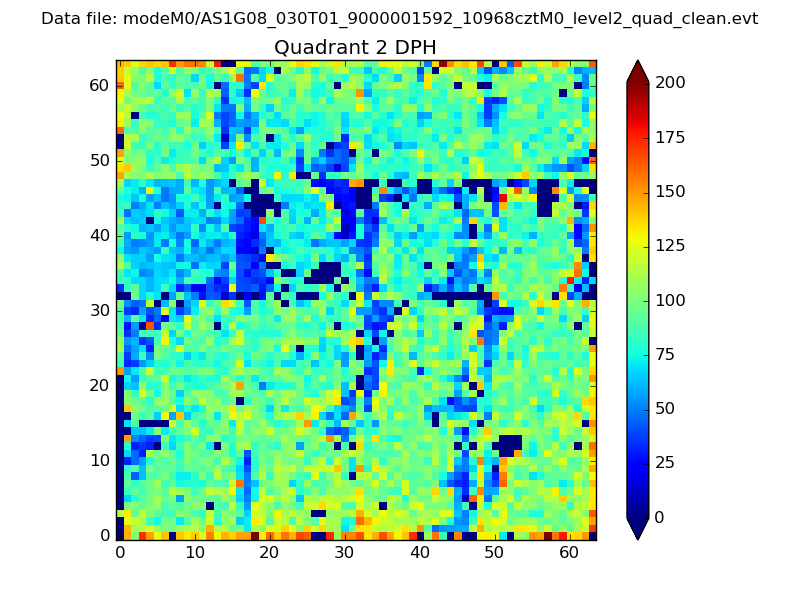
Histogram calculated using DETX and DETY for each event in the final _common_clean file
| Quadrant A |  |
 |
Quadrant B |
|---|---|---|---|
| Quadrant D | 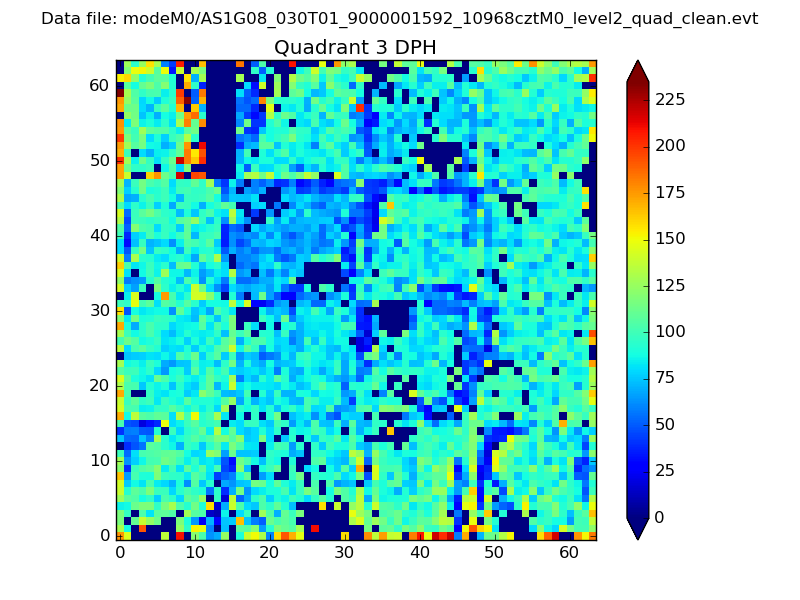 |
 |
Quadrant C |
| Plot type | Count rate plots | Images |
|---|---|---|
| Comparison with Poisson distribution Blue bars denote a histogram of data divided into 1 sec bins. Red curve is a Poisson curve with rate = median count rate of data. |
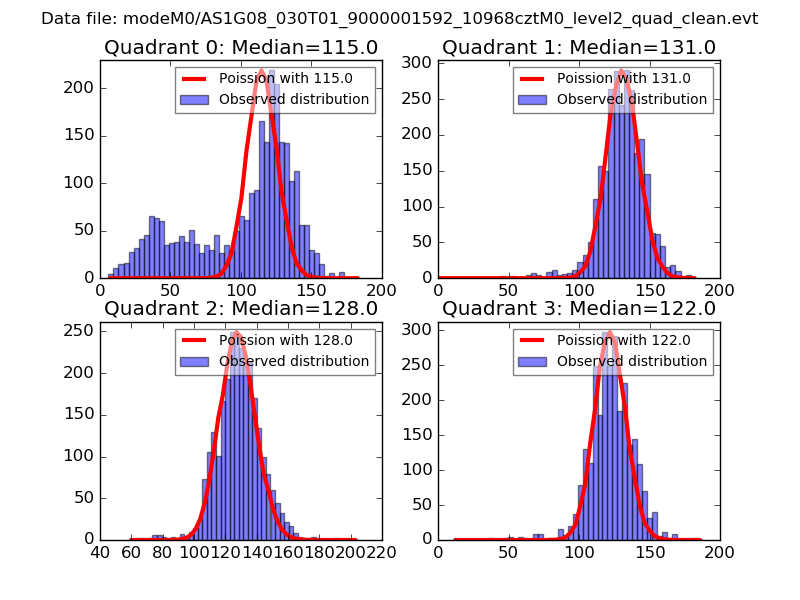 |
 |
| Quadrant-wise count rates Data is divided into 100 sec bins |
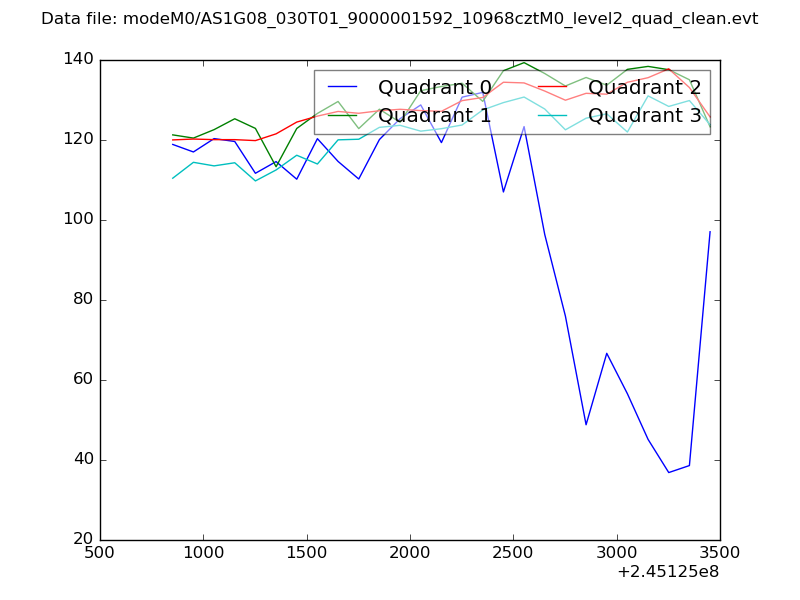 |
|
| Module-wise count rates for Quadrant A Data is divided into 100 sec bins |
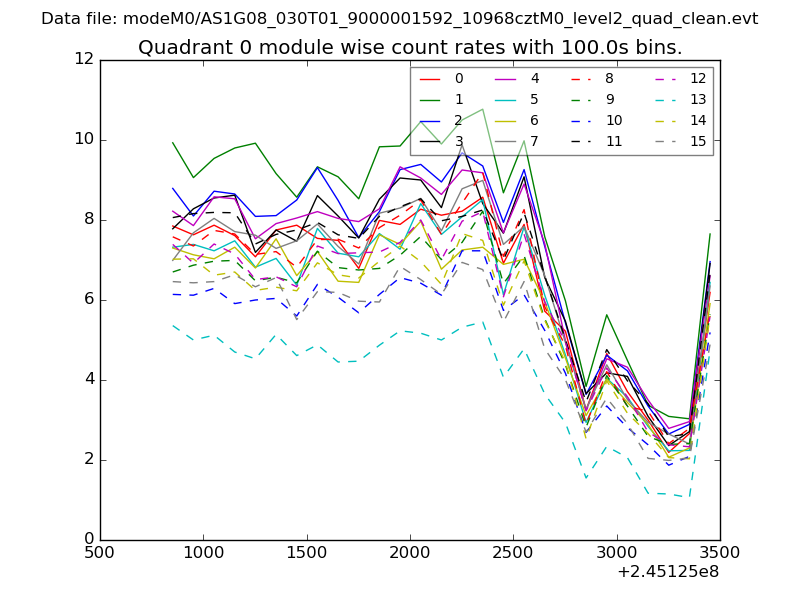 |
 |
| Module-wise count rates for Quadrant B Data is divided into 100 sec bins |
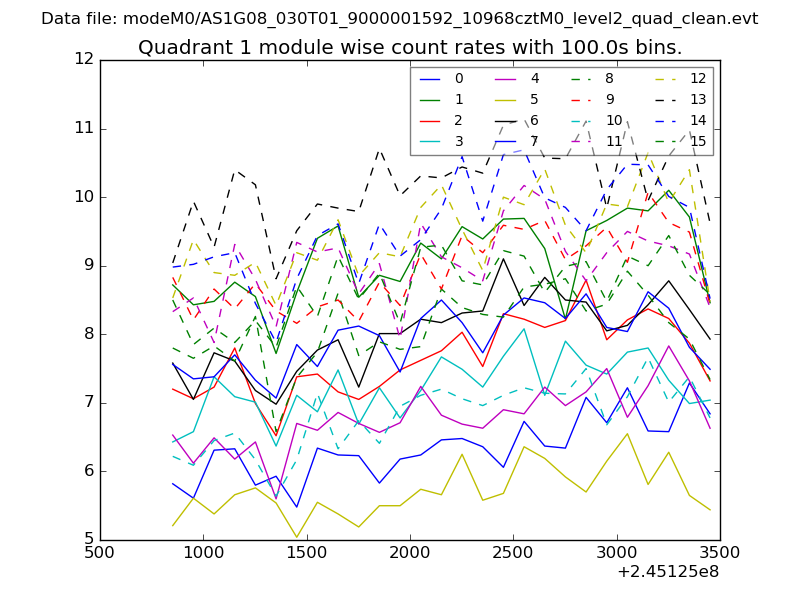 |
 |
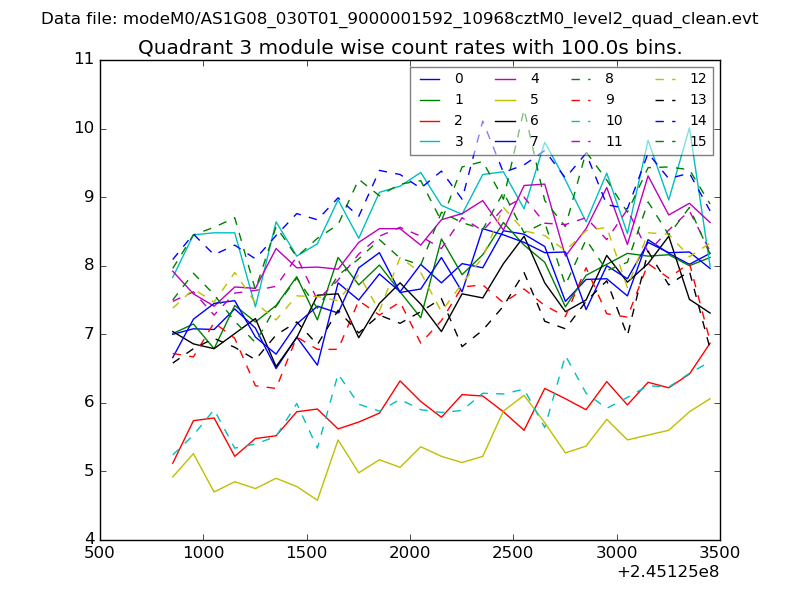
| Module-wise count rates for Quadrant C Data is divided into 100 sec bins |
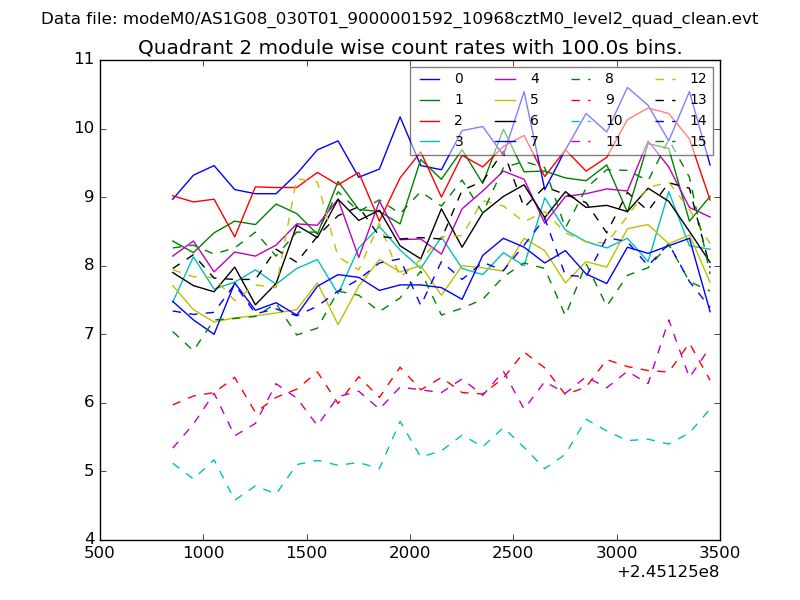 |
 |
| Module-wise count rates for Quadrant D Data is divided into 100 sec bins |
 |
 |
| Parameter | Plot |
|---|---|
| CZT HV Monitor | 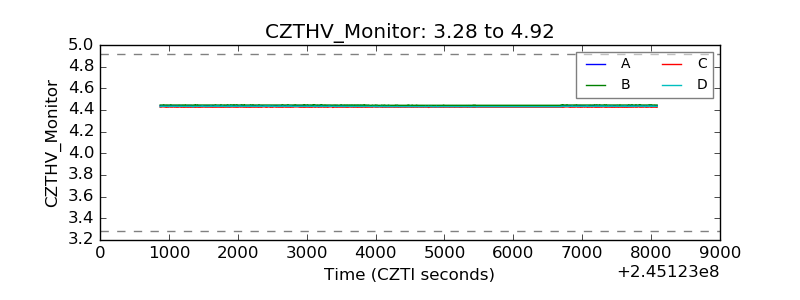 |
| D_VDD | 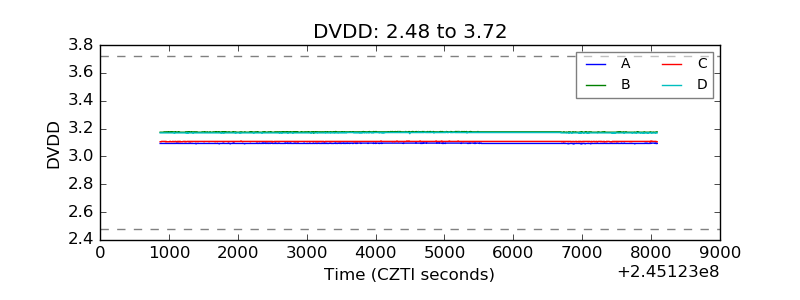 |
| Temperature 1 | 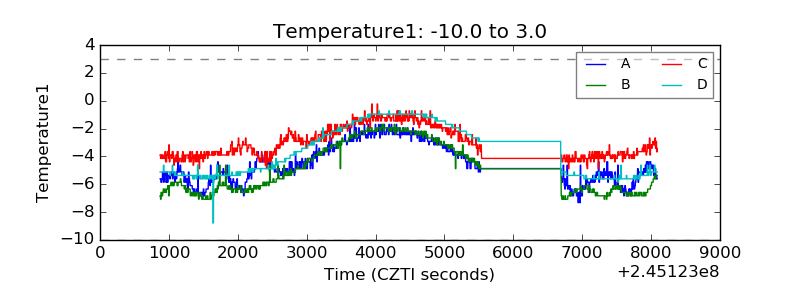 |
| Veto HV Monitor | 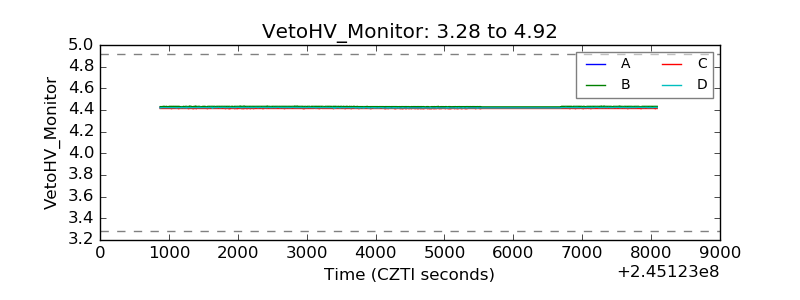 |
| Veto LLD | 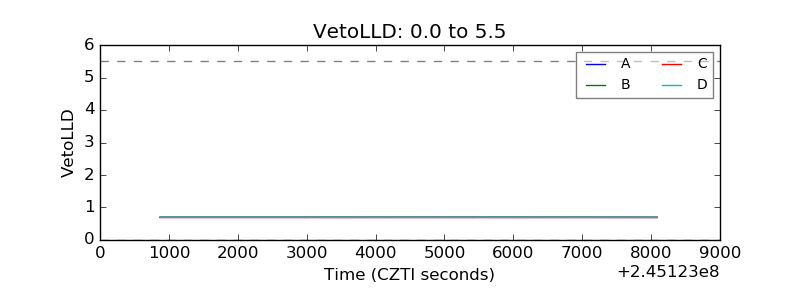 |
| Alpha Counter | 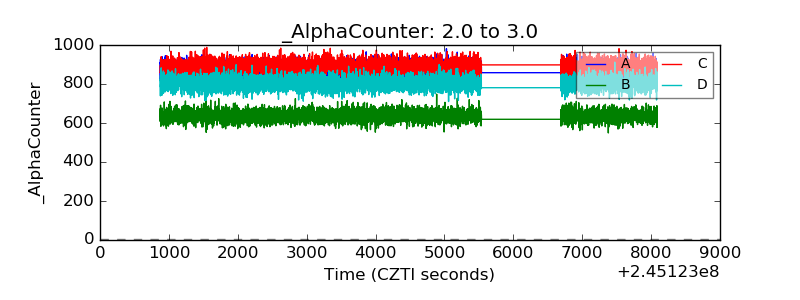 |
| _CPM_Rate | 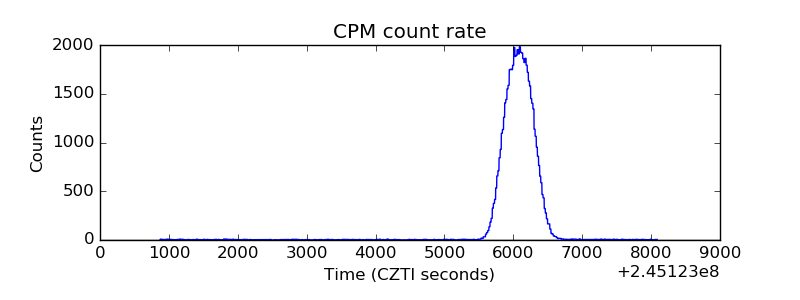 |
| CZT Counter | 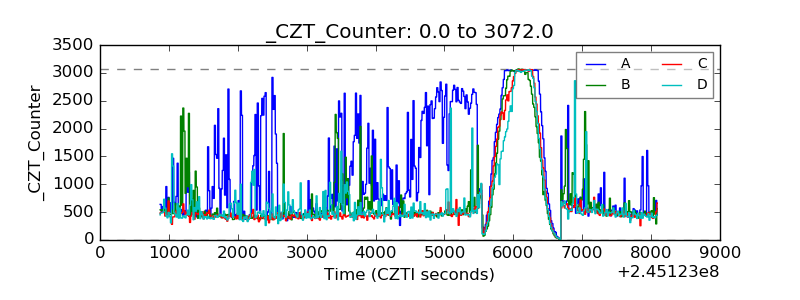 |
| +2.5 Volts monitor |  |
| +5 Volts monitor |  |
| _ROLL_ROT | 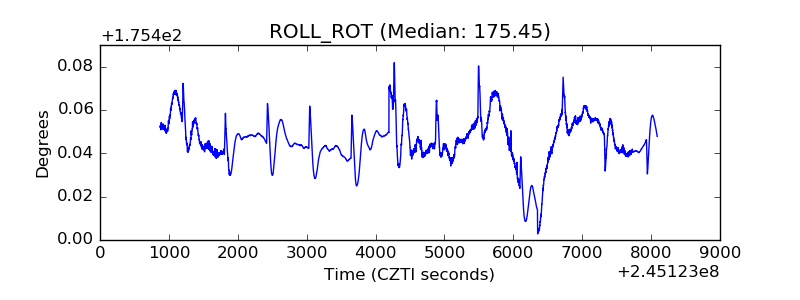 |
| _Roll_DEC | 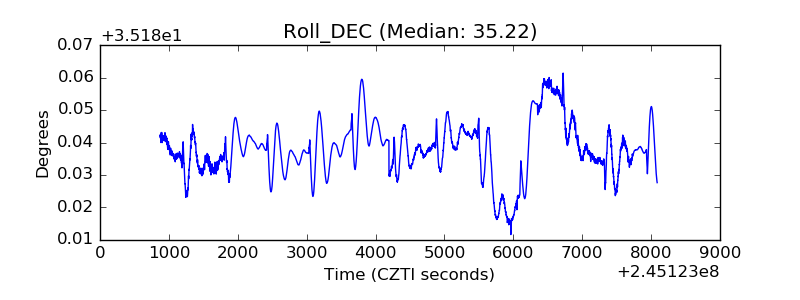 |
| _Roll_RA |  |
| Veto Counter | 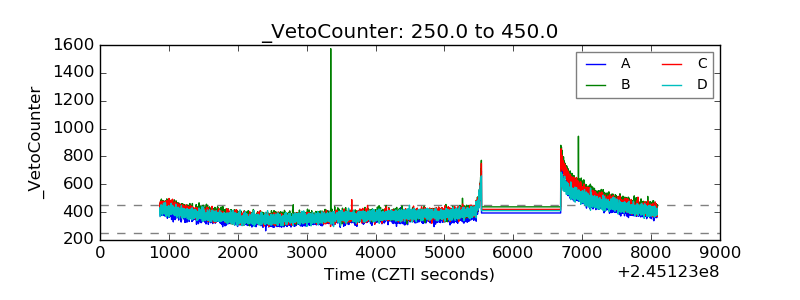 |