| Param | Original file | Final file |
|---|---|---|
| Filename | modeM0/AS1G08_030T01_9000001592_10971cztM0_level2.evt | modeM0/AS1G08_030T01_9000001592_10971cztM0_level2_quad_clean.evt |
| Size (bytes) | 144,642,240 | 13,196,160 |
| Size | 137.9 MB | 12.6 MB |
| Events in quadrant A | 1,065,447 | 69,988 |
| Events in quadrant B | 1,377,838 | 69,417 |
| Events in quadrant C | 893,629 | 69,002 |
| Events in quadrant D | 925,657 | 65,591 |
| Mode SS | |||
|---|---|---|---|
| Quadrant | BADHDUFLAG | Total packets | Discarded packets |
| A | 0 | 34 | 0 |
| B | 0 | 34 | 0 |
| C | 0 | 34 | 0 |
| D | 0 | 34 | 0 |
| Mode M9 | |||
|---|---|---|---|
| Quadrant | BADHDUFLAG | Total packets | Discarded packets |
| A | 0 | 2 | 0 |
| B | 0 | 2 | 0 |
| C | 0 | 2 | 0 |
| D | 0 | 3 | 0 |
| Mode M0 | |||
|---|---|---|---|
| Quadrant | BADHDUFLAG | Total packets | Discarded packets |
| A | 0 | 4288 | 1 |
| B | 0 | 5302 | 1 |
| C | 0 | 3614 | 1 |
| D | 0 | 3802 | 1 |
| Quadrant | Total seconds | Saturated seconds | Saturation percentage |
|---|---|---|---|
| A | 1700 | 24 | 1.411765% |
| B | 1700 | 105 | 6.176471% |
| C | 1700 | 4 | 0.235294% |
| D | 1700 | 5 | 0.294118% |
Noise dominated data is calculated using 1-second bins in cleaned event files. If a bin has >2000 counts, and if more than 50% of those come from <1% of pixels, then it is considered to be noise-dominated and hence unusable.
| Quadrant | # 1 sec bins | Bins with >0 counts | Bins with >2000 counts | High rate bins dominated by noise | Noise dominated (total time) | Noise dominated (detector-on time) | Marked lightcurve |
|---|---|---|---|---|---|---|---|
| A | 1700 | 1700 | 7 | 7 | 0.41% | 0.41% | 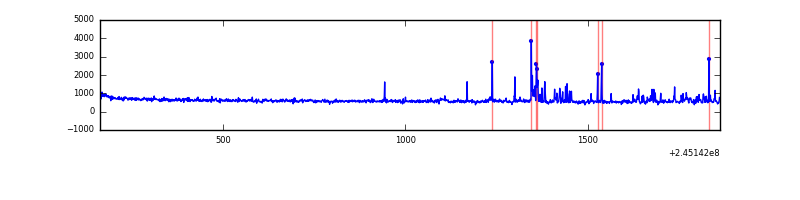 |
| B | 1700 | 1700 | 53 | 53 | 3.12% | 3.12% | 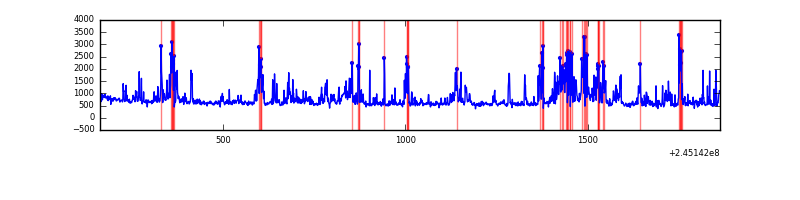 |
| C | 1700 | 1700 | 0 | 0 | 0.00% | 0.00% |  |
| D | 1700 | 1700 | 0 | 0 | 0.00% | 0.00% | 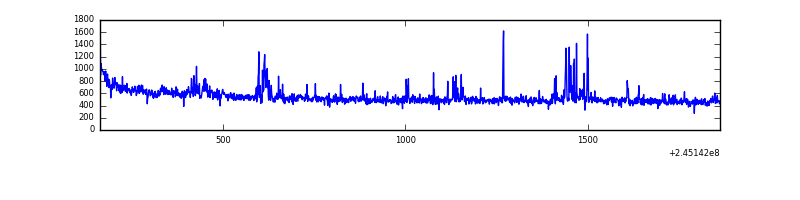 |
Top three noisy pixels from each quadrant. If the there are fewer than three noisy pixels in the level2.evt file, extra rows are filled as -1
| Pixel properties | Quadrant properties | ||||||
|---|---|---|---|---|---|---|---|
| Quadrant | DetID | PixID | Counts | Sigma | Mean | Median | Sigma |
| A | 8 | 5 | 126569 | 2553.04 | 242 | 238 | 49.5 |
| A | 13 | 251 | 3595 | 67.84 | 242 | 238 | 49.5 |
| A | 0 | 226 | 2222 | 40.09 | 242 | 238 | 49.5 |
| B | 4 | 239 | 428705 | 9240.0 | 239 | 235 | 46.4 |
| B | 11 | 51 | 10180 | 214.46 | 239 | 235 | 46.4 |
| B | 12 | 111 | 4790 | 98.23 | 239 | 235 | 46.4 |
| C | 5 | 207 | 1856 | 30.28 | 228 | 230 | 53.7 |
| C | 13 | 61 | 1753 | 28.36 | 228 | 230 | 53.7 |
| C | 14 | 67 | 710 | 8.94 | 228 | 230 | 53.7 |
| D | 14 | 34 | 17399 | 308.32 | 227 | 221 | 55.7 |
| D | 8 | 195 | 11559 | 203.5 | 227 | 221 | 55.7 |
| D | 1 | 52 | 11042 | 194.22 | 227 | 221 | 55.7 |
Histogram calculated using DETX and DETY for each event in the final _common_clean file
| Quadrant A | 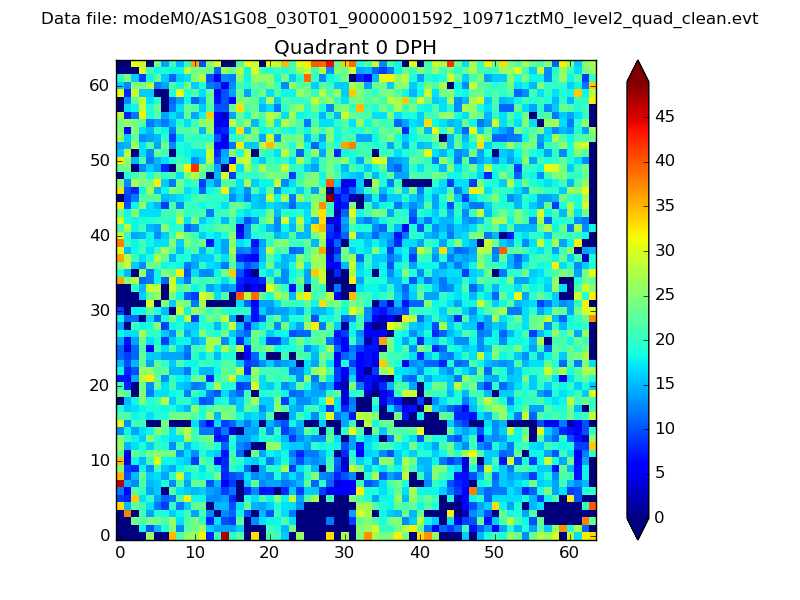 |
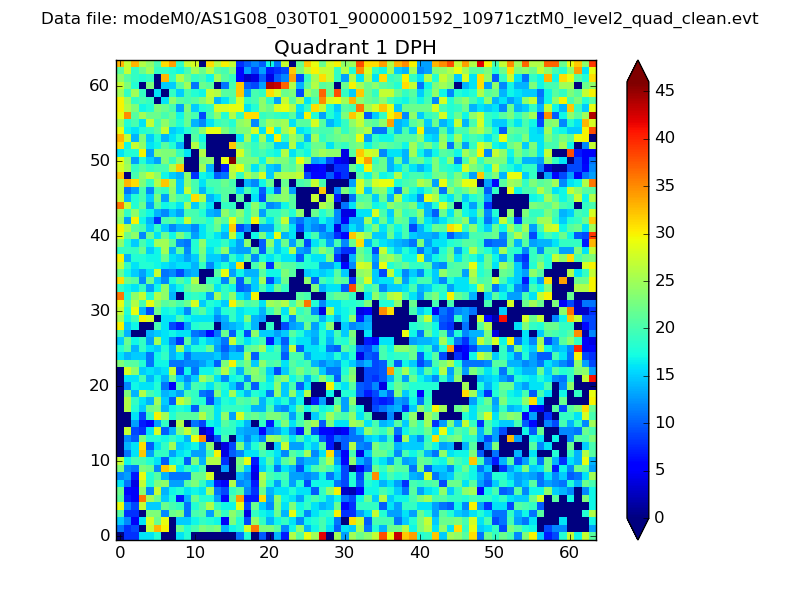 |
Quadrant B |
|---|---|---|---|
| Quadrant D |  |
 |
Quadrant C |
| Plot type | Count rate plots | Images |
|---|---|---|
| Comparison with Poisson distribution Blue bars denote a histogram of data divided into 1 sec bins. Red curve is a Poisson curve with rate = median count rate of data. |
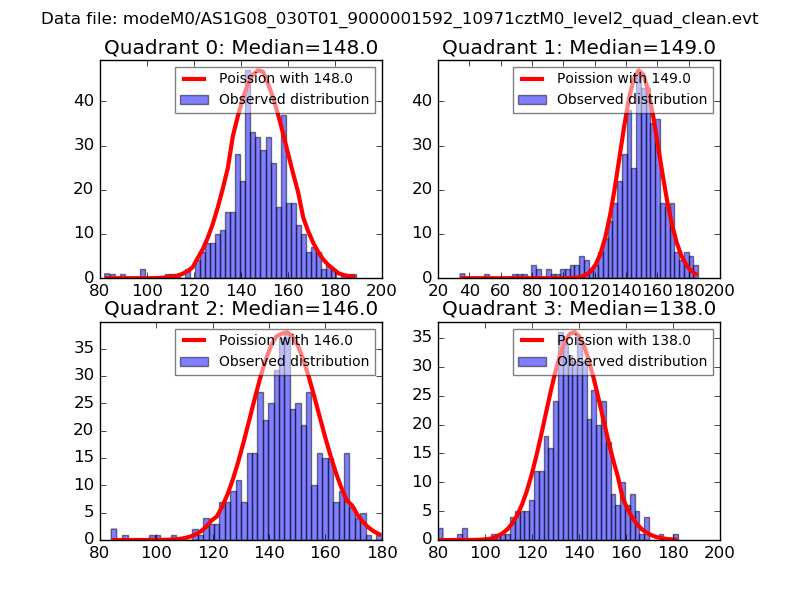 |
 |
| Quadrant-wise count rates Data is divided into 100 sec bins |
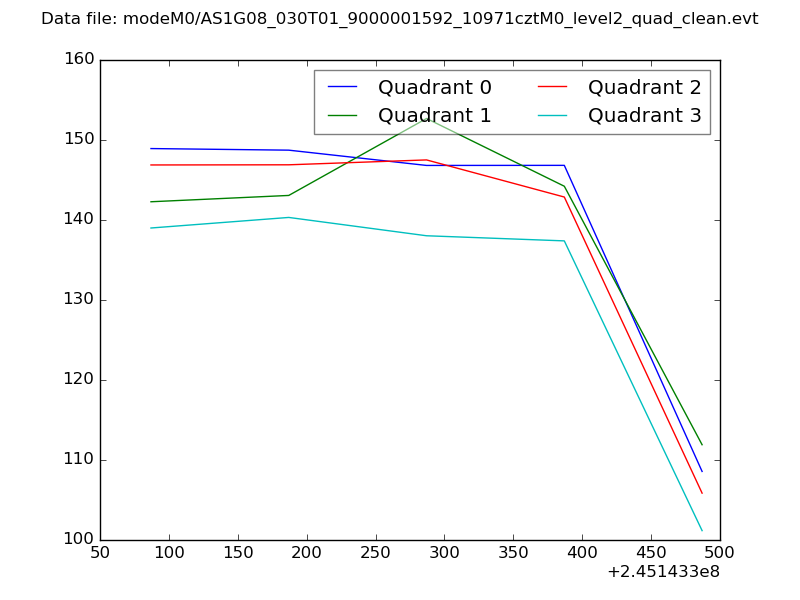 |
|
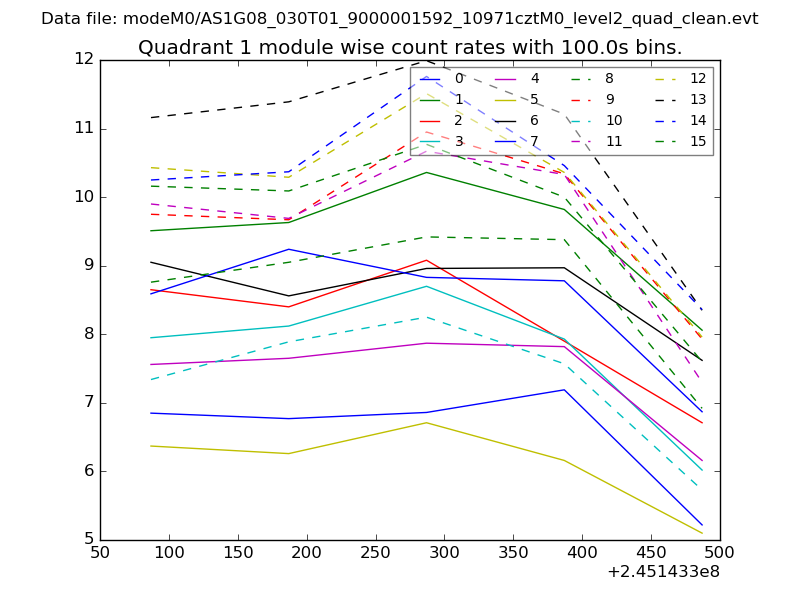
| Module-wise count rates for Quadrant A Data is divided into 100 sec bins |
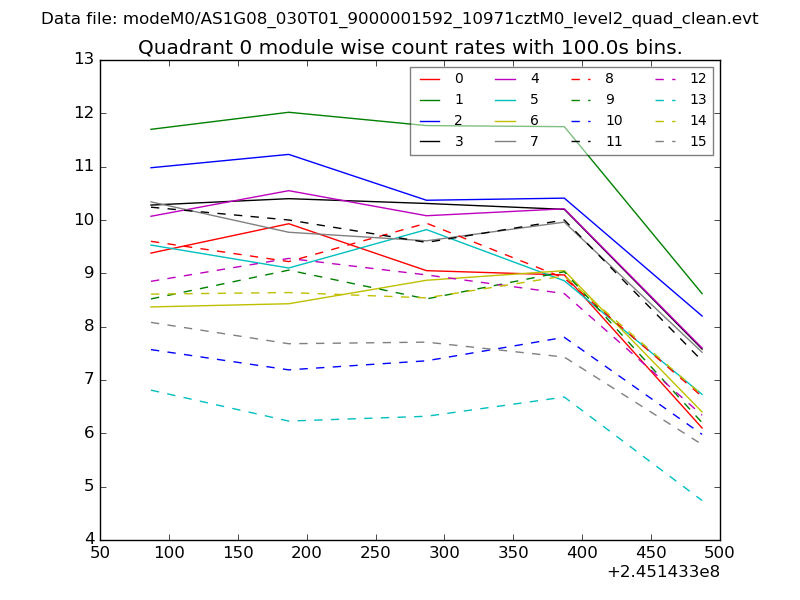 |
 |
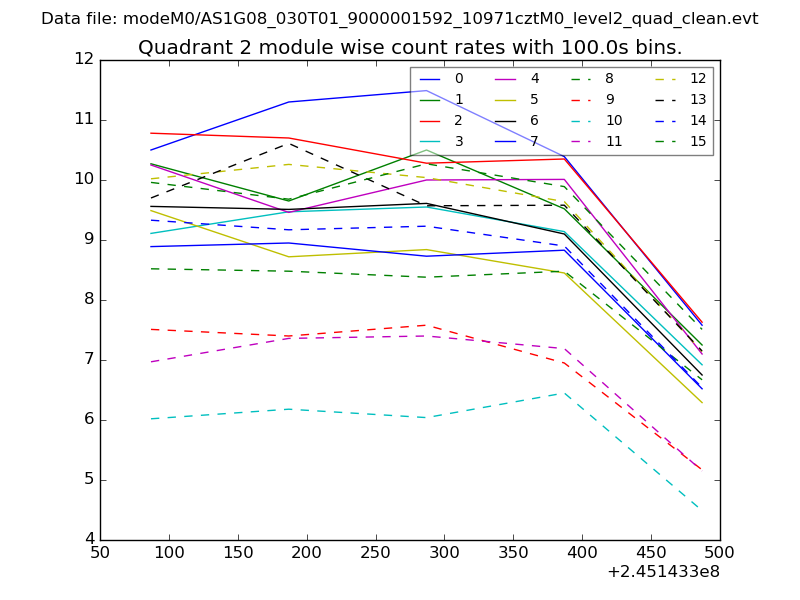
| Module-wise count rates for Quadrant B Data is divided into 100 sec bins |
 |
 |
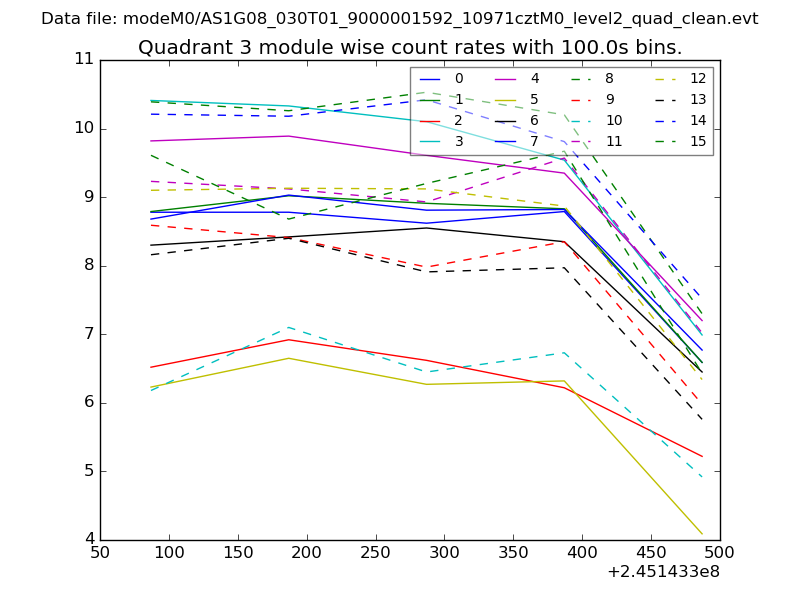
| Module-wise count rates for Quadrant C Data is divided into 100 sec bins |
 |
 |
| Module-wise count rates for Quadrant D Data is divided into 100 sec bins |
 |
 |
| Parameter | Plot |
|---|---|
| CZT HV Monitor | 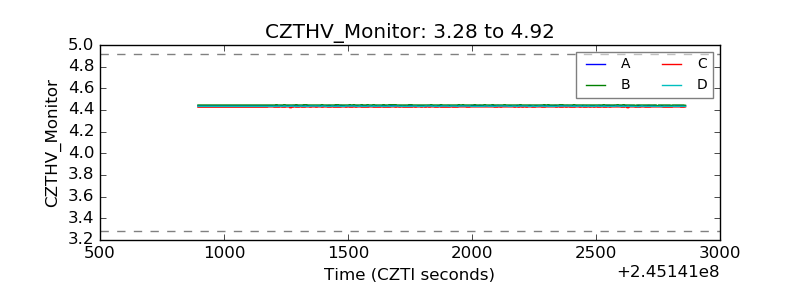 |
| D_VDD | 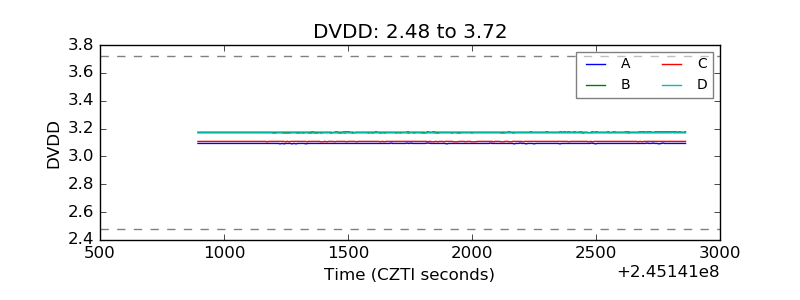 |
| Temperature 1 | 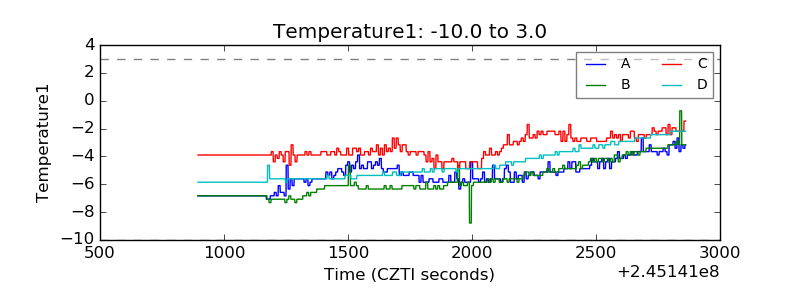 |
| Veto HV Monitor | 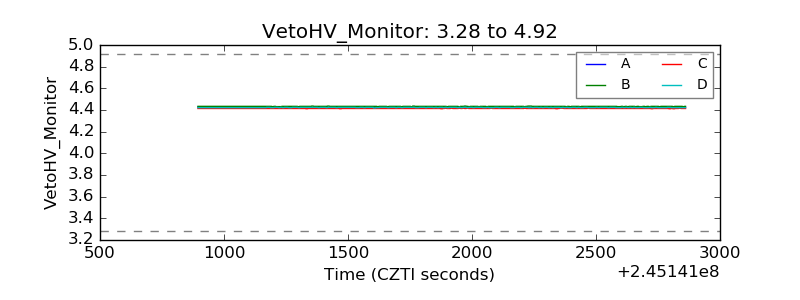 |
| Veto LLD | 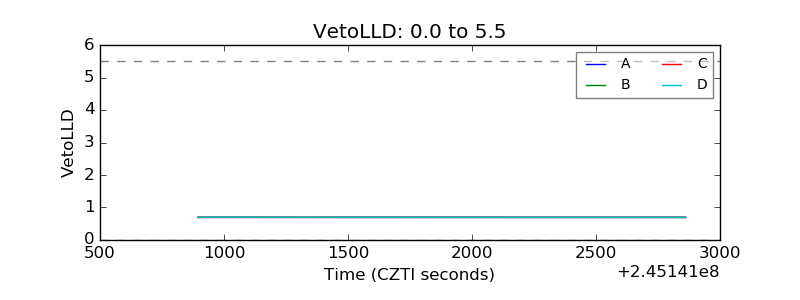 |
| Alpha Counter | 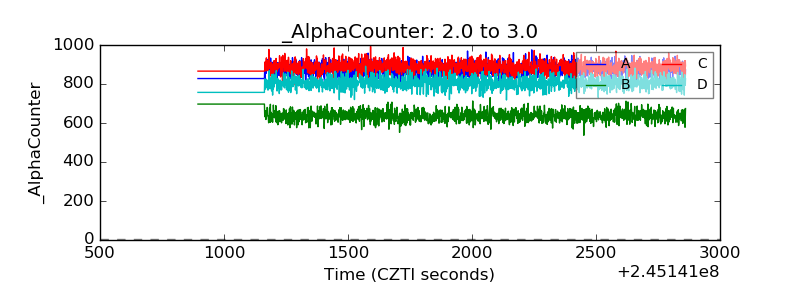 |
| _CPM_Rate | 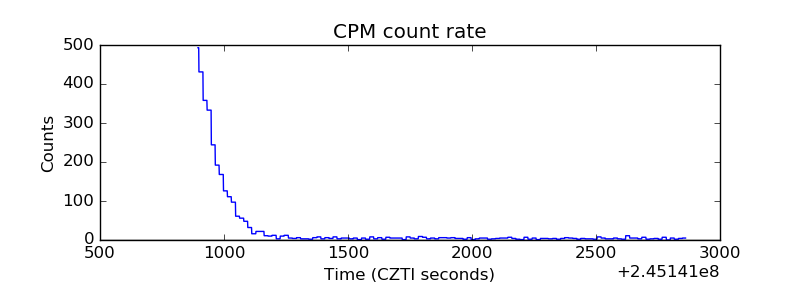 |
| CZT Counter |  |
| +2.5 Volts monitor |  |
| +5 Volts monitor |  |
| _ROLL_ROT | 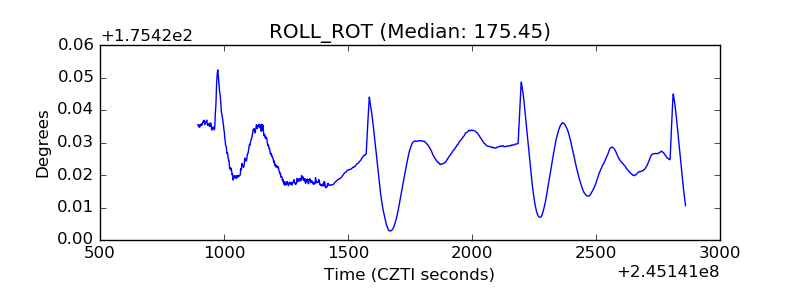 |
| _Roll_DEC | 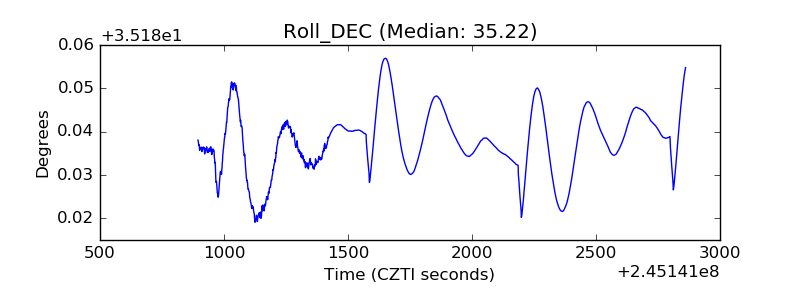 |
| _Roll_RA | 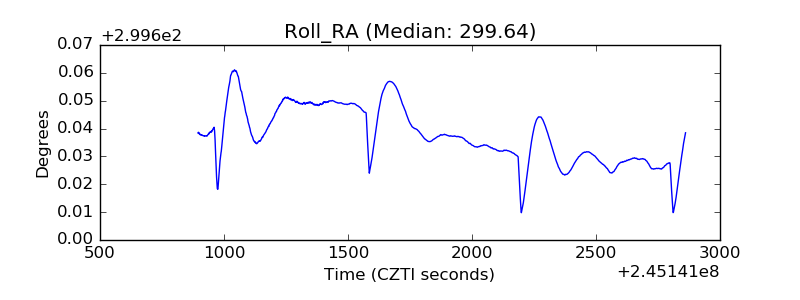 |
| Veto Counter | 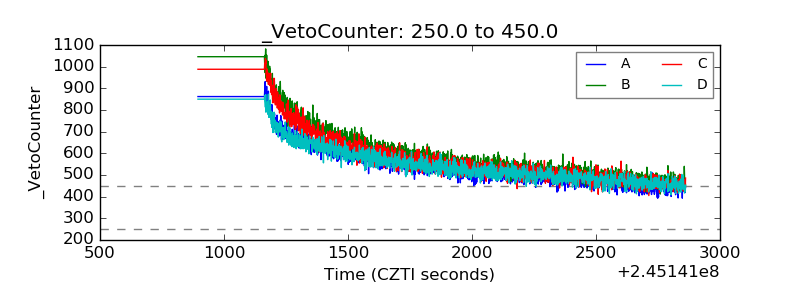 |