| Param | Original file | Final file |
|---|---|---|
| Filename | modeM0/AS1C03_004T01_9000001598cztM0_level2.fits | modeM0/AS1C03_004T01_9000001598cztM0_level2_quad_clean.evt |
| Size (bytes) | 168,537,600 | 142,309,440 |
| Size | 160.7 MB | 135.7 MB |
| Events in quadrant A | 1,110,388 | 743,804 |
| Events in quadrant B | 1,287,664 | 1,106,451 |
| Events in quadrant C | 1,361,002 | 1,127,119 |
| Events in quadrant D | 144,545 | 134,934 |
| Mode M9 | |||
|---|---|---|---|
| Quadrant | BADHDUFLAG | Total packets | Discarded packets |
| A | 0 | 57 | 0 |
| B | 0 | 56 | 0 |
| C | 0 | 58 | 0 |
| D | 0 | 56 | 0 |
| Mode M0 | |||
|---|---|---|---|
| Quadrant | BADHDUFLAG | Total packets | Discarded packets |
| A | 0 | 97378 | 0 |
| B | 0 | 53209 | 0 |
| C | 0 | 44925 | 0 |
| D | 0 | 10862 | 0 |
| Mode SS | |||
|---|---|---|---|
| Quadrant | BADHDUFLAG | Total packets | Discarded packets |
| A | 0 | 454 | 0 |
| B | 0 | 440 | 0 |
| C | 0 | 440 | 0 |
| D | 0 | 446 | 0 |
| Quadrant | Total seconds | Saturated seconds | Saturation percentage |
|---|---|---|---|
| A | 21417 | 6187 | 28.888266% |
| B | 21721 | 817 | 3.761337% |
| C | 21877 | 70 | 0.319971% |
| D | 3137 | 181 | 5.769844% |
Noise dominated data is calculated using 1-second bins in cleaned event files. If a bin has >2000 counts, and if more than 50% of those come from <1% of pixels, then it is considered to be noise-dominated and hence unusable.
| Quadrant | # 1 sec bins | Bins with >0 counts | Bins with >2000 counts | High rate bins dominated by noise | Noise dominated (total time) | Noise dominated (detector-on time) | Marked lightcurve |
|---|---|---|---|---|---|---|---|
| A | 30028 | 22348 | 0 | 0 | 0.00% | 0.00% | 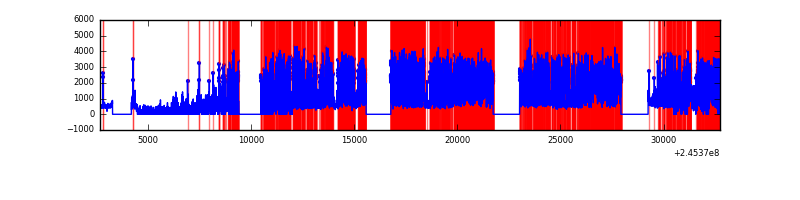 |
| B | 30028 | 22733 | 0 | 0 | 0.00% | 0.00% | 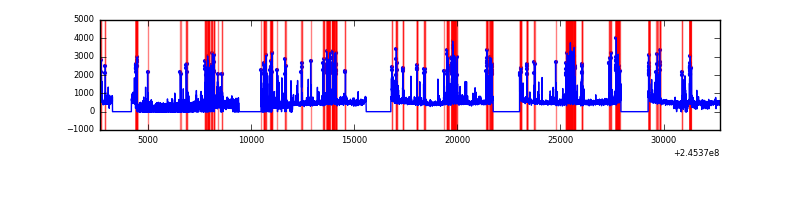 |
| C | 30028 | 22892 | 0 | 0 | 0.00% | 0.00% | 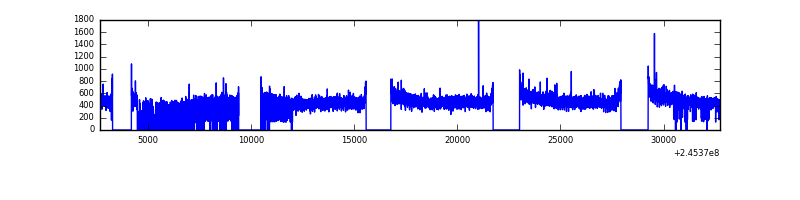 |
| D | 6539 | 3888 | 0 | 0 | 0.00% | 0.00% | 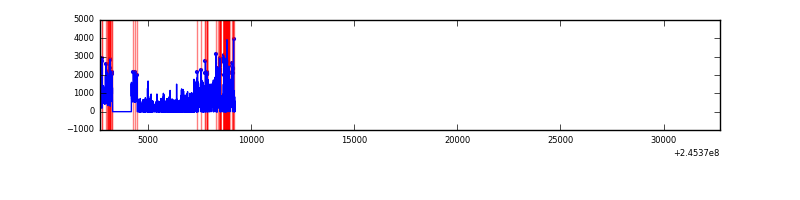 |
Top three noisy pixels from each quadrant. If the there are fewer than three noisy pixels in the level2.evt file, extra rows are filled as -1
| Pixel properties | Quadrant properties | ||||||
|---|---|---|---|---|---|---|---|
| Quadrant | DetID | PixID | Counts | Sigma | Mean | Median | Sigma |
| A | 0 | 29 | 1009 | 10.19 | 289 | 274 | 72.1 |
| A | 7 | 110 | 855 | 8.06 | 289 | 274 | 72.1 |
| A | 0 | 30 | 821 | 7.59 | 289 | 274 | 72.1 |
| B | 2 | 9 | 1127 | 11.6 | 340 | 326 | 69.1 |
| B | 3 | 17 | 891 | 8.18 | 340 | 326 | 69.1 |
| B | 3 | 80 | 878 | 7.99 | 340 | 326 | 69.1 |
| C | 1 | 81 | 1027 | 7.41 | 359 | 339 | 92.8 |
| C | 1 | 80 | 1023 | 7.37 | 359 | 339 | 92.8 |
| C | 12 | 241 | 947 | 6.55 | 359 | 339 | 92.8 |
| D | 3 | 31 | 119 | 6.45 | 41 | 37 | 12.7 |
| D | 4 | 246 | 116 | 6.21 | 41 | 37 | 12.7 |
| D | 3 | 159 | 114 | 6.06 | 41 | 37 | 12.7 |
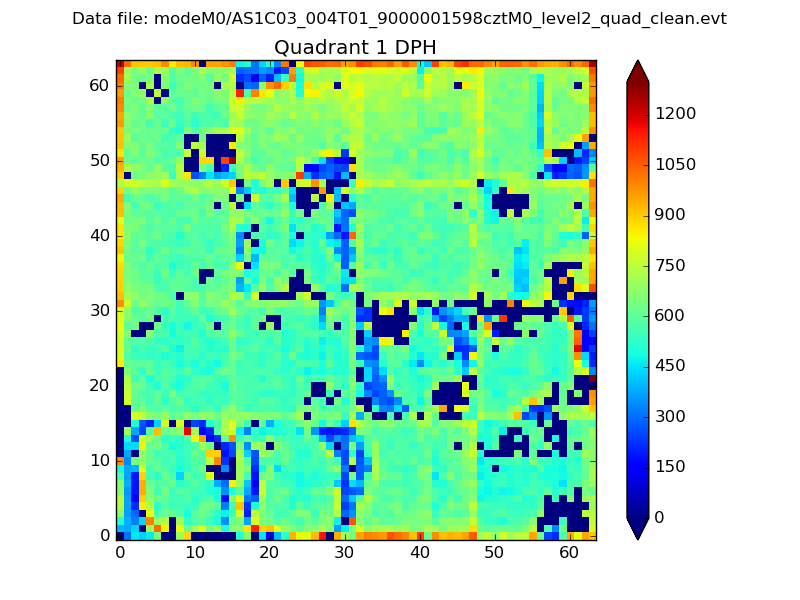
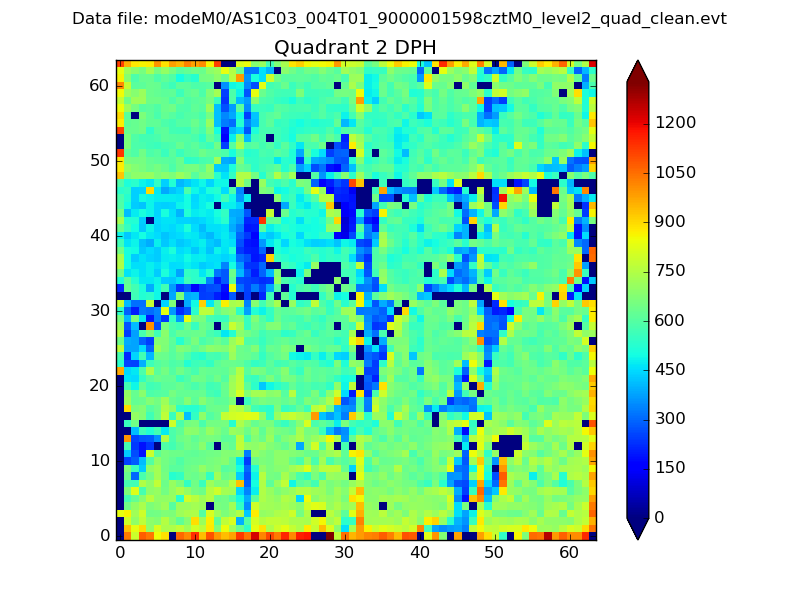
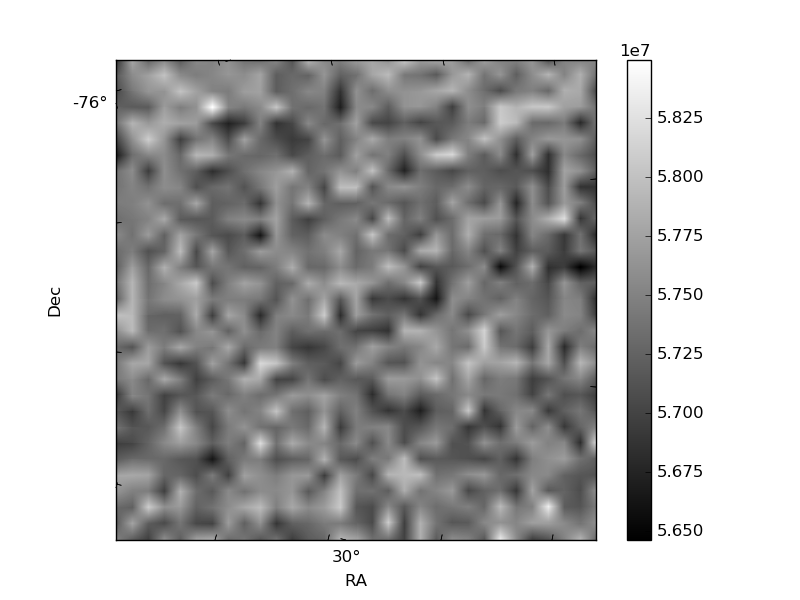
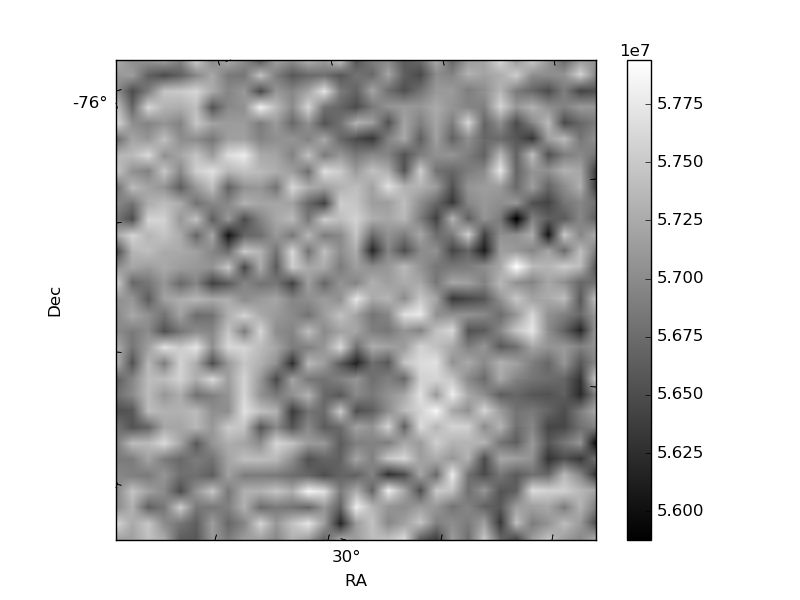
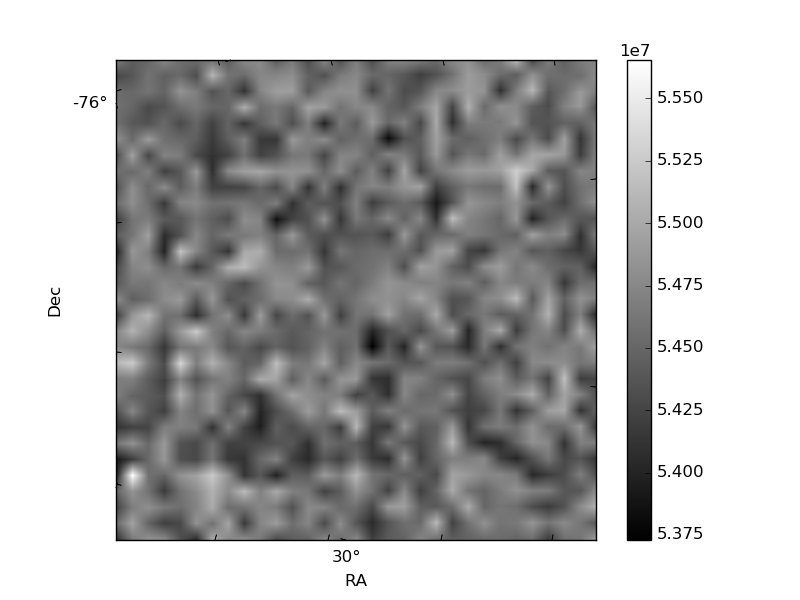
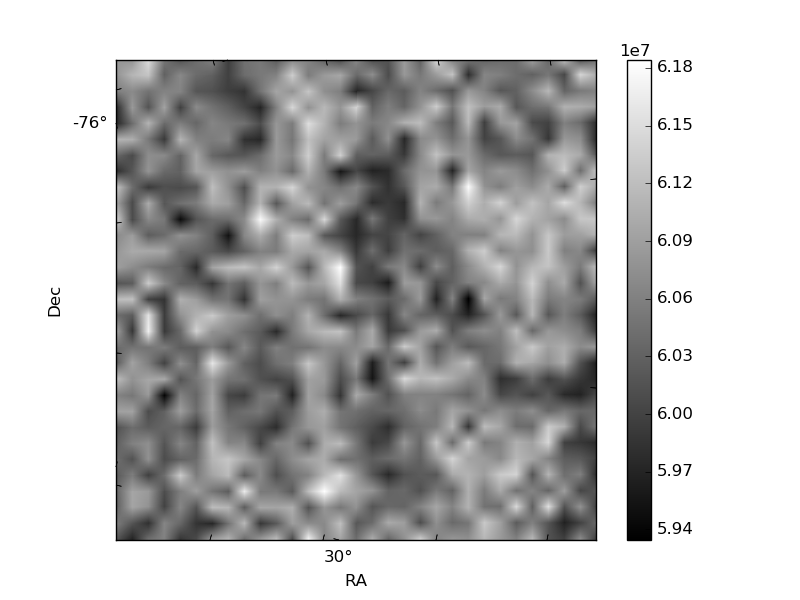
Histogram calculated using DETX and DETY for each event in the final _common_clean file
| Quadrant A |  |
 |
Quadrant B |
|---|---|---|---|
| Quadrant D | 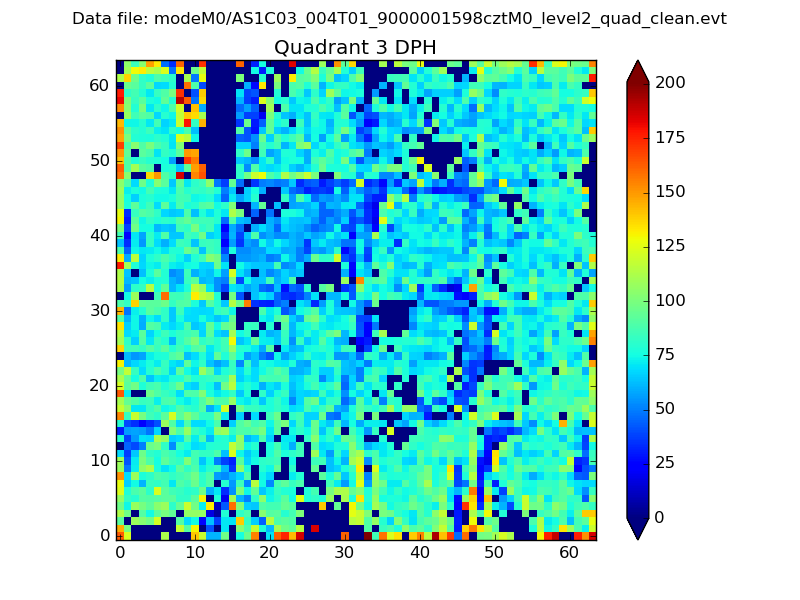 |
 |
Quadrant C |
| Plot type | Count rate plots | Images |
|---|---|---|
| Comparison with Poisson distribution Blue bars denote a histogram of data divided into 1 sec bins. Red curve is a Poisson curve with rate = median count rate of data. |
 |
 |
| Quadrant-wise count rates Data is divided into 100 sec bins |
 |
|
| Module-wise count rates for Quadrant A Data is divided into 100 sec bins |
 |
 |
| Module-wise count rates for Quadrant B Data is divided into 100 sec bins |
 |
 |
| Module-wise count rates for Quadrant C Data is divided into 100 sec bins |
 |
 |
| Module-wise count rates for Quadrant D Data is divided into 100 sec bins |
 |
 |
| Parameter | Plot |
|---|---|
| CZT HV Monitor |  |
| D_VDD | 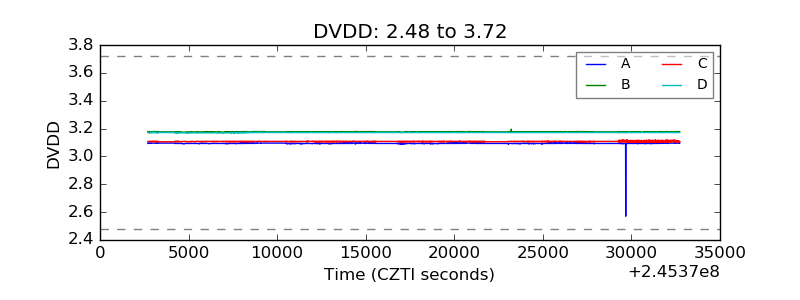 |
| Temperature 1 | 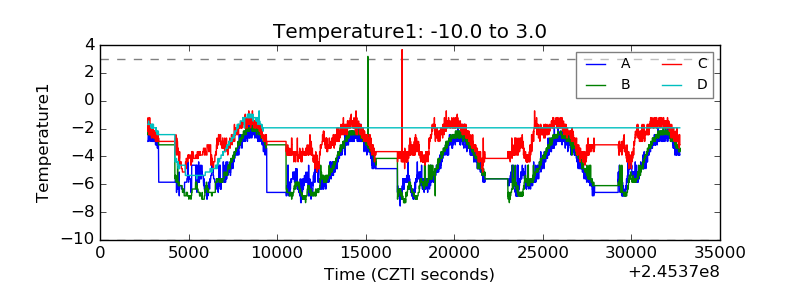 |
| Veto HV Monitor |  |
| Veto LLD | 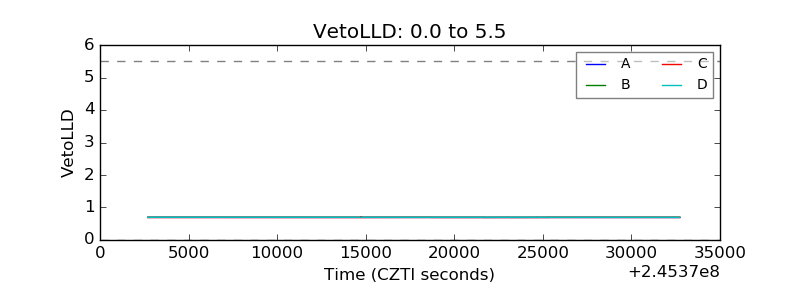 |
| Alpha Counter | 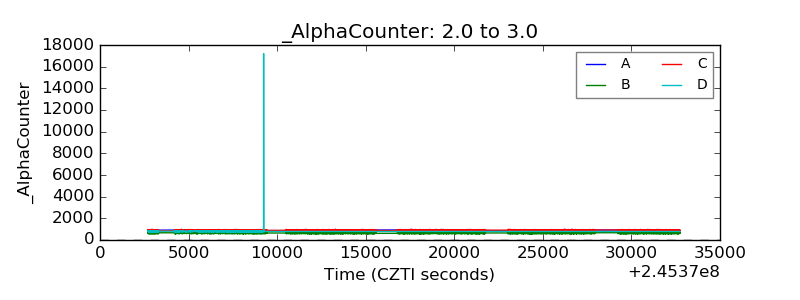 |
| _CPM_Rate |  |
| CZT Counter | 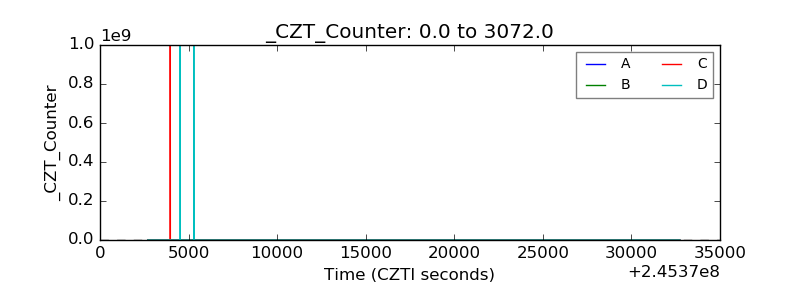 |
| +2.5 Volts monitor | 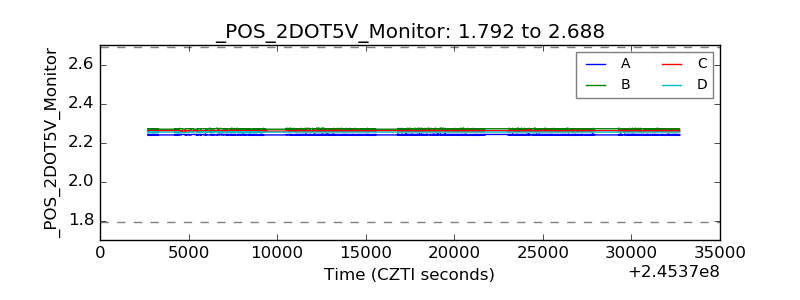 |
| +5 Volts monitor |  |
| _ROLL_ROT |  |
| _Roll_DEC |  |
| _Roll_RA | 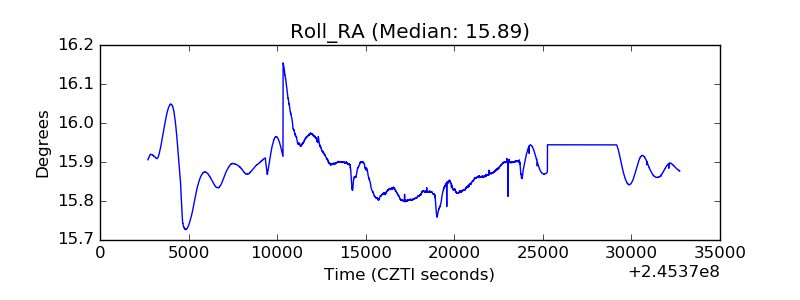 |
| Veto Counter | 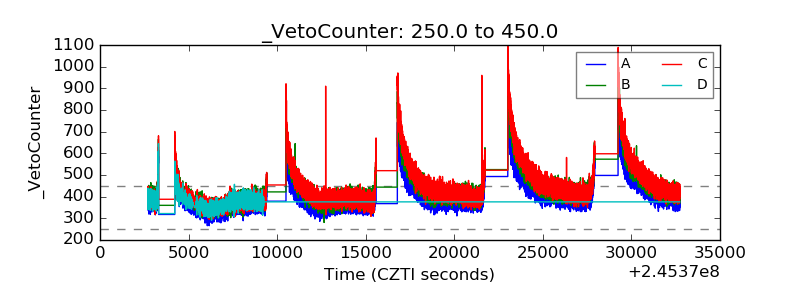 |