| Param | Original file | Final file |
|---|---|---|
| Filename | modeM0/AS1C03_004T01_9000001598_11010cztM0_level2.evt | modeM0/AS1C03_004T01_9000001598_11010cztM0_level2_quad_clean.evt |
| Size (bytes) | 414,357,120 | 70,513,920 |
| Size | 395.2 MB | 67.2 MB |
| Events in quadrant A | 3,992,016 | 452,107 |
| Events in quadrant B | 2,992,942 | 531,914 |
| Events in quadrant C | 2,323,846 | 550,881 |
| Events in quadrant D | 2,933,748 | 283,344 |
| Mode M9 | |||
|---|---|---|---|
| Quadrant | BADHDUFLAG | Total packets | Discarded packets |
| A | 0 | 20 | 1 |
| B | 0 | 20 | 2 |
| C | 0 | 20 | 0 |
| D | 0 | 20 | 2 |
| Mode M0 | |||
|---|---|---|---|
| Quadrant | BADHDUFLAG | Total packets | Discarded packets |
| A | 0 | 23735 | 8807 |
| B | 0 | 18859 | 6806 |
| C | 0 | 14839 | 4566 |
| D | 0 | 24701 | 13839 |
| Mode SS | |||
|---|---|---|---|
| Quadrant | BADHDUFLAG | Total packets | Discarded packets |
| A | 0 | 150 | 36 |
| B | 0 | 150 | 50 |
| C | 0 | 150 | 54 |
| D | 0 | 150 | 44 |
| Quadrant | Total seconds | Saturated seconds | Saturation percentage |
|---|---|---|---|
| A | 4671 | 568 | 12.160137% |
| B | 4908 | 181 | 3.687857% |
| C | 5065 | 19 | 0.375123% |
| D | 3137 | 181 | 5.769844% |
Noise dominated data is calculated using 1-second bins in cleaned event files. If a bin has >2000 counts, and if more than 50% of those come from <1% of pixels, then it is considered to be noise-dominated and hence unusable.
| Quadrant | # 1 sec bins | Bins with >0 counts | Bins with >2000 counts | High rate bins dominated by noise | Noise dominated (total time) | Noise dominated (detector-on time) | Marked lightcurve |
|---|---|---|---|---|---|---|---|
| A | 9325 | 5642 | 388 | 388 | 4.16% | 6.88% | 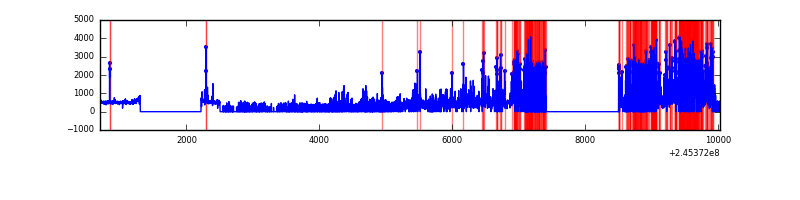 |
| B | 9326 | 5856 | 84 | 84 | 0.90% | 1.43% | 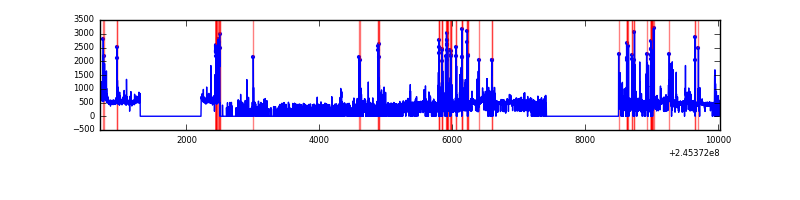 |
| C | 9326 | 6010 | 0 | 0 | 0.00% | 0.00% | 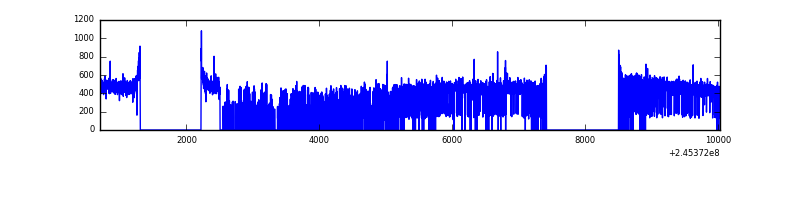 |
| D | 6539 | 3902 | 126 | 126 | 1.93% | 3.23% | 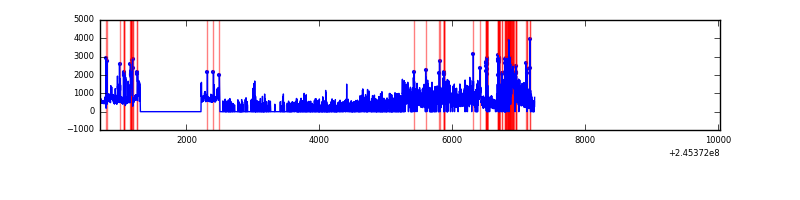 |
Top three noisy pixels from each quadrant. If the there are fewer than three noisy pixels in the level2.evt file, extra rows are filled as -1
| Pixel properties | Quadrant properties | ||||||
|---|---|---|---|---|---|---|---|
| Quadrant | DetID | PixID | Counts | Sigma | Mean | Median | Sigma |
| A | 14 | 238 | 1714462 | 15920.46 | 525 | 514 | 107.7 |
| A | 8 | 5 | 246534 | 2285.22 | 525 | 514 | 107.7 |
| A | 15 | 174 | 4952 | 41.22 | 525 | 514 | 107.7 |
| B | 4 | 239 | 604659 | 5428.69 | 585 | 571 | 111.3 |
| B | 15 | 204 | 38510 | 340.94 | 585 | 571 | 111.3 |
| B | 0 | 214 | 25732 | 226.11 | 585 | 571 | 111.3 |
| C | 13 | 61 | 4390 | 27.7 | 594 | 596 | 137.0 |
| C | 12 | 4 | 3774 | 23.2 | 594 | 596 | 137.0 |
| C | 5 | 207 | 1880 | 9.38 | 594 | 596 | 137.0 |
| D | 1 | 52 | 862940 | 9954.85 | 353 | 342 | 86.7 |
| D | 11 | 129 | 241733 | 2785.78 | 353 | 342 | 86.7 |
| D | 8 | 195 | 162756 | 1874.35 | 353 | 342 | 86.7 |
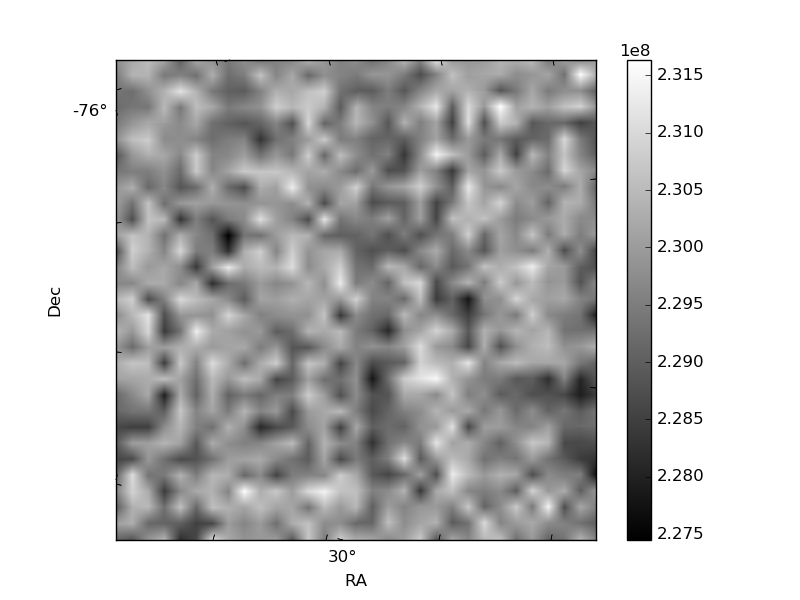
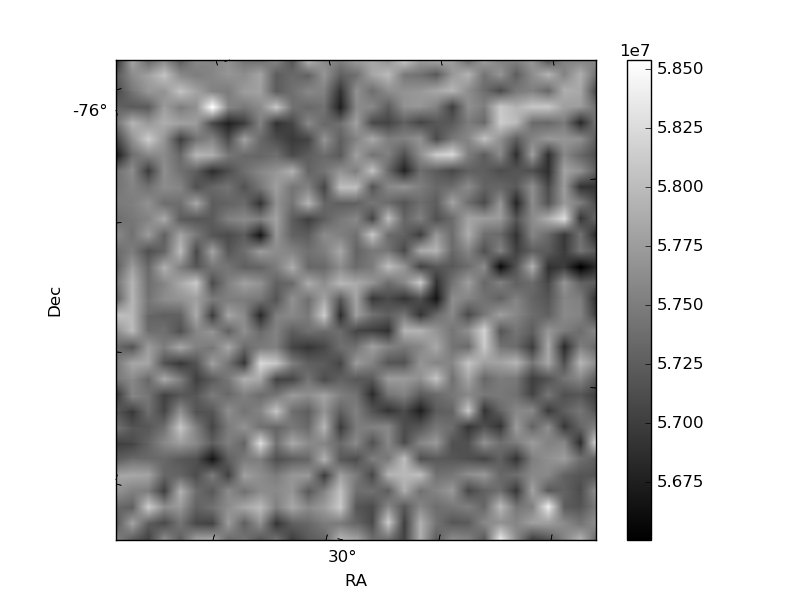
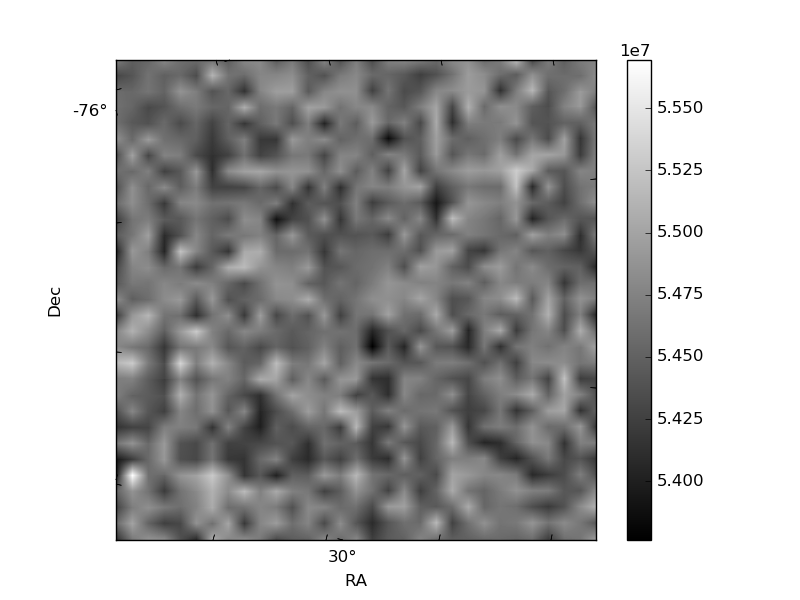
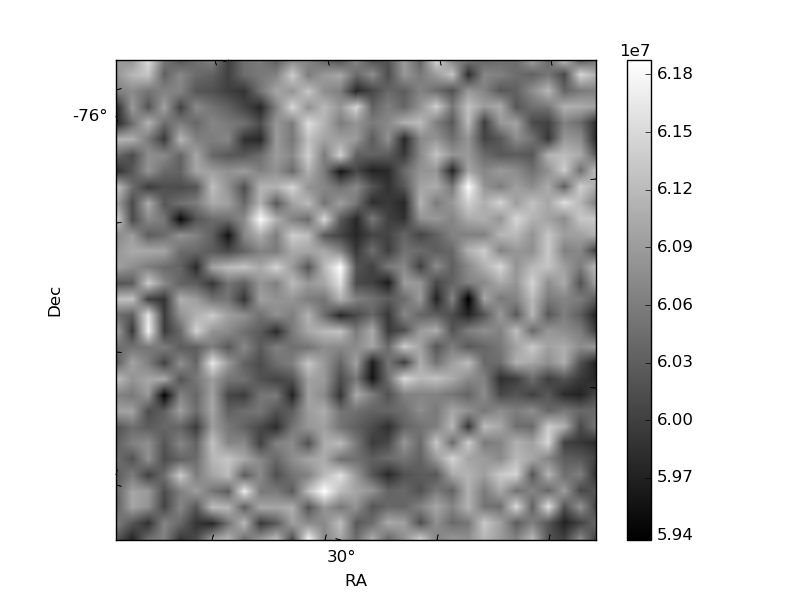
Histogram calculated using DETX and DETY for each event in the final _common_clean file
| Quadrant A | 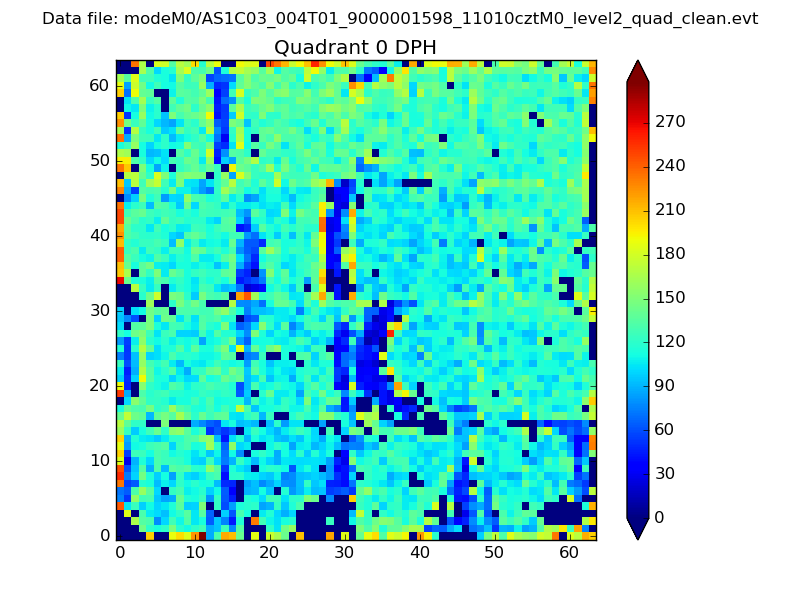 |
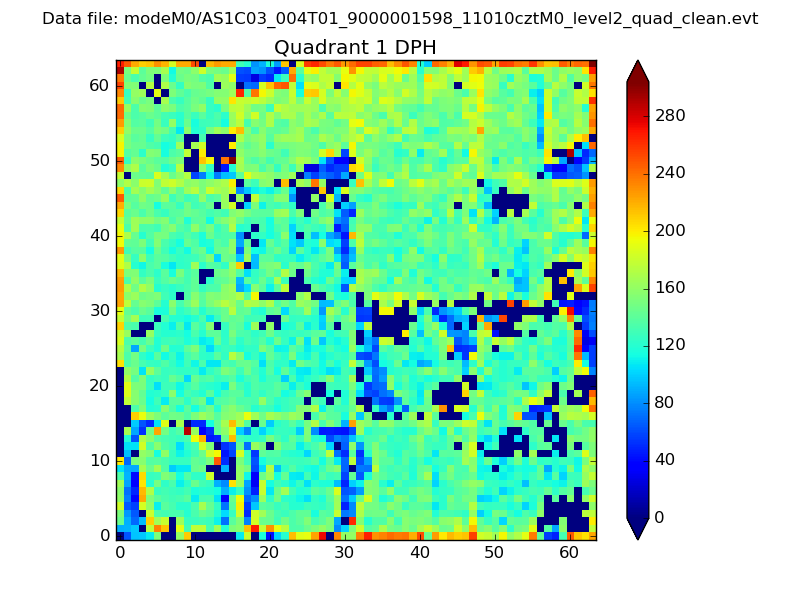 |
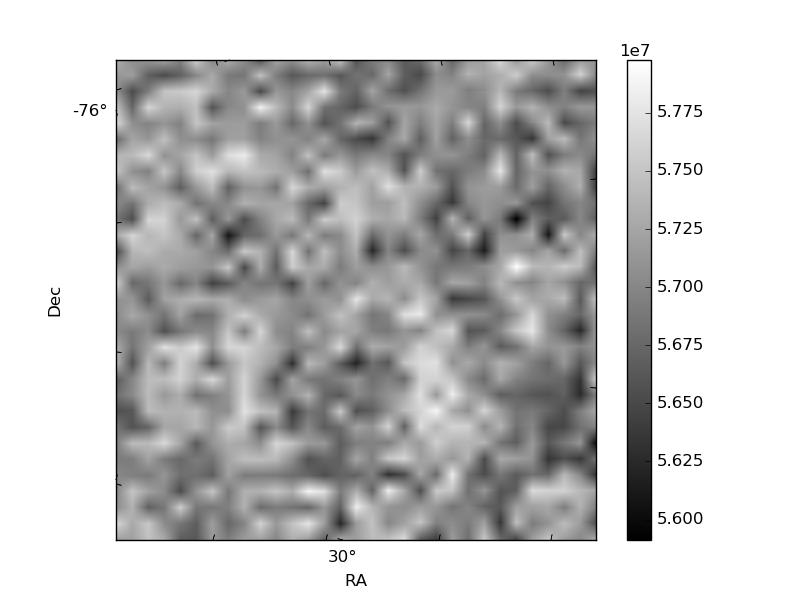
Quadrant B |
|---|---|---|---|
| Quadrant D | 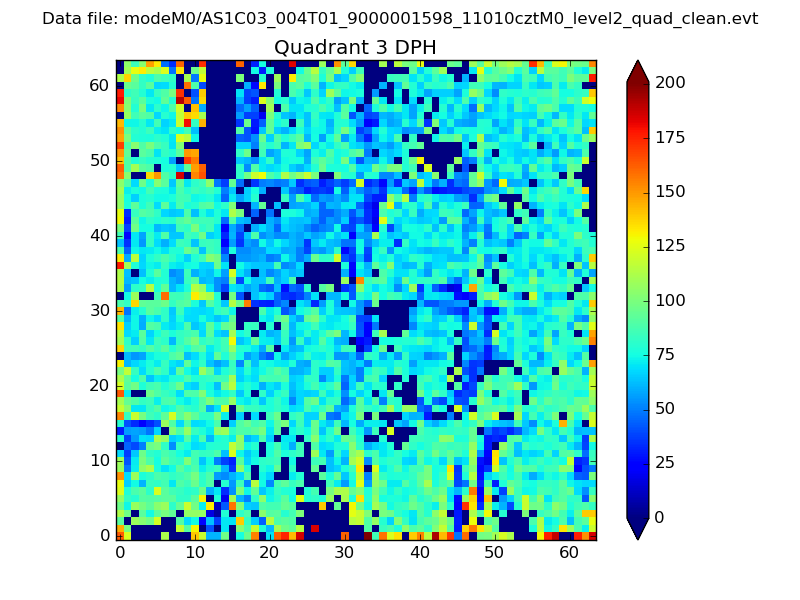 |
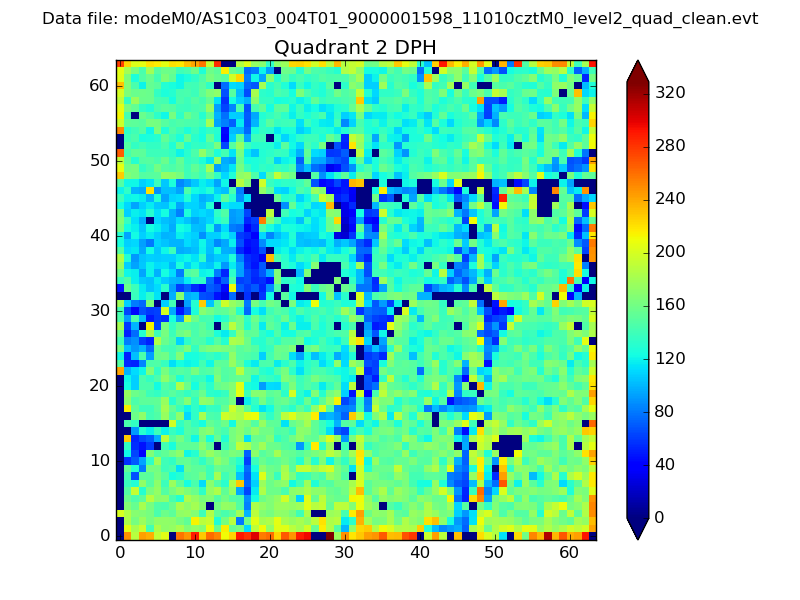 |
Quadrant C |
| Plot type | Count rate plots | Images |
|---|---|---|
| Comparison with Poisson distribution Blue bars denote a histogram of data divided into 1 sec bins. Red curve is a Poisson curve with rate = median count rate of data. |
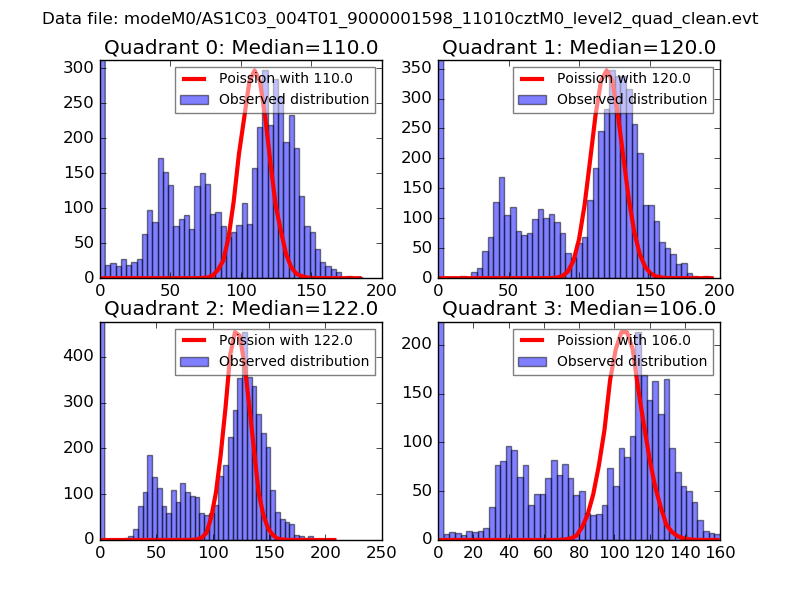 |
 |
| Quadrant-wise count rates Data is divided into 100 sec bins |
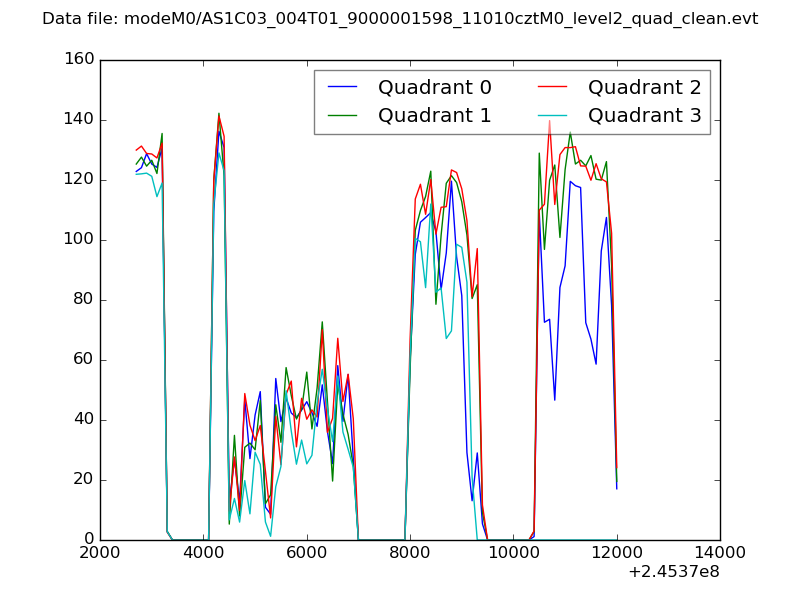 |
|
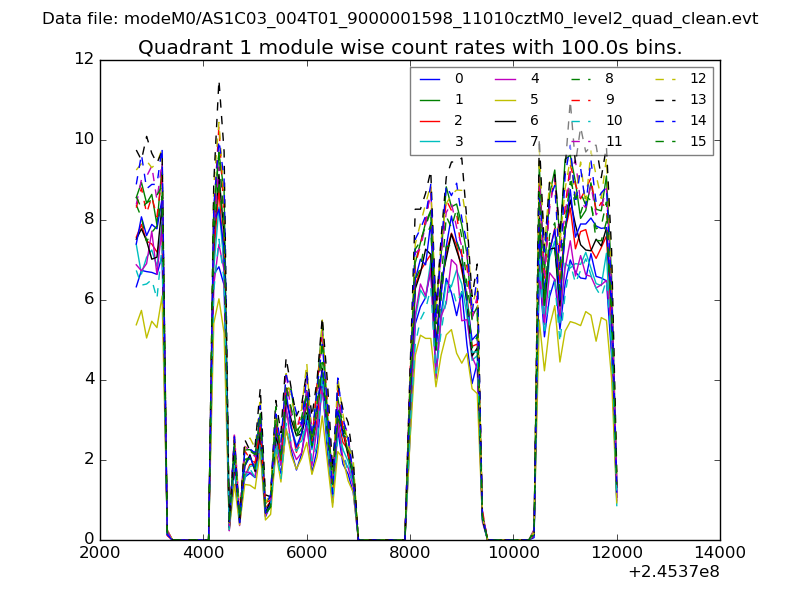
| Module-wise count rates for Quadrant A Data is divided into 100 sec bins |
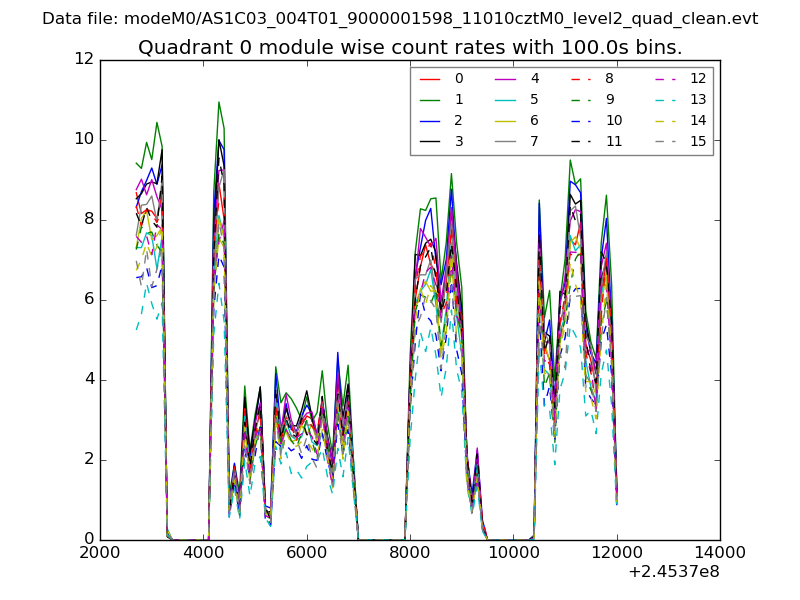 |
 |
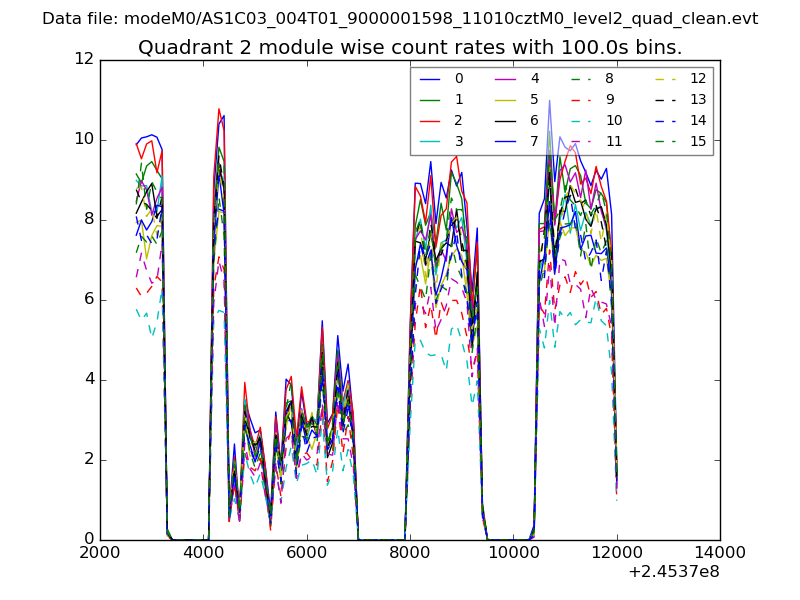
| Module-wise count rates for Quadrant B Data is divided into 100 sec bins |
 |
 |
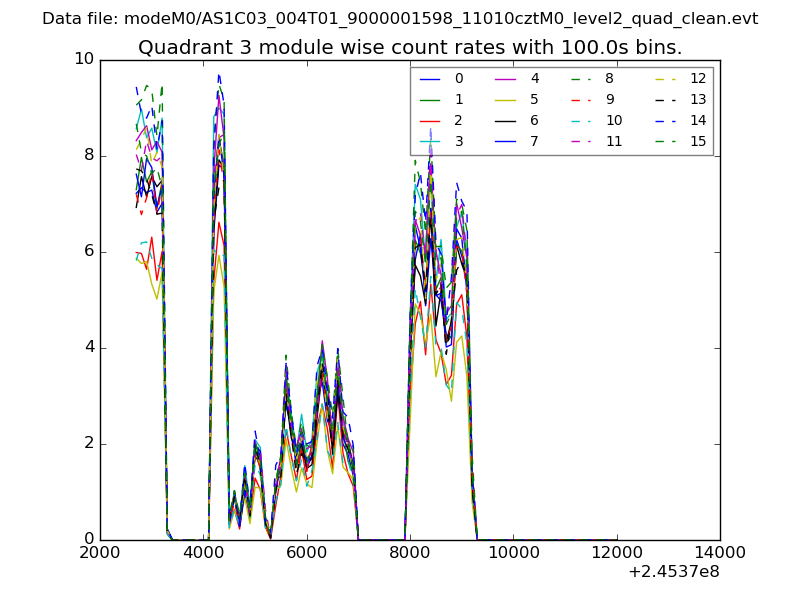
| Module-wise count rates for Quadrant C Data is divided into 100 sec bins |
 |
 |
| Module-wise count rates for Quadrant D Data is divided into 100 sec bins |
 |
 |
| Parameter | Plot |
|---|---|
| CZT HV Monitor | 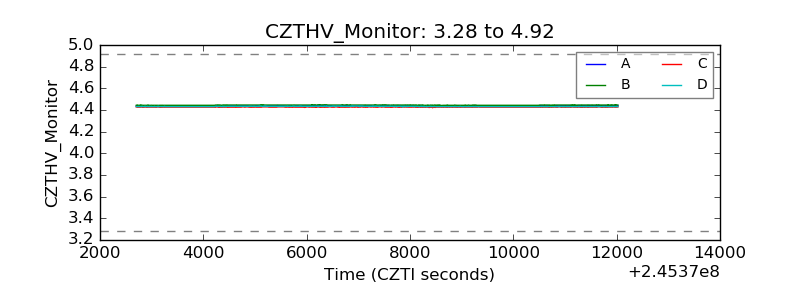 |
| D_VDD | 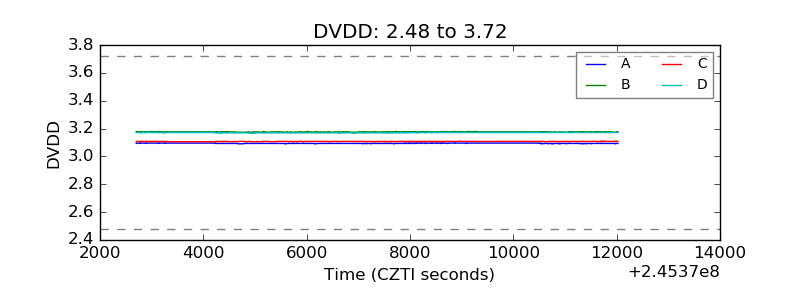 |
| Temperature 1 | 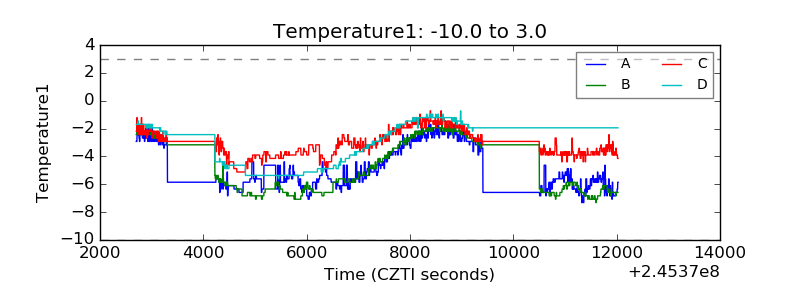 |
| Veto HV Monitor | 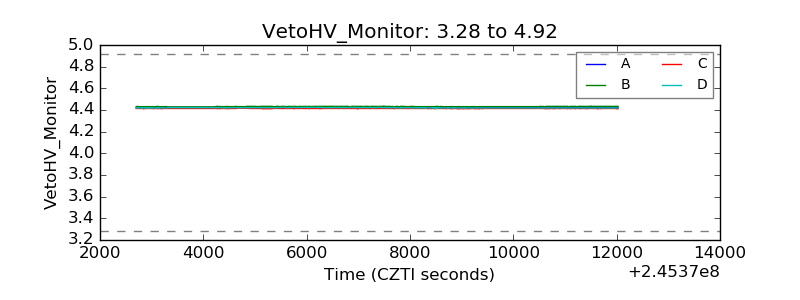 |
| Veto LLD | 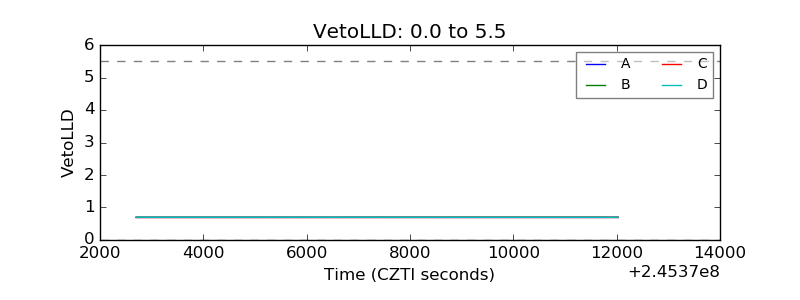 |
| Alpha Counter | 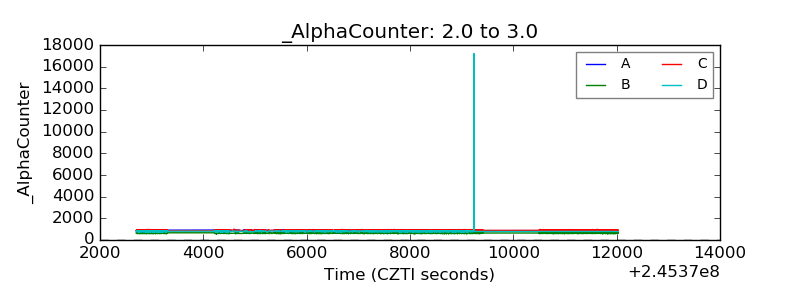 |
| _CPM_Rate | 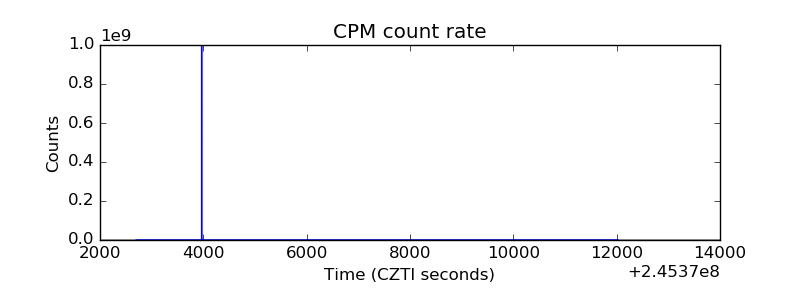 |
| CZT Counter | 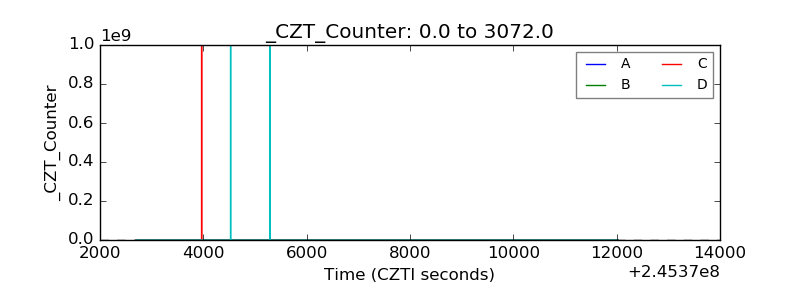 |
| +2.5 Volts monitor | 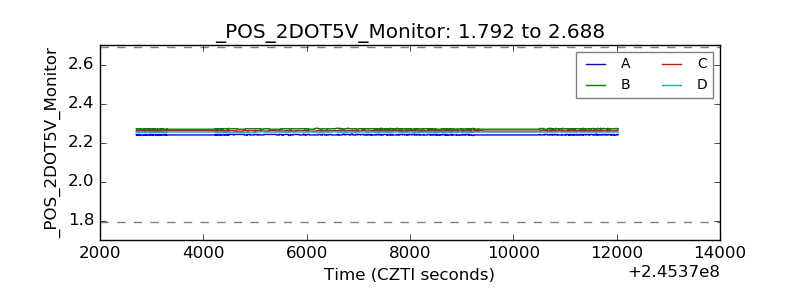 |
| +5 Volts monitor |  |
| _ROLL_ROT | 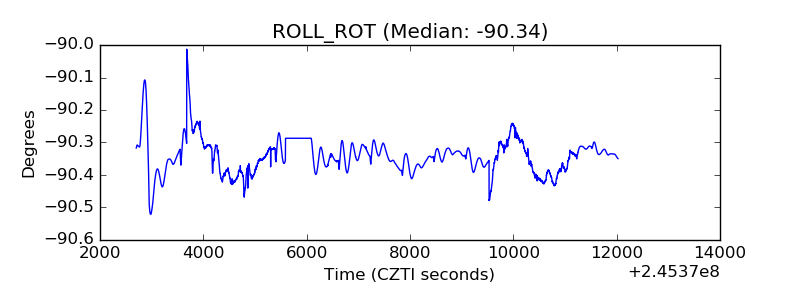 |
| _Roll_DEC | 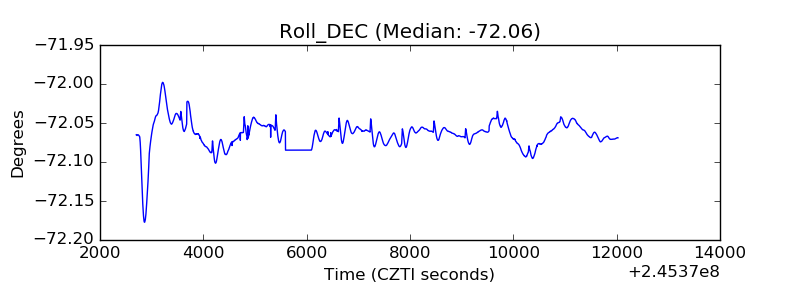 |
| _Roll_RA | 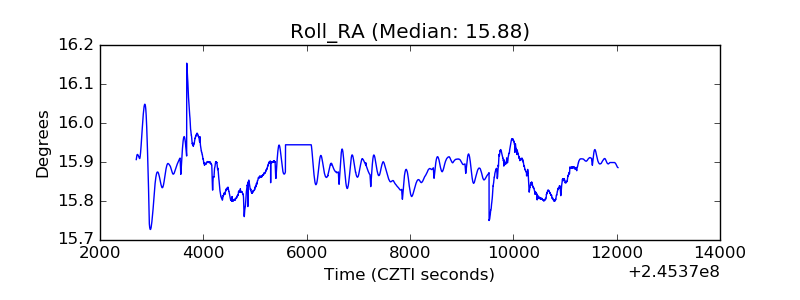 |
| Veto Counter | 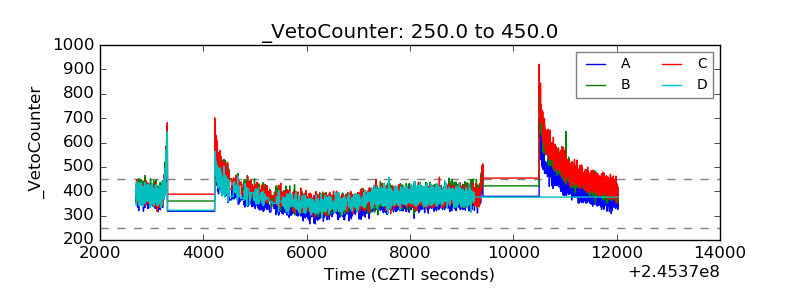 |