| Param | Original file | Final file |
|---|---|---|
| Filename | modeM0/AS1C03_004T01_9000001598_11012cztM0_level2.evt | modeM0/AS1C03_004T01_9000001598_11012cztM0_level2_quad_clean.evt |
| Size (bytes) | 682,871,040 | 104,454,720 |
| Size | 651.2 MB | 99.6 MB |
| Events in quadrant A | 9,073,714 | 565,893 |
| Events in quadrant B | 3,945,760 | 727,506 |
| Events in quadrant C | 3,003,828 | 734,626 |
| Events in quadrant D | 4,222,799 | 686,029 |
| Mode M9 | |||
|---|---|---|---|
| Quadrant | BADHDUFLAG | Total packets | Discarded packets |
| A | 0 | 14 | 0 |
| B | 0 | 14 | 0 |
| C | 0 | 14 | 0 |
| D | 0 | 15 | 0 |
| Mode M0 | |||
|---|---|---|---|
| Quadrant | BADHDUFLAG | Total packets | Discarded packets |
| A | 0 | 31466 | 65 |
| B | 0 | 15866 | 20 |
| C | 0 | 13162 | 10 |
| D | 0 | 16931 | 20 |
| Mode SS | |||
|---|---|---|---|
| Quadrant | BADHDUFLAG | Total packets | Discarded packets |
| A | 0 | 130 | 0 |
| B | 0 | 130 | 0 |
| C | 0 | 130 | 0 |
| D | 0 | 130 | 0 |
| Quadrant | Total seconds | Saturated seconds | Saturation percentage |
|---|---|---|---|
| A | 6424 | 2197 | 34.199875% |
| B | 6431 | 250 | 3.887420% |
| C | 6431 | 17 | 0.264345% |
| D | 6430 | 70 | 1.088647% |
Noise dominated data is calculated using 1-second bins in cleaned event files. If a bin has >2000 counts, and if more than 50% of those come from <1% of pixels, then it is considered to be noise-dominated and hence unusable.
| Quadrant | # 1 sec bins | Bins with >0 counts | Bins with >2000 counts | High rate bins dominated by noise | Noise dominated (total time) | Noise dominated (detector-on time) | Marked lightcurve |
|---|---|---|---|---|---|---|---|
| A | 7635 | 6434 | 1777 | 1777 | 23.27% | 27.62% | 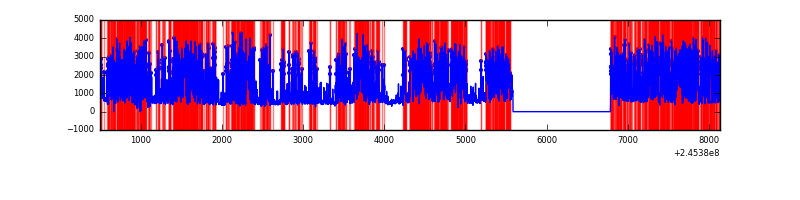 |
| B | 7635 | 6435 | 156 | 156 | 2.04% | 2.42% | 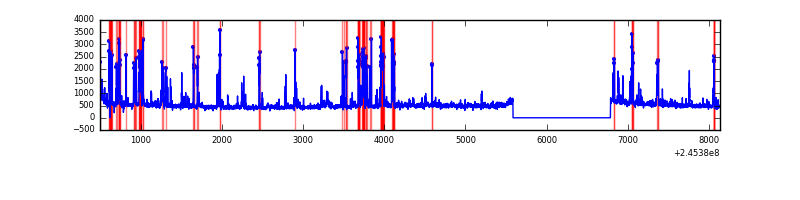 |
| C | 7635 | 6436 | 0 | 0 | 0.00% | 0.00% | 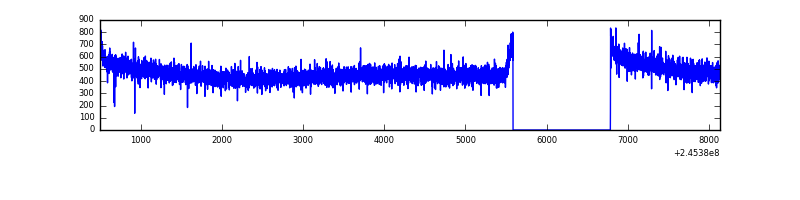 |
| D | 7635 | 6436 | 34 | 34 | 0.45% | 0.53% | 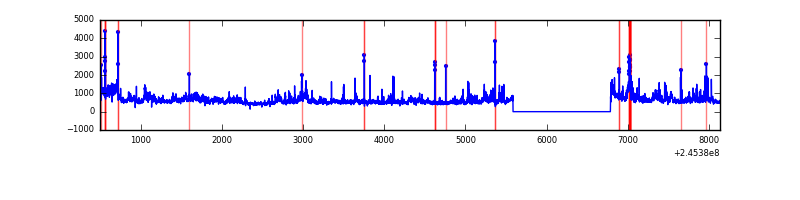 |
Top three noisy pixels from each quadrant. If the there are fewer than three noisy pixels in the level2.evt file, extra rows are filled as -1
| Pixel properties | Quadrant properties | ||||||
|---|---|---|---|---|---|---|---|
| Quadrant | DetID | PixID | Counts | Sigma | Mean | Median | Sigma |
| A | 14 | 238 | 6224113 | 47520.48 | 646 | 633 | 131.0 |
| A | 8 | 5 | 302071 | 2301.68 | 646 | 633 | 131.0 |
| A | 13 | 210 | 14591 | 106.58 | 646 | 633 | 131.0 |
| B | 4 | 239 | 822189 | 5747.09 | 771 | 752 | 142.9 |
| B | 15 | 204 | 29136 | 198.59 | 771 | 752 | 142.9 |
| B | 0 | 187 | 26197 | 178.02 | 771 | 752 | 142.9 |
| C | 13 | 61 | 5747 | 28.4 | 769 | 776 | 175.0 |
| C | 3 | 202 | 1961 | 6.77 | 769 | 776 | 175.0 |
| C | 14 | 234 | 1859 | 6.19 | 769 | 776 | 175.0 |
| D | 11 | 129 | 789000 | 4377.82 | 753 | 732 | 180.1 |
| D | 1 | 52 | 299632 | 1660.0 | 753 | 732 | 180.1 |
| D | 5 | 223 | 70780 | 389.02 | 753 | 732 | 180.1 |
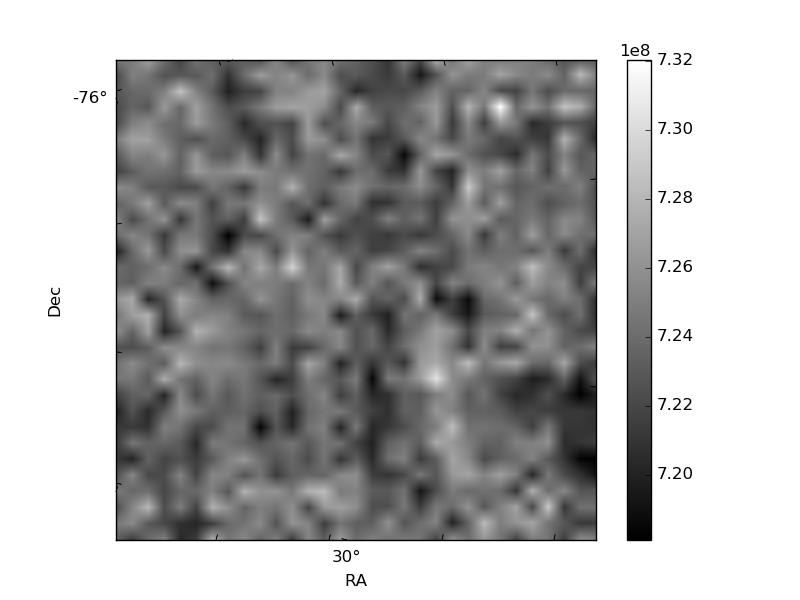
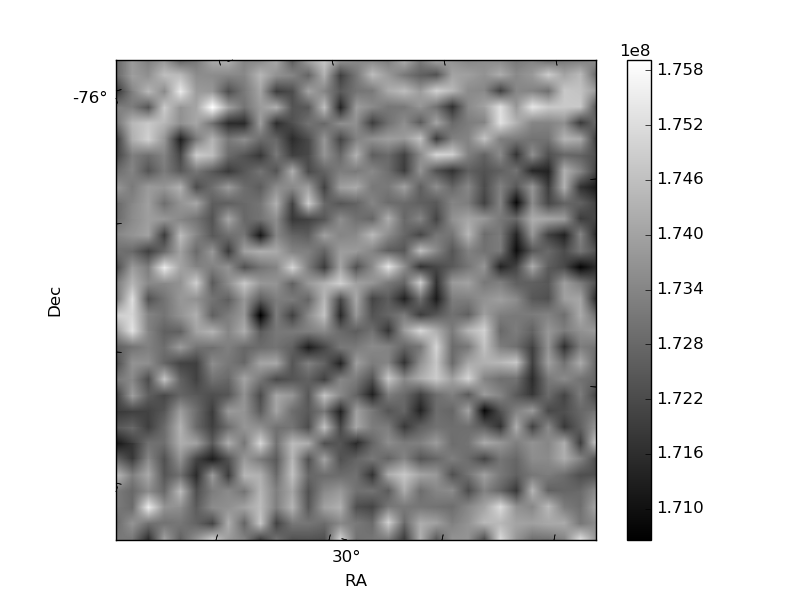
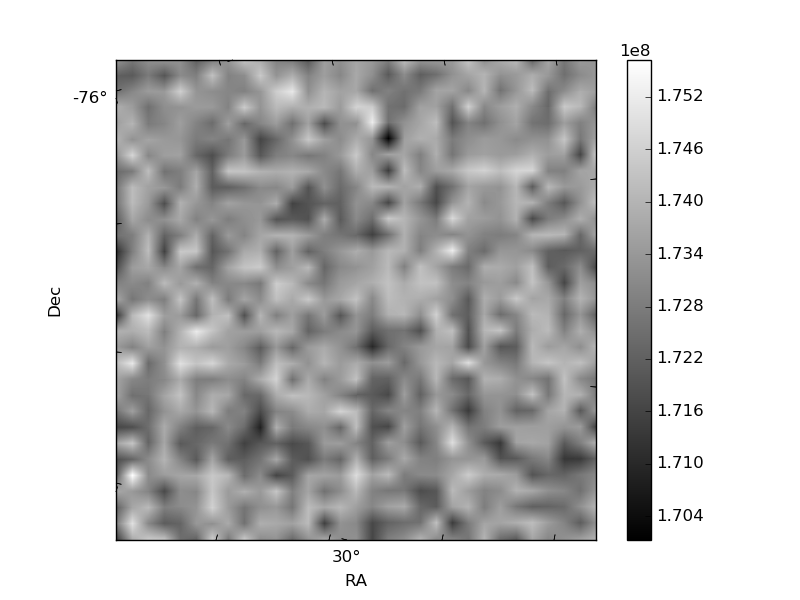
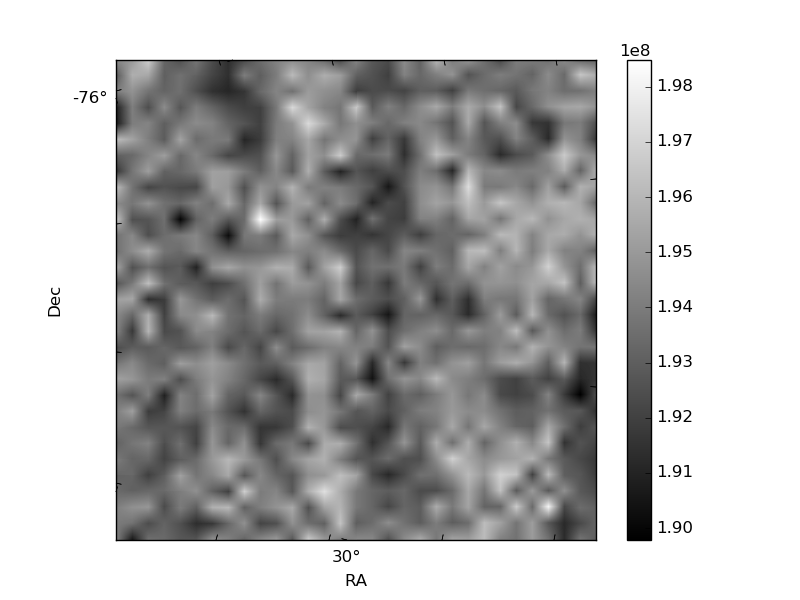
Histogram calculated using DETX and DETY for each event in the final _common_clean file
| Quadrant A | 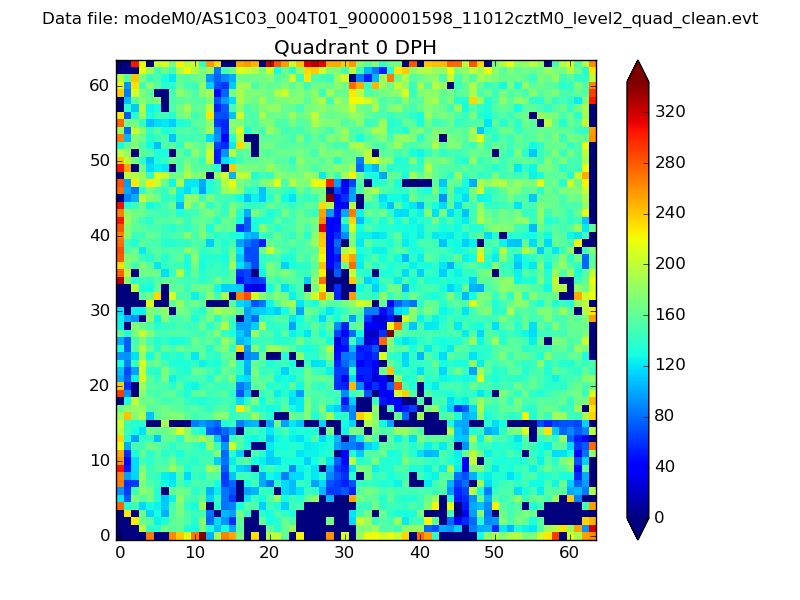 |
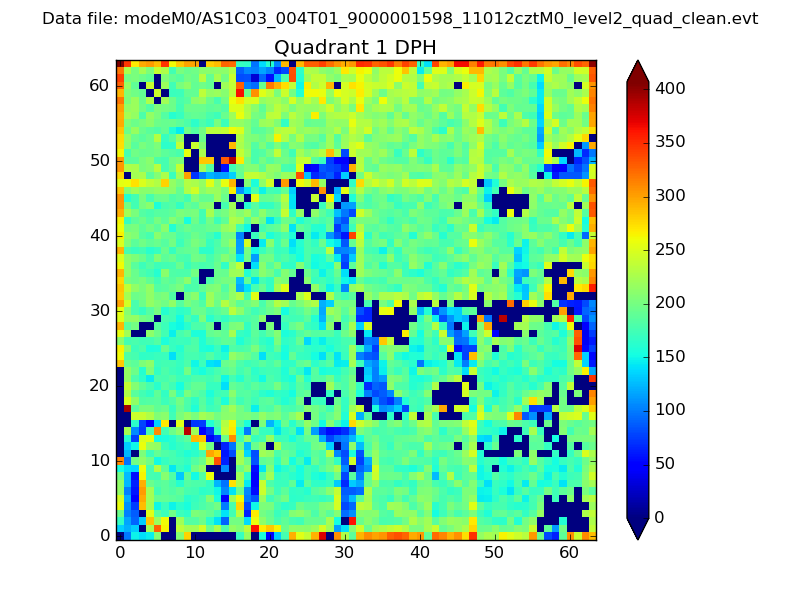 |
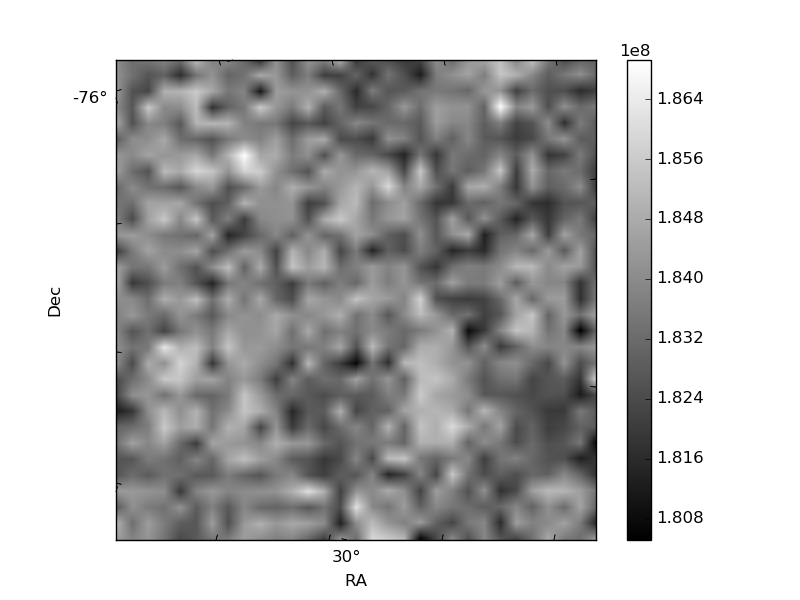
Quadrant B |
|---|---|---|---|
| Quadrant D | 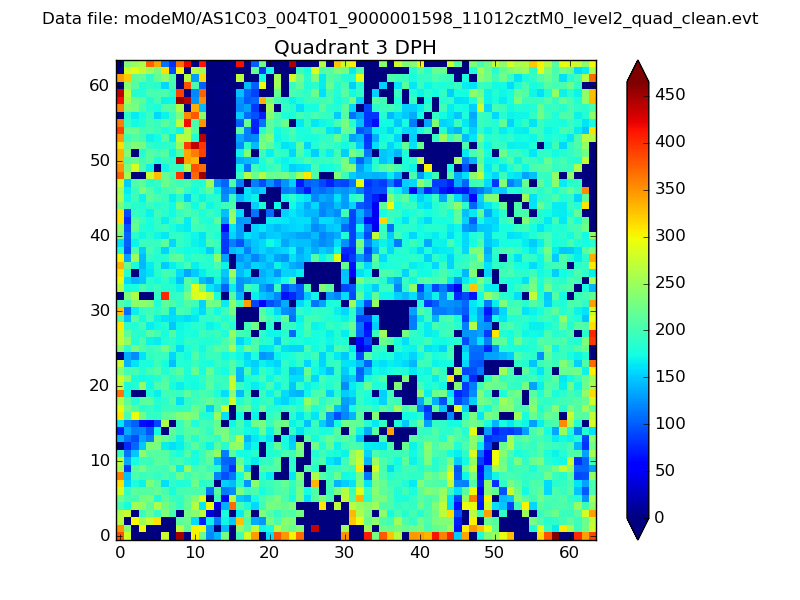 |
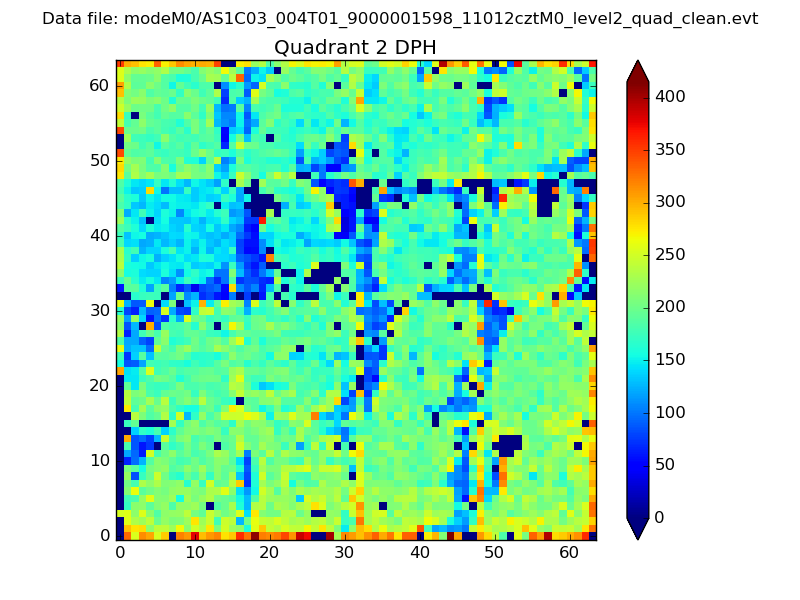 |
Quadrant C |
| Plot type | Count rate plots | Images |
|---|---|---|
| Comparison with Poisson distribution Blue bars denote a histogram of data divided into 1 sec bins. Red curve is a Poisson curve with rate = median count rate of data. |
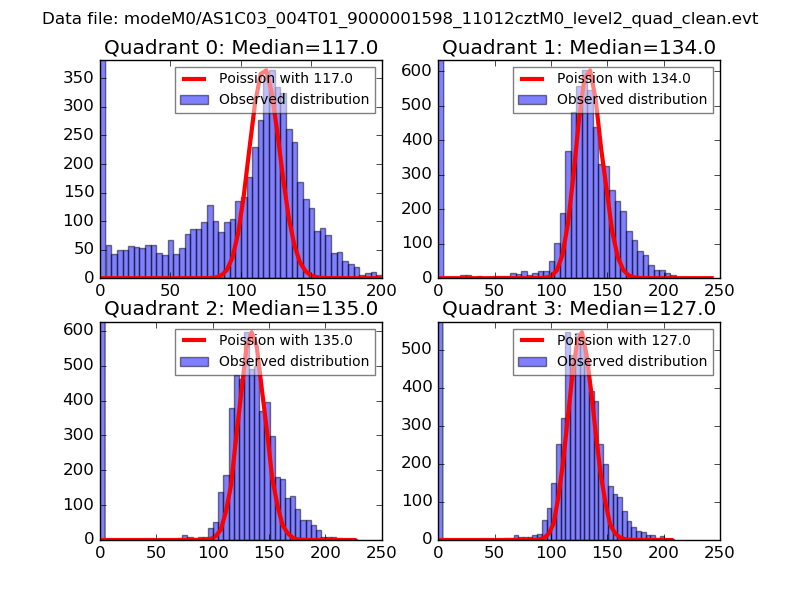 |
 |
| Quadrant-wise count rates Data is divided into 100 sec bins |
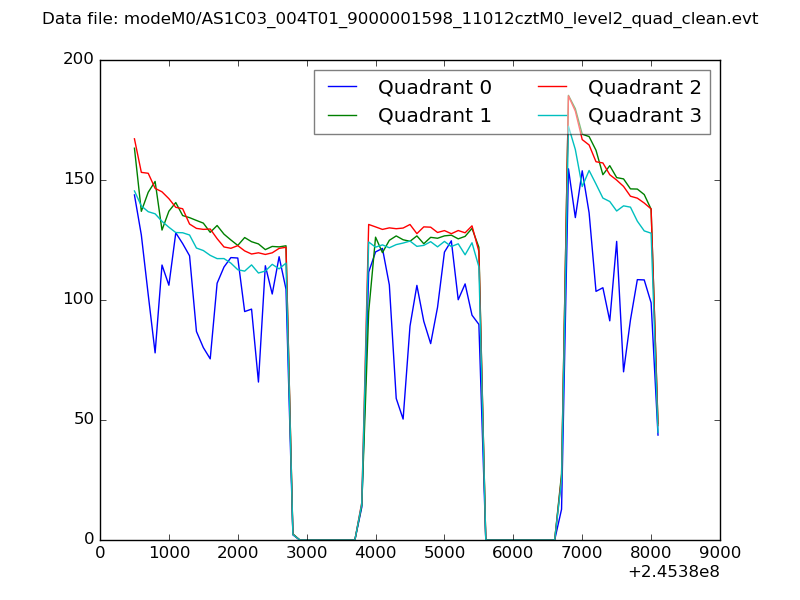 |
|
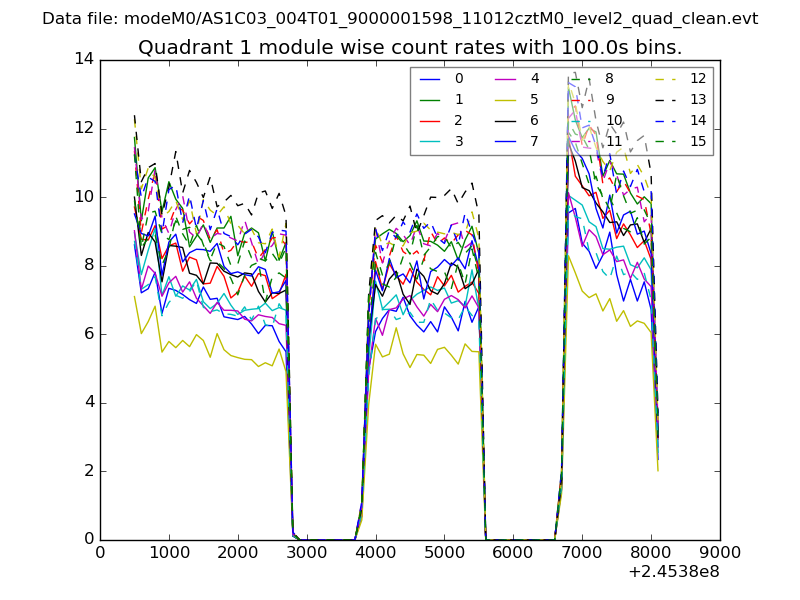
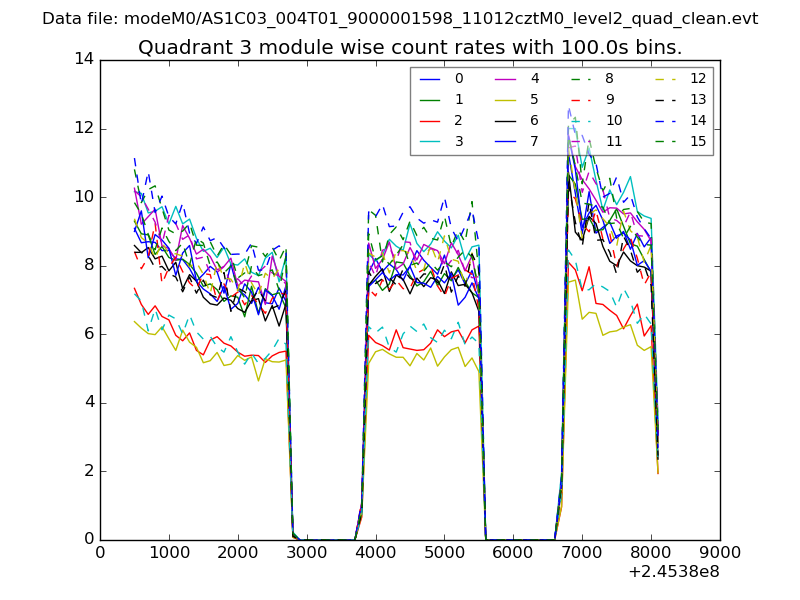
| Module-wise count rates for Quadrant A Data is divided into 100 sec bins |
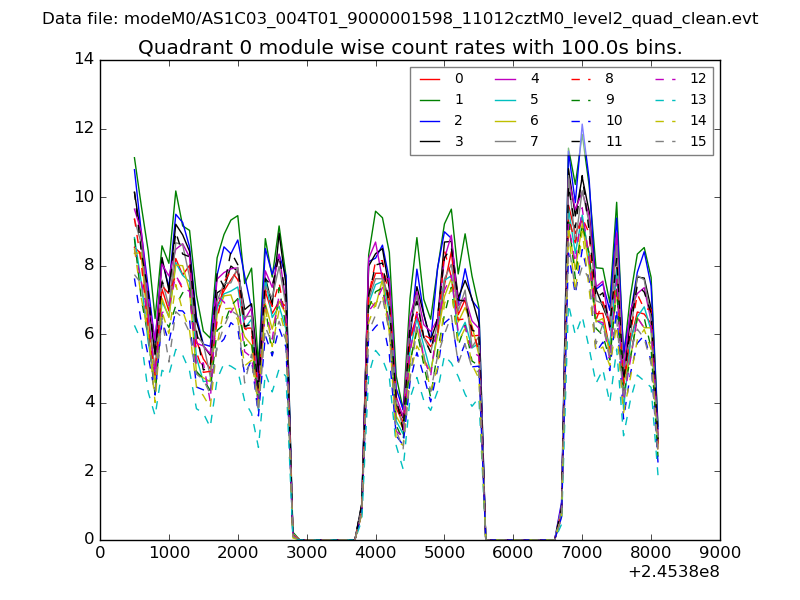 |
 |
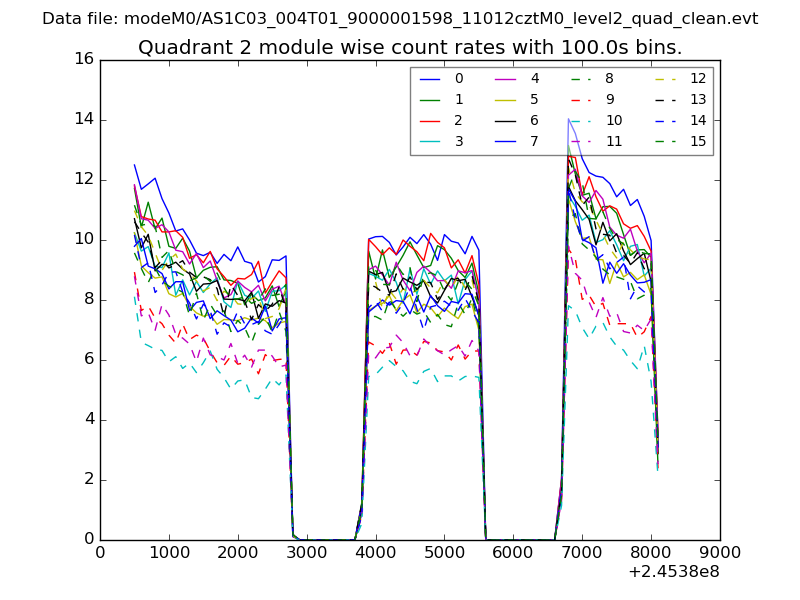
| Module-wise count rates for Quadrant B Data is divided into 100 sec bins |
 |
 |
| Module-wise count rates for Quadrant C Data is divided into 100 sec bins |
 |
 |
| Module-wise count rates for Quadrant D Data is divided into 100 sec bins |
 |
 |
| Parameter | Plot |
|---|---|
| CZT HV Monitor | 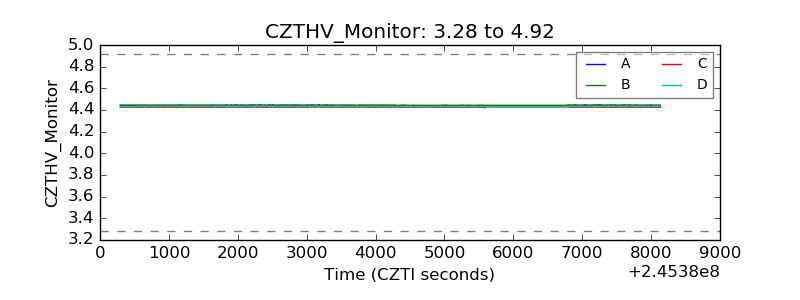 |
| D_VDD | 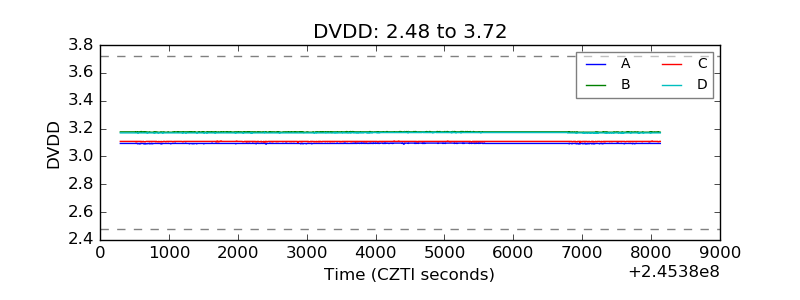 |
| Temperature 1 | 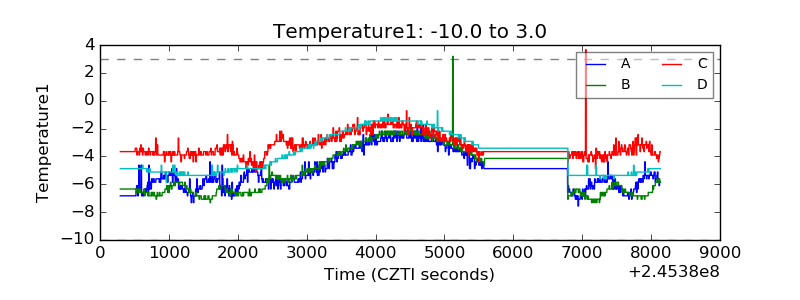 |
| Veto HV Monitor | 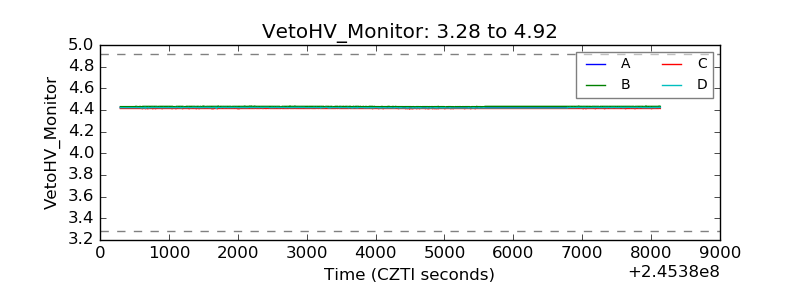 |
| Veto LLD | 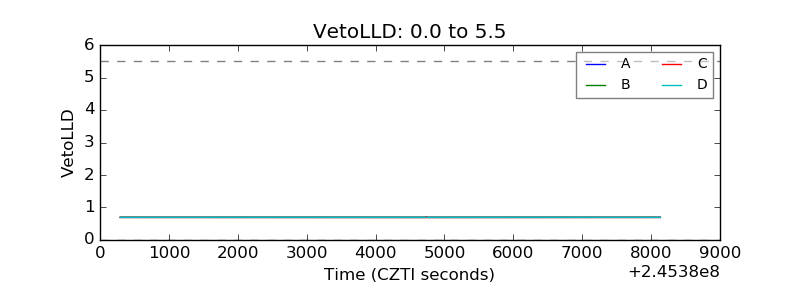 |
| Alpha Counter | 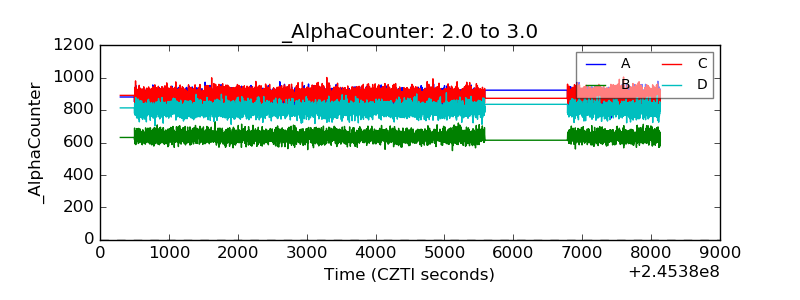 |
| _CPM_Rate | 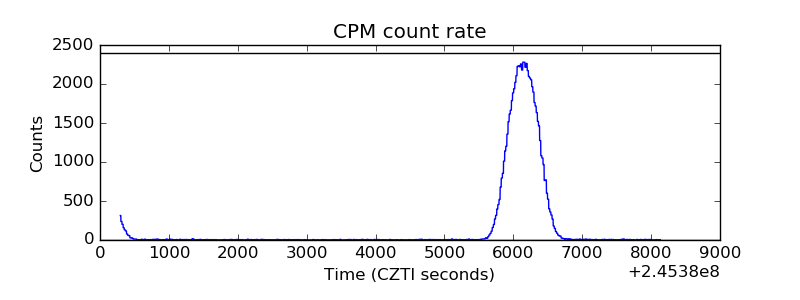 |
| CZT Counter | 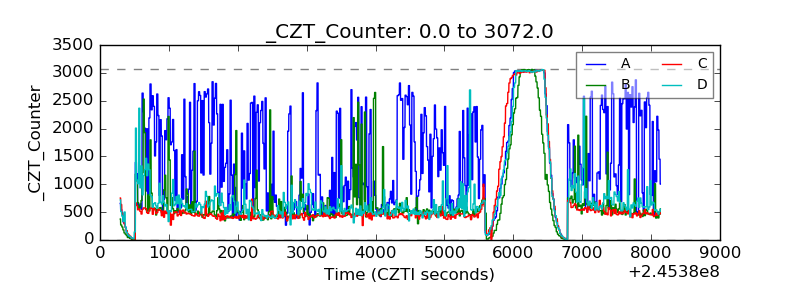 |
| +2.5 Volts monitor | 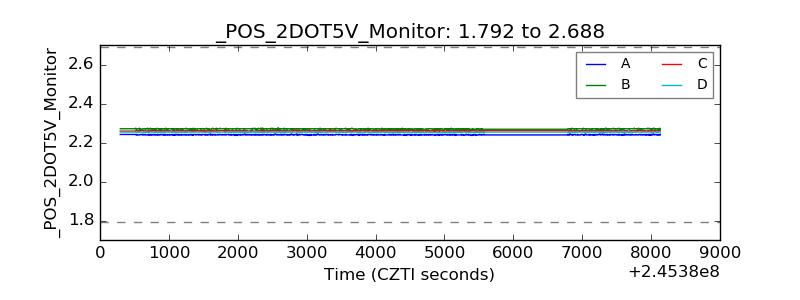 |
| +5 Volts monitor |  |
| _ROLL_ROT | 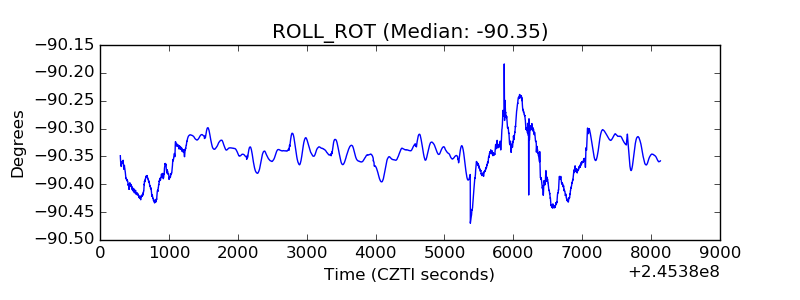 |
| _Roll_DEC | 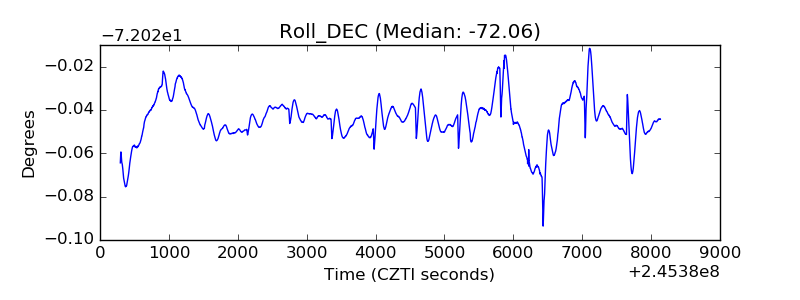 |
| _Roll_RA | 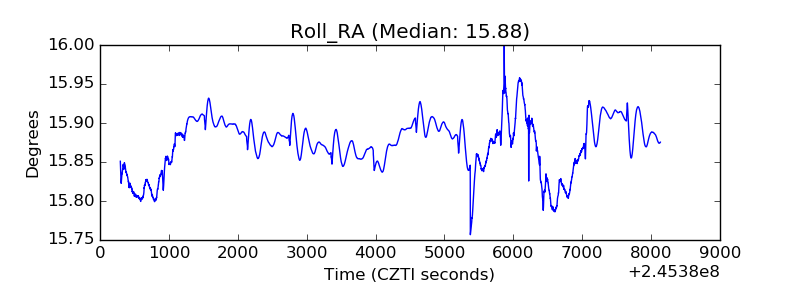 |
| Veto Counter | 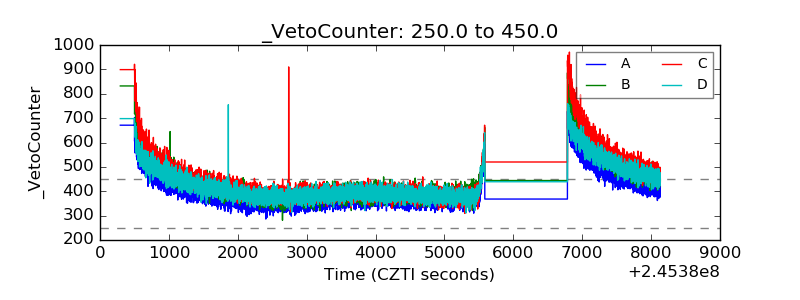 |