| Param | Original file | Final file |
|---|---|---|
| Filename | modeM0/AS1C03_004T01_9000001598_11013cztM0_level2.evt | modeM0/AS1C03_004T01_9000001598_11013cztM0_level2_quad_clean.evt |
| Size (bytes) | 706,219,200 | 102,553,920 |
| Size | 673.5 MB | 97.8 MB |
| Events in quadrant A | 9,487,990 | 548,558 |
| Events in quadrant B | 3,829,116 | 728,918 |
| Events in quadrant C | 2,955,182 | 736,024 |
| Events in quadrant D | 4,705,016 | 666,951 |
| Mode M9 | |||
|---|---|---|---|
| Quadrant | BADHDUFLAG | Total packets | Discarded packets |
| A | 0 | 13 | 0 |
| B | 0 | 13 | 0 |
| C | 0 | 13 | 0 |
| D | 0 | 13 | 0 |
| Mode M0 | |||
|---|---|---|---|
| Quadrant | BADHDUFLAG | Total packets | Discarded packets |
| A | 0 | 32473 | 2 |
| B | 0 | 15240 | 1 |
| C | 0 | 12607 | 1 |
| D | 0 | 18165 | 1 |
| Mode SS | |||
|---|---|---|---|
| Quadrant | BADHDUFLAG | Total packets | Discarded packets |
| A | 0 | 124 | 0 |
| B | 0 | 124 | 0 |
| C | 0 | 124 | 0 |
| D | 0 | 124 | 0 |
| Quadrant | Total seconds | Saturated seconds | Saturation percentage |
|---|---|---|---|
| A | 6075 | 2419 | 39.818930% |
| B | 6075 | 219 | 3.604938% |
| C | 6075 | 11 | 0.181070% |
| D | 6075 | 278 | 4.576132% |
Noise dominated data is calculated using 1-second bins in cleaned event files. If a bin has >2000 counts, and if more than 50% of those come from <1% of pixels, then it is considered to be noise-dominated and hence unusable.
| Quadrant | # 1 sec bins | Bins with >0 counts | Bins with >2000 counts | High rate bins dominated by noise | Noise dominated (total time) | Noise dominated (detector-on time) | Marked lightcurve |
|---|---|---|---|---|---|---|---|
| A | 7360 | 6075 | 2026 | 2026 | 27.53% | 33.35% | 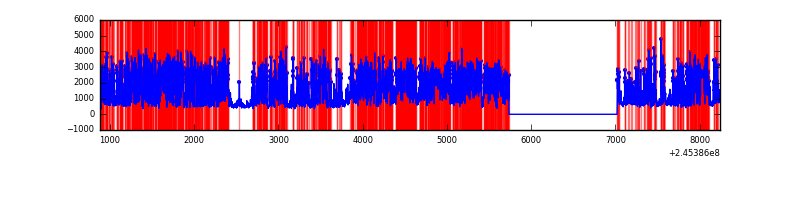 |
| B | 7360 | 6076 | 129 | 129 | 1.75% | 2.12% |  |
| C | 7360 | 6076 | 0 | 0 | 0.00% | 0.00% |  |
| D | 7360 | 6076 | 236 | 236 | 3.21% | 3.88% | 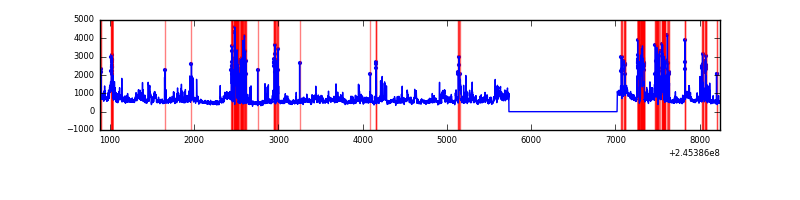 |
Top three noisy pixels from each quadrant. If the there are fewer than three noisy pixels in the level2.evt file, extra rows are filled as -1
| Pixel properties | Quadrant properties | ||||||
|---|---|---|---|---|---|---|---|
| Quadrant | DetID | PixID | Counts | Sigma | Mean | Median | Sigma |
| A | 14 | 238 | 6545874 | 53181.78 | 617 | 605 | 123.1 |
| A | 8 | 5 | 474860 | 3853.43 | 617 | 605 | 123.1 |
| A | 15 | 174 | 29433 | 234.23 | 617 | 605 | 123.1 |
| B | 4 | 239 | 759147 | 5517.74 | 756 | 740 | 137.4 |
| B | 15 | 204 | 39231 | 280.04 | 756 | 740 | 137.4 |
| B | 0 | 214 | 36021 | 256.68 | 756 | 740 | 137.4 |
| C | 13 | 61 | 5632 | 28.22 | 757 | 760 | 172.6 |
| C | 14 | 234 | 3344 | 14.97 | 757 | 760 | 172.6 |
| C | 3 | 202 | 1995 | 7.15 | 757 | 760 | 172.6 |
| D | 11 | 129 | 696136 | 4035.15 | 728 | 709 | 172.3 |
| D | 10 | 253 | 689693 | 3997.77 | 728 | 709 | 172.3 |
| D | 1 | 52 | 193534 | 1118.85 | 728 | 709 | 172.3 |
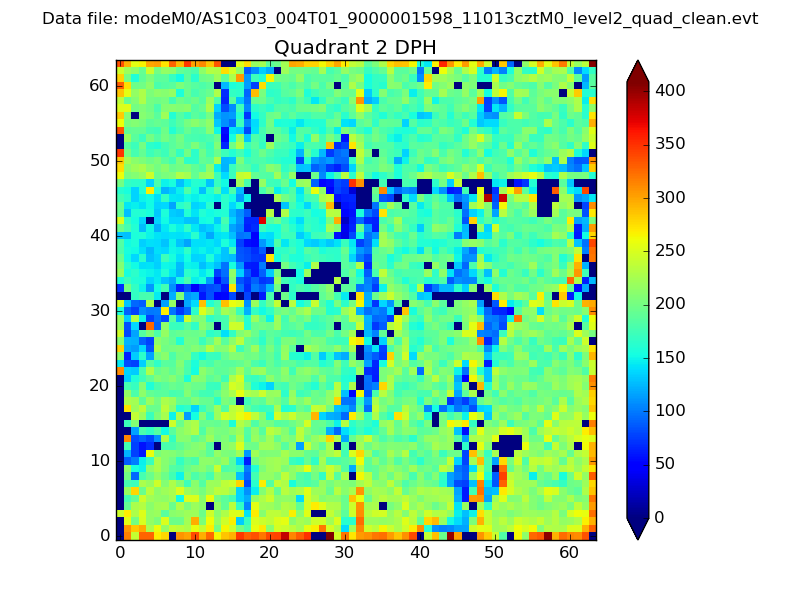
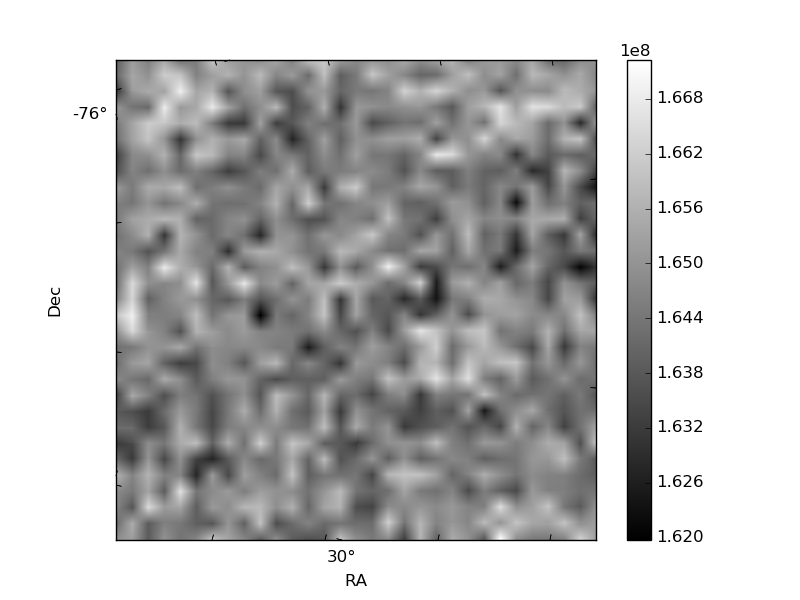
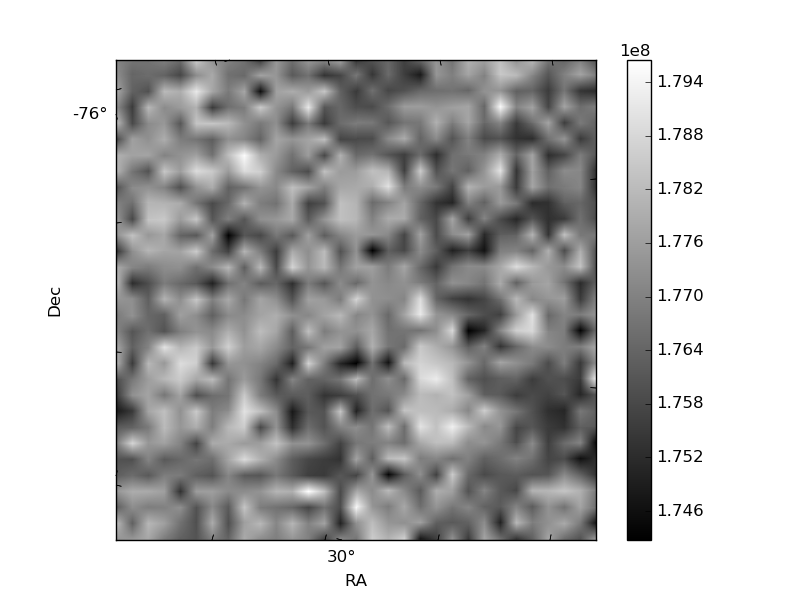
Histogram calculated using DETX and DETY for each event in the final _common_clean file
| Quadrant A | 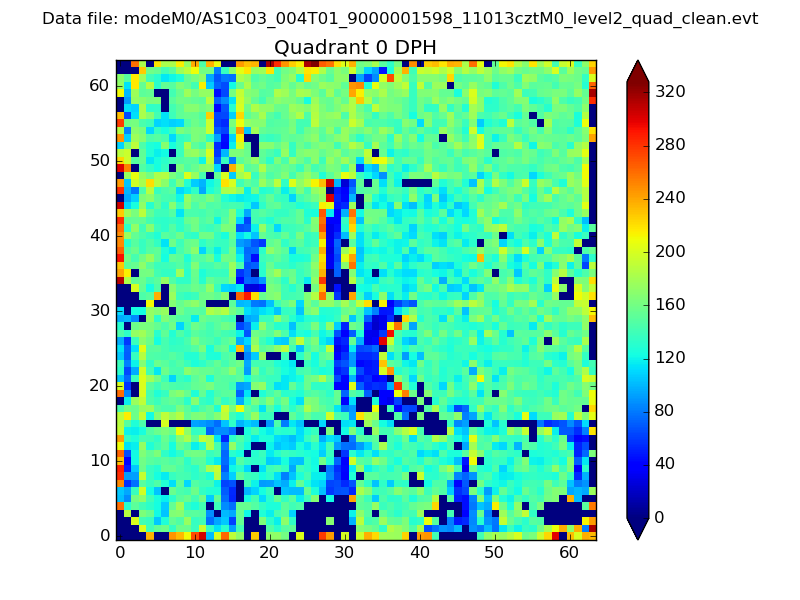 |
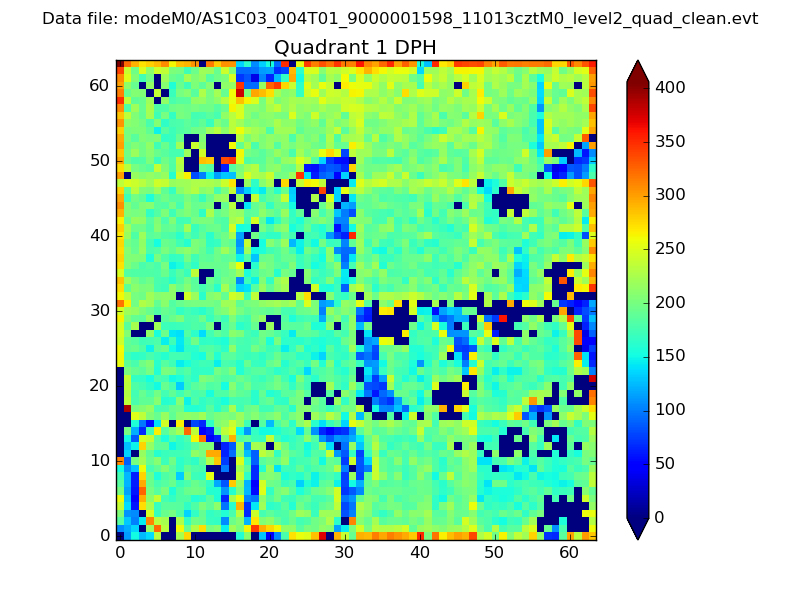 |
Quadrant B |
|---|---|---|---|
| Quadrant D | 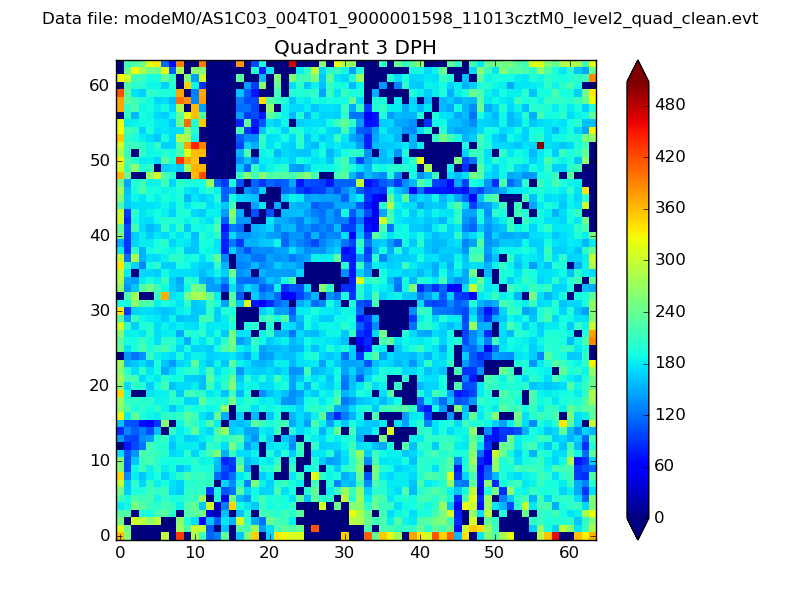 |
 |
Quadrant C |
| Plot type | Count rate plots | Images |
|---|---|---|
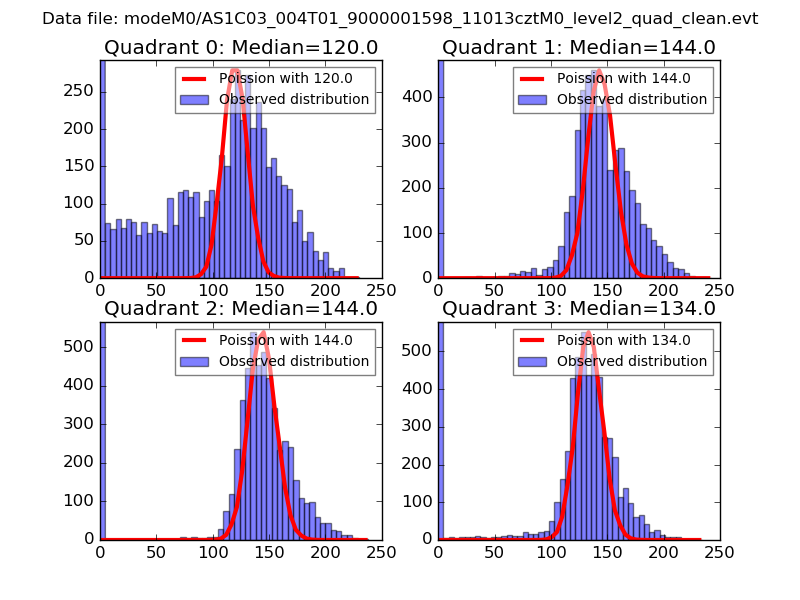
| Comparison with Poisson distribution Blue bars denote a histogram of data divided into 1 sec bins. Red curve is a Poisson curve with rate = median count rate of data. |
 |
 |
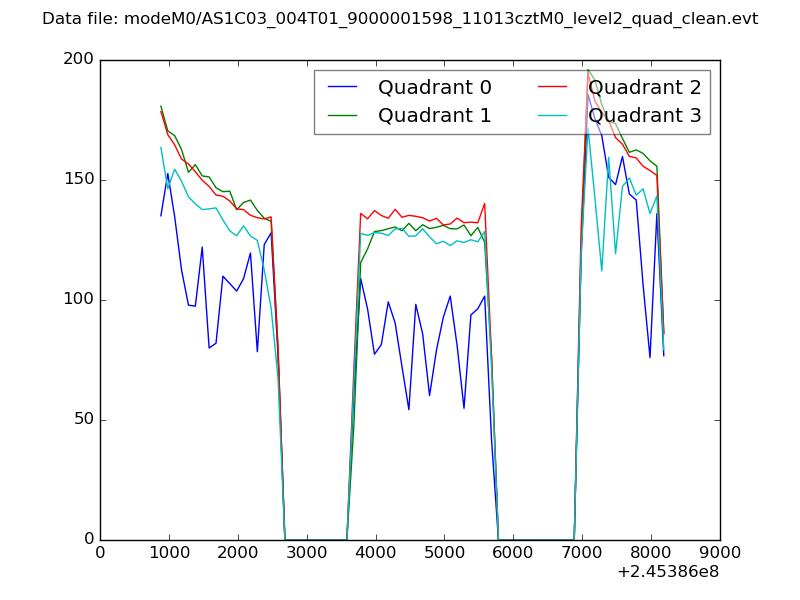
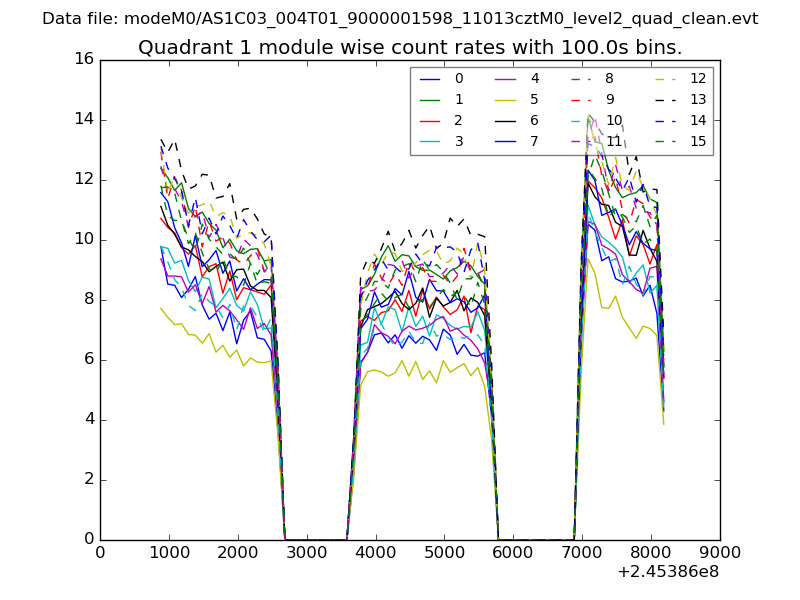
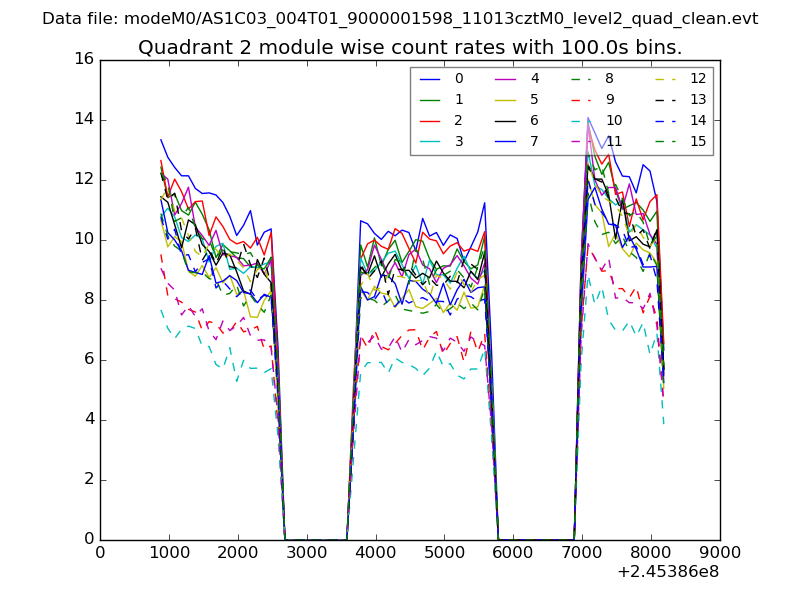
| Quadrant-wise count rates Data is divided into 100 sec bins |
 |
|
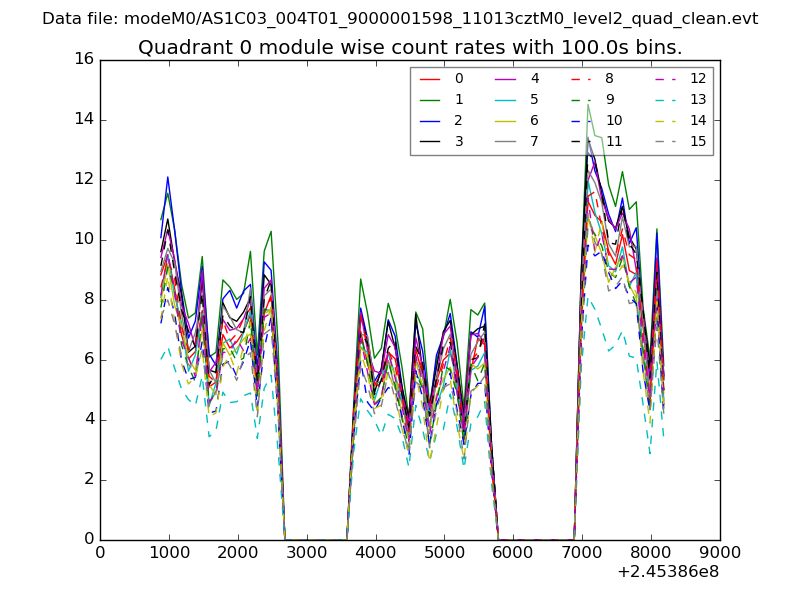
| Module-wise count rates for Quadrant A Data is divided into 100 sec bins |
 |
 |
| Module-wise count rates for Quadrant B Data is divided into 100 sec bins |
 |
 |
| Module-wise count rates for Quadrant C Data is divided into 100 sec bins |
 |
 |
| Module-wise count rates for Quadrant D Data is divided into 100 sec bins |
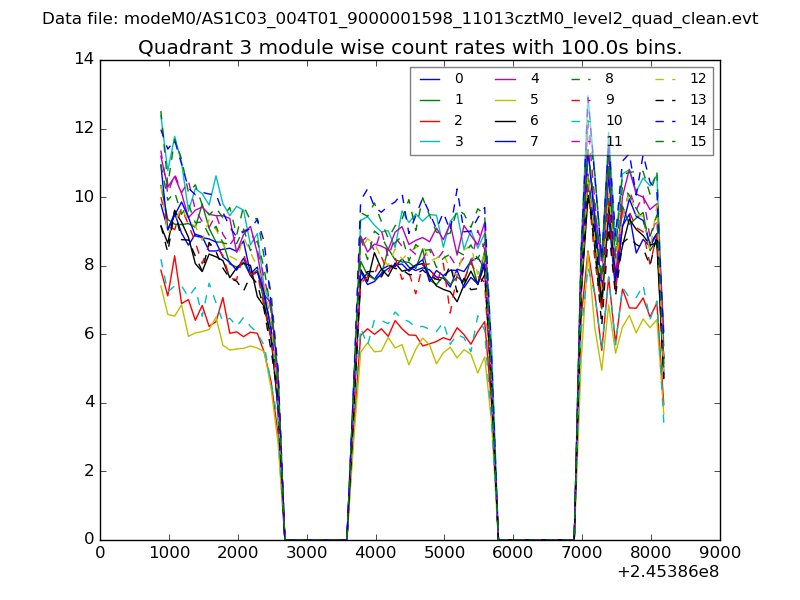 |
 |
| Parameter | Plot |
|---|---|
| CZT HV Monitor | 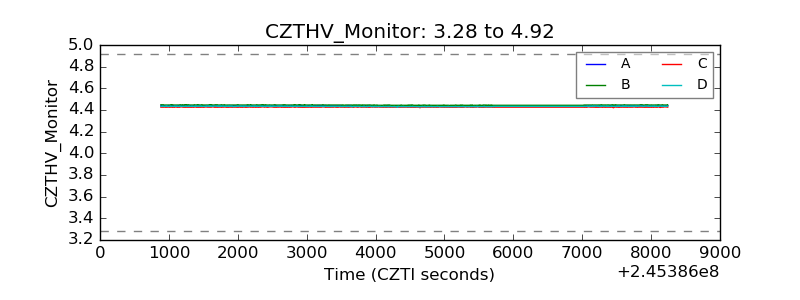 |
| D_VDD | 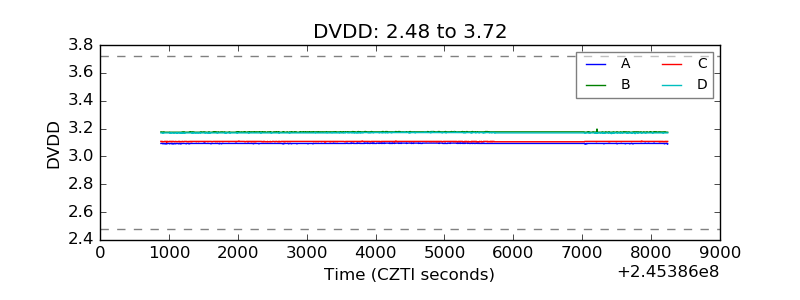 |
| Temperature 1 | 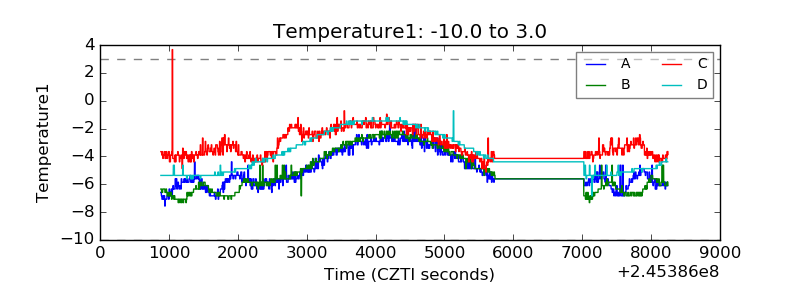 |
| Veto HV Monitor | 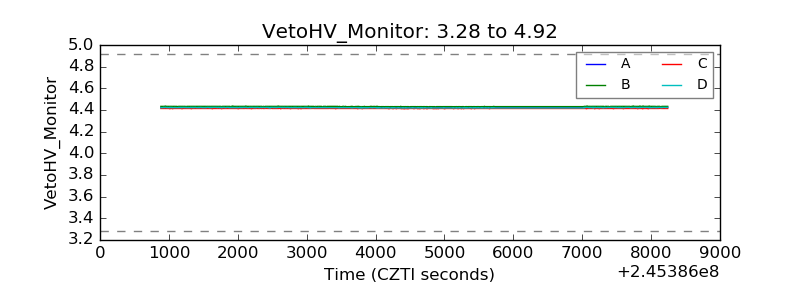 |
| Veto LLD | 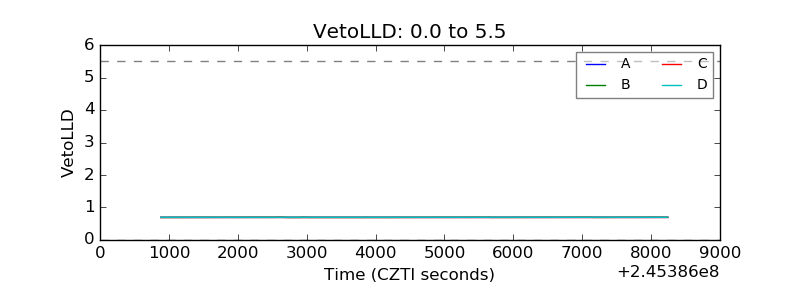 |
| Alpha Counter | 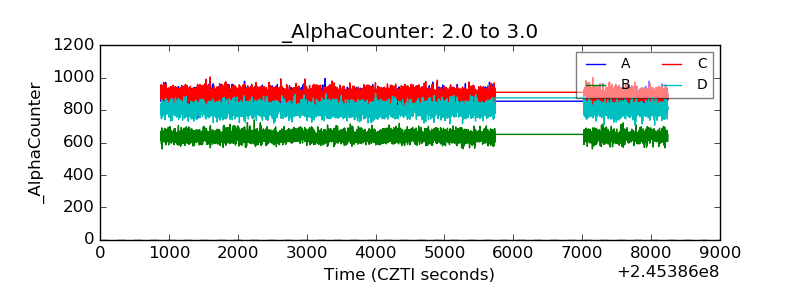 |
| _CPM_Rate | 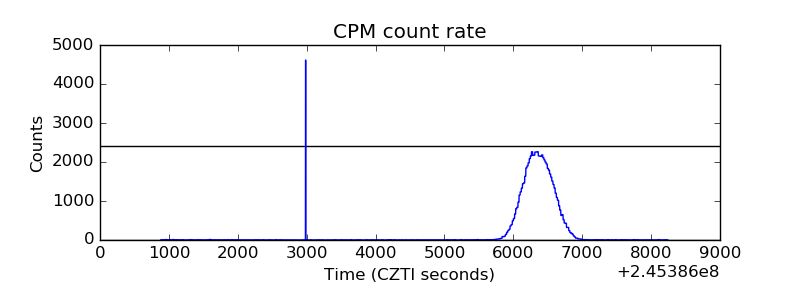 |
| CZT Counter | 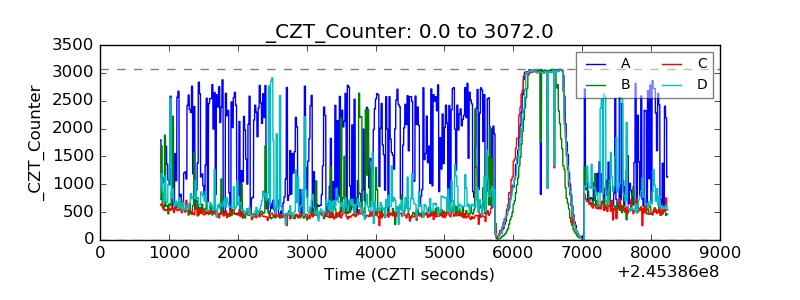 |
| +2.5 Volts monitor | 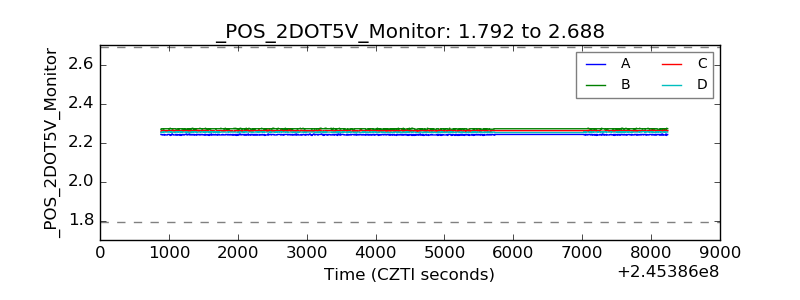 |
| +5 Volts monitor | 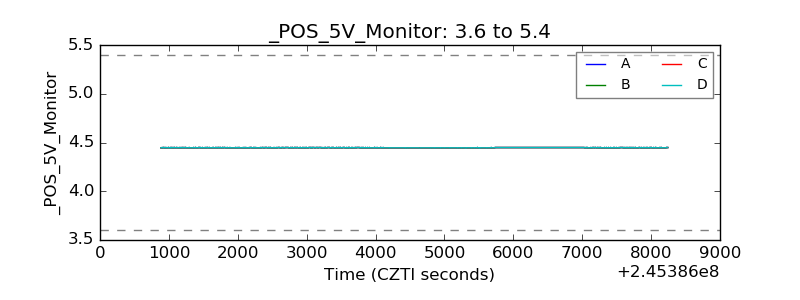 |
| _ROLL_ROT | 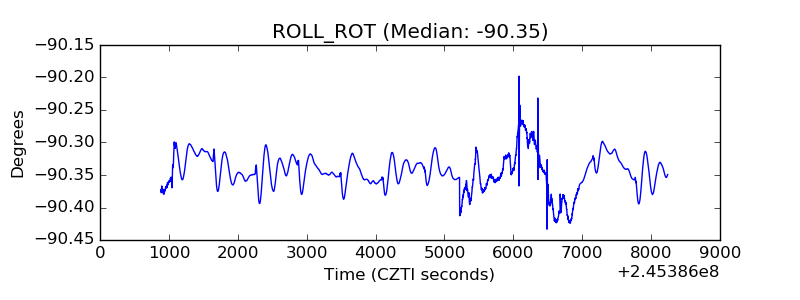 |
| _Roll_DEC | 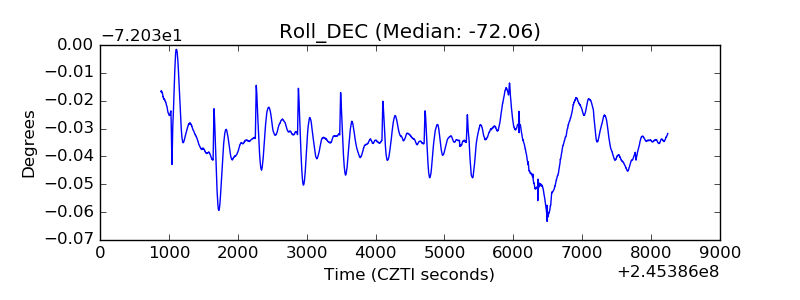 |
| _Roll_RA | 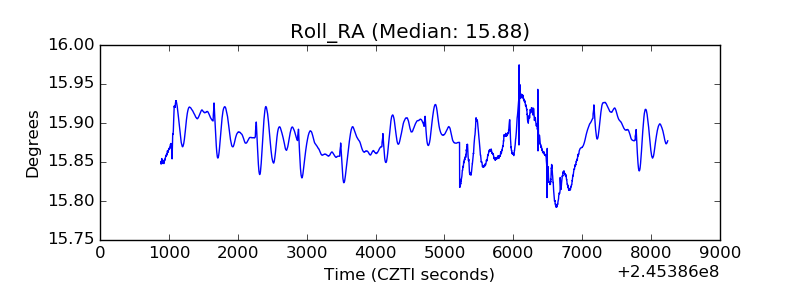 |
| Veto Counter | 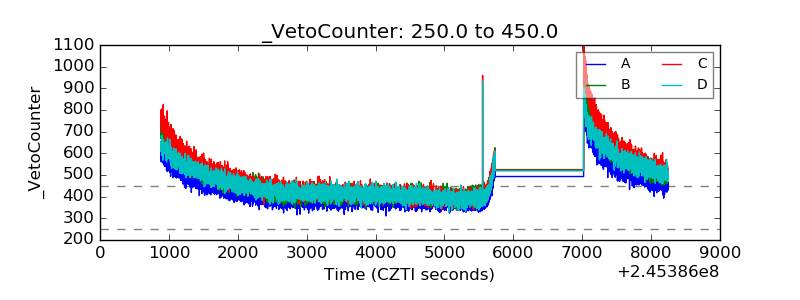 |