| Param | Original file | Final file |
|---|---|---|
| Filename | modeM0/AS1C03_004T01_9000001598_11015cztM0_level2.evt | modeM0/AS1C03_004T01_9000001598_11015cztM0_level2_quad_clean.evt |
| Size (bytes) | 334,592,640 | 51,082,560 |
| Size | 319.1 MB | 48.7 MB |
| Events in quadrant A | 3,975,445 | 292,622 |
| Events in quadrant B | 1,891,570 | 346,053 |
| Events in quadrant C | 1,640,565 | 350,568 |
| Events in quadrant D | 2,402,861 | 325,566 |
| Mode M9 | |||
|---|---|---|---|
| Quadrant | BADHDUFLAG | Total packets | Discarded packets |
| A | 0 | 4 | 1 |
| B | 0 | 4 | 0 |
| C | 0 | 4 | 0 |
| D | 0 | 5 | 0 |
| Mode M0 | |||
|---|---|---|---|
| Quadrant | BADHDUFLAG | Total packets | Discarded packets |
| A | 0 | 15330 | 1294 |
| B | 0 | 8093 | 451 |
| C | 0 | 7330 | 390 |
| D | 0 | 10105 | 718 |
| Mode SS | |||
|---|---|---|---|
| Quadrant | BADHDUFLAG | Total packets | Discarded packets |
| A | 0 | 70 | 6 |
| B | 0 | 70 | 8 |
| C | 0 | 70 | 2 |
| D | 0 | 70 | 4 |
| Quadrant | Total seconds | Saturated seconds | Saturation percentage |
|---|---|---|---|
| A | 3197 | 734 | 22.959024% |
| B | 3304 | 76 | 2.300242% |
| C | 3301 | 5 | 0.151469% |
| D | 3245 | 47 | 1.448382% |
Noise dominated data is calculated using 1-second bins in cleaned event files. If a bin has >2000 counts, and if more than 50% of those come from <1% of pixels, then it is considered to be noise-dominated and hence unusable.
| Quadrant | # 1 sec bins | Bins with >0 counts | Bins with >2000 counts | High rate bins dominated by noise | Noise dominated (total time) | Noise dominated (detector-on time) | Marked lightcurve |
|---|---|---|---|---|---|---|---|
| A | 3482 | 3410 | 564 | 564 | 16.20% | 16.54% | 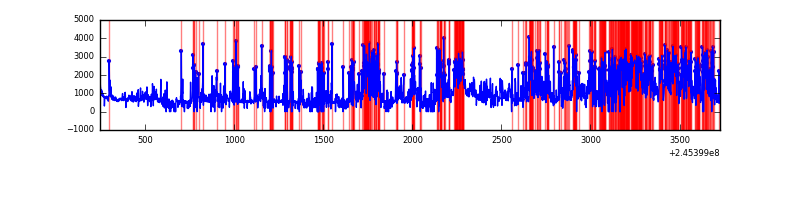 |
| B | 3482 | 3453 | 38 | 38 | 1.09% | 1.10% | 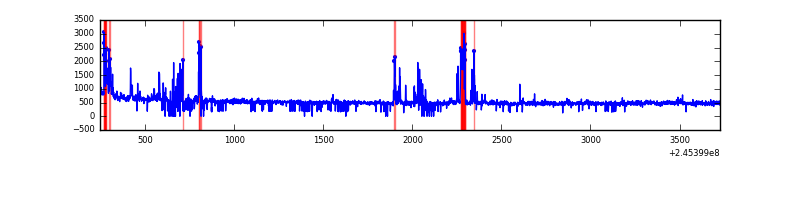 |
| C | 3482 | 3449 | 0 | 0 | 0.00% | 0.00% | 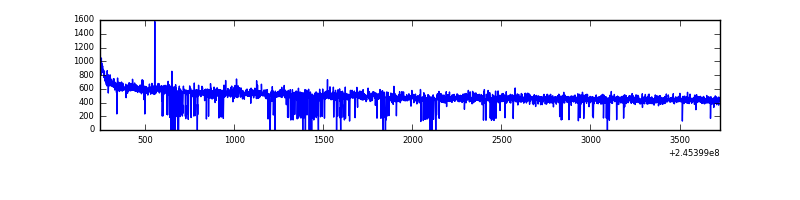 |
| D | 3482 | 3438 | 36 | 36 | 1.03% | 1.05% | 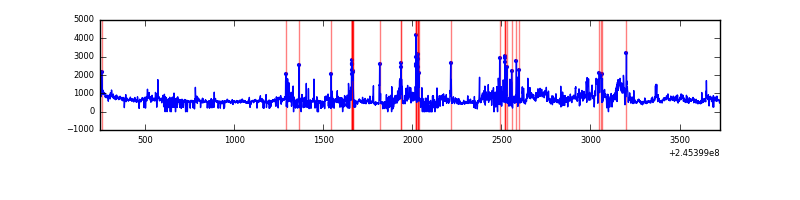 |
Top three noisy pixels from each quadrant. If the there are fewer than three noisy pixels in the level2.evt file, extra rows are filled as -1
| Pixel properties | Quadrant properties | ||||||
|---|---|---|---|---|---|---|---|
| Quadrant | DetID | PixID | Counts | Sigma | Mean | Median | Sigma |
| A | 14 | 238 | 2022034 | 27041.72 | 373 | 367 | 74.8 |
| A | 8 | 5 | 406997 | 5439.06 | 373 | 367 | 74.8 |
| A | 15 | 174 | 88617 | 1180.43 | 373 | 367 | 74.8 |
| B | 4 | 239 | 227161 | 2970.77 | 415 | 406 | 76.3 |
| B | 15 | 204 | 11072 | 139.74 | 415 | 406 | 76.3 |
| B | 0 | 214 | 10493 | 132.15 | 415 | 406 | 76.3 |
| C | 8 | 128 | 7594 | 75.64 | 416 | 419 | 94.9 |
| C | 8 | 112 | 5229 | 50.71 | 416 | 419 | 94.9 |
| C | 13 | 61 | 3058 | 27.82 | 416 | 419 | 94.9 |
| D | 1 | 52 | 377040 | 3931.63 | 404 | 393 | 95.8 |
| D | 11 | 129 | 264067 | 2752.36 | 404 | 393 | 95.8 |
| D | 8 | 195 | 58058 | 601.94 | 404 | 393 | 95.8 |
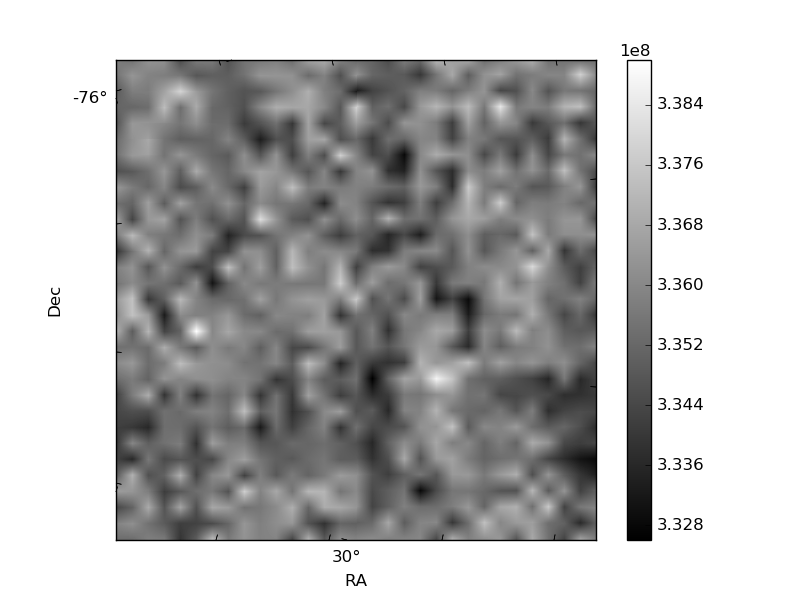
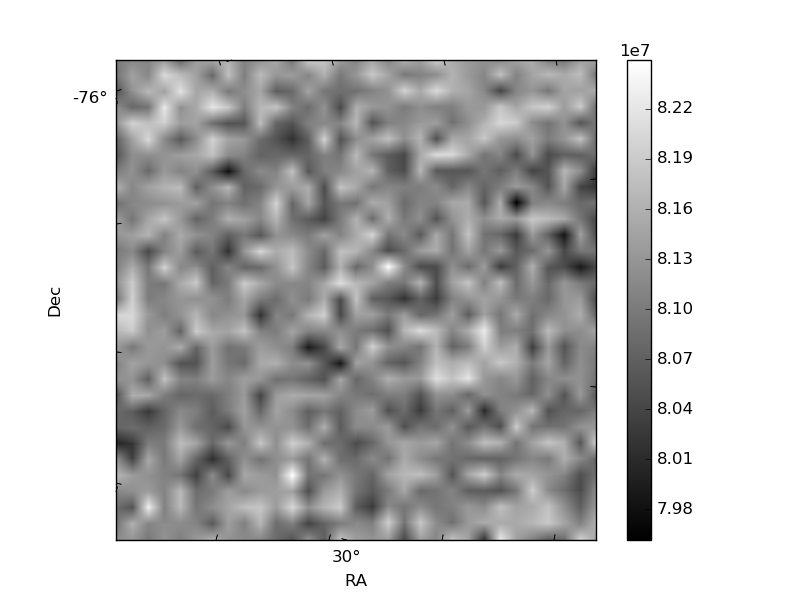
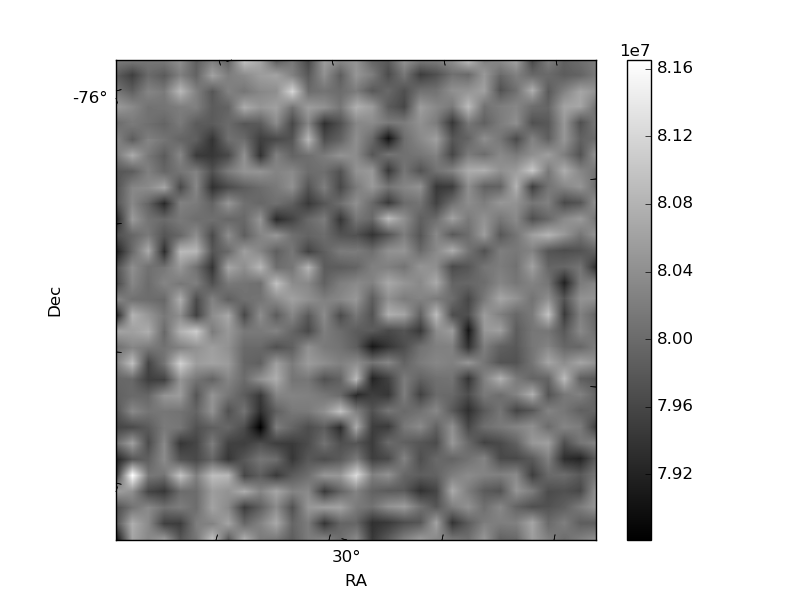
Histogram calculated using DETX and DETY for each event in the final _common_clean file
| Quadrant A | 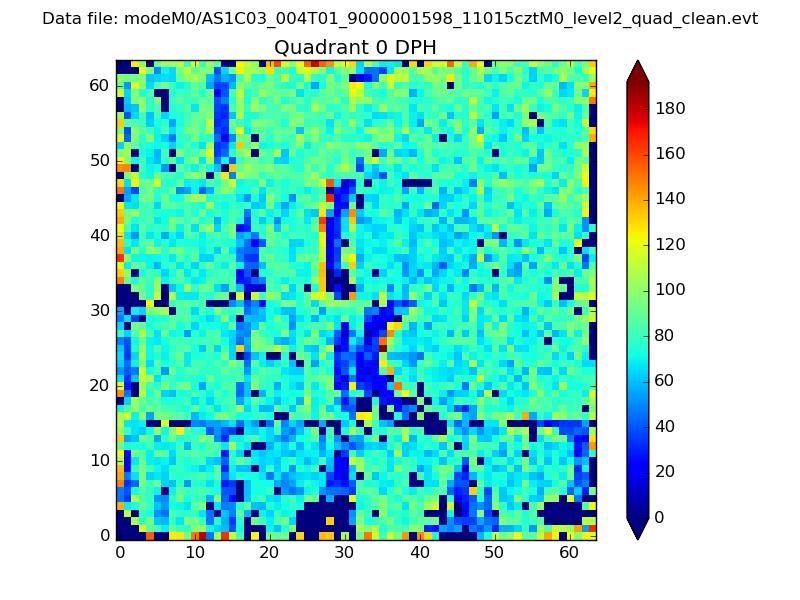 |
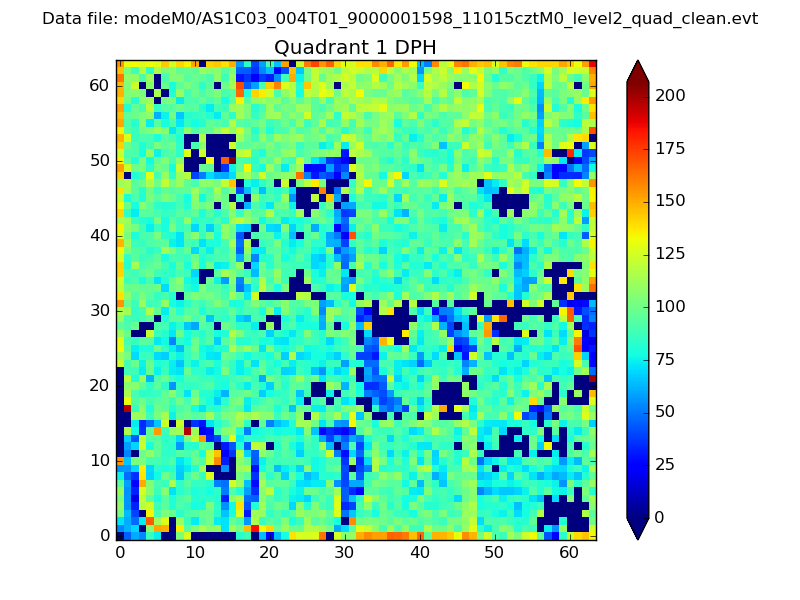 |
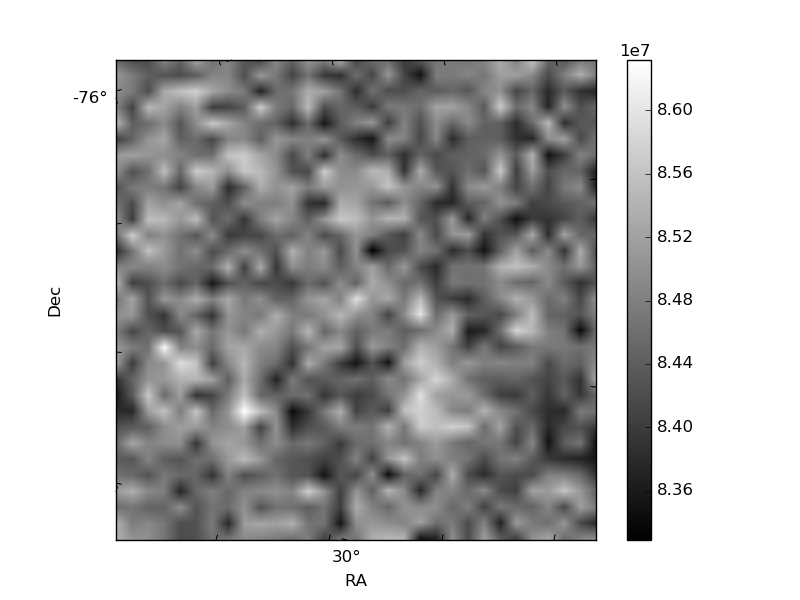
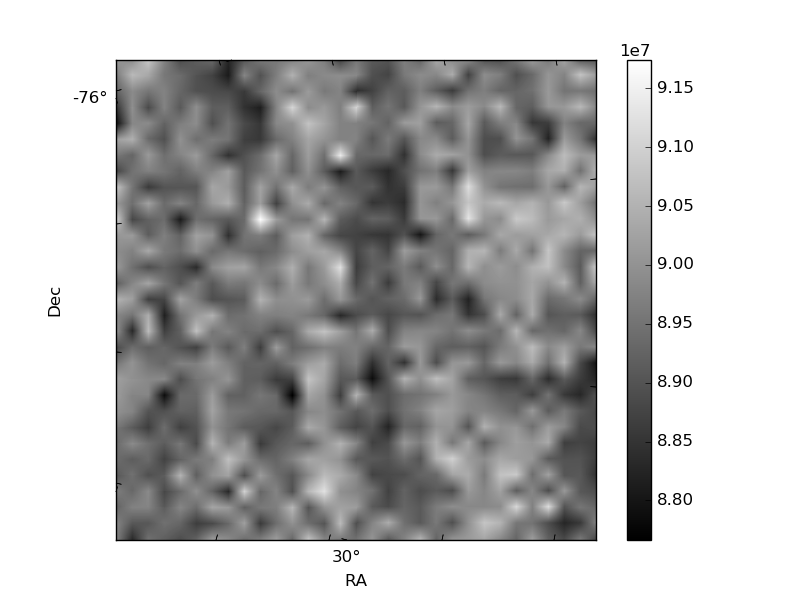
Quadrant B |
|---|---|---|---|
| Quadrant D | 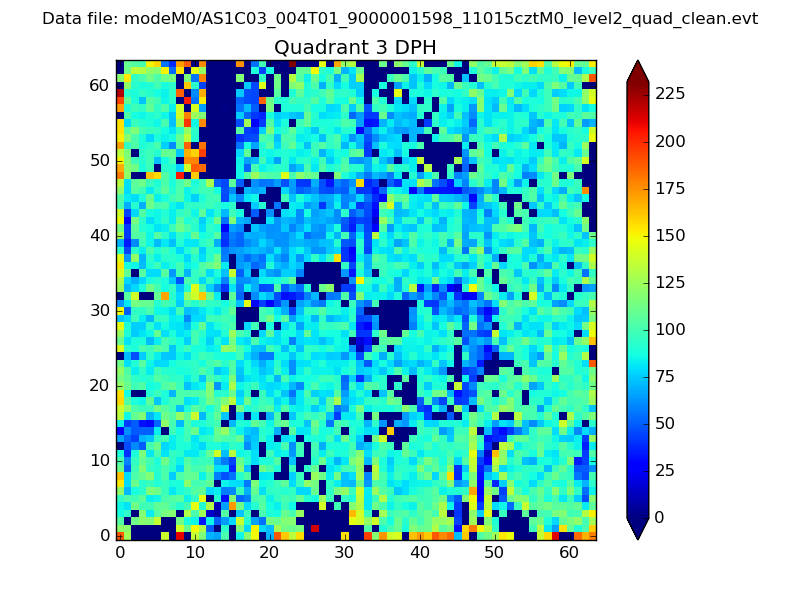 |
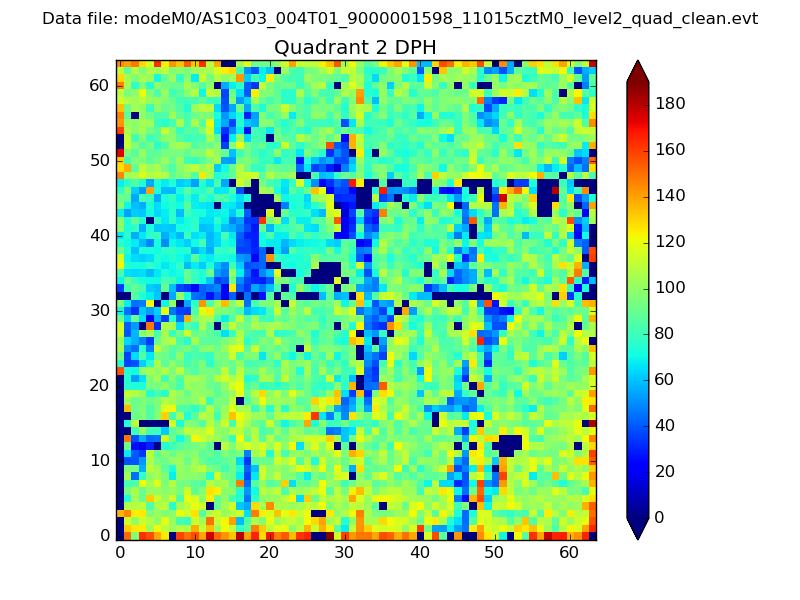 |
Quadrant C |
| Plot type | Count rate plots | Images |
|---|---|---|
| Comparison with Poisson distribution Blue bars denote a histogram of data divided into 1 sec bins. Red curve is a Poisson curve with rate = median count rate of data. |
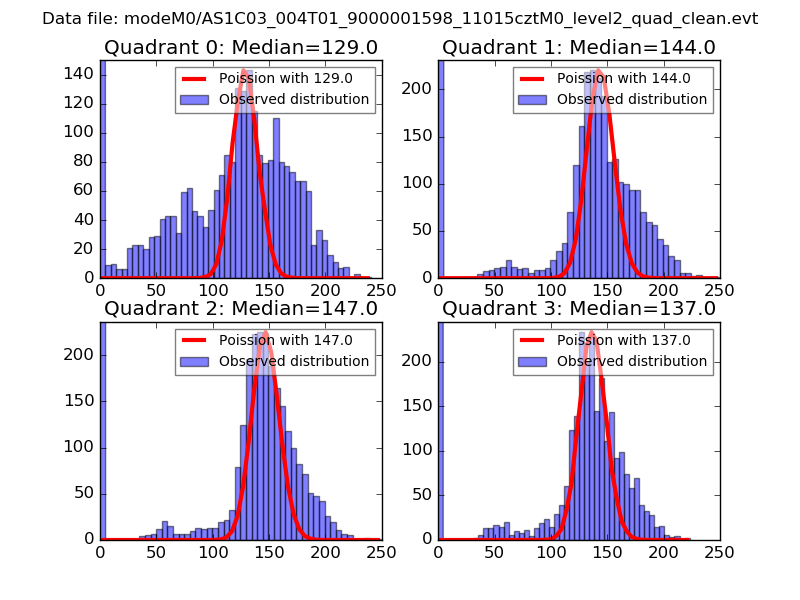 |
 |
| Quadrant-wise count rates Data is divided into 100 sec bins |
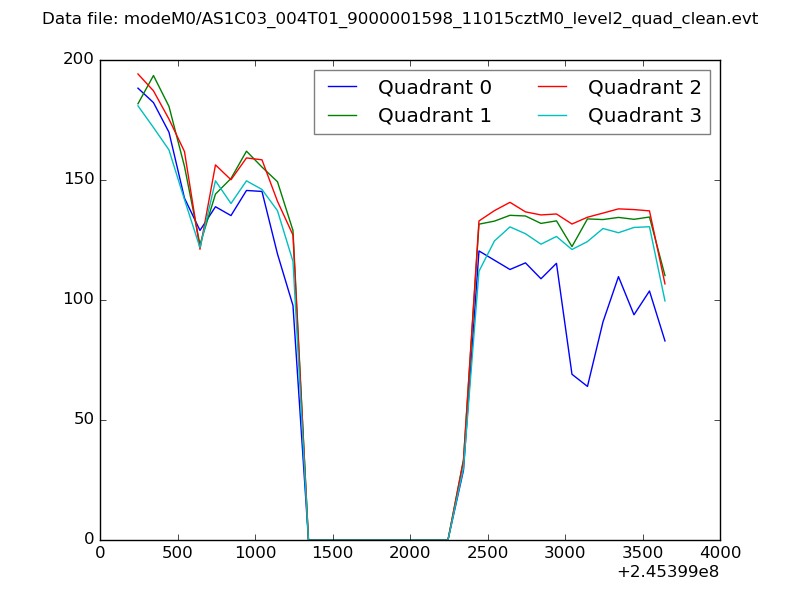 |
|
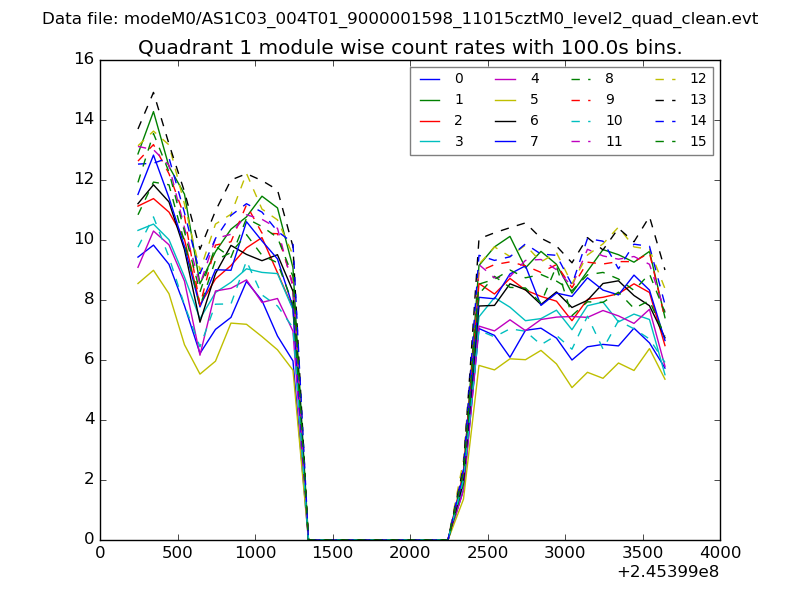
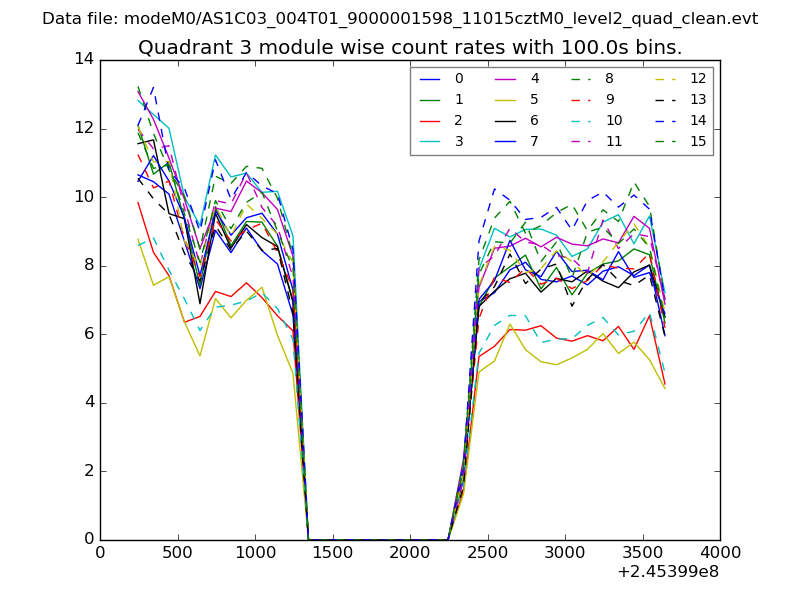
| Module-wise count rates for Quadrant A Data is divided into 100 sec bins |
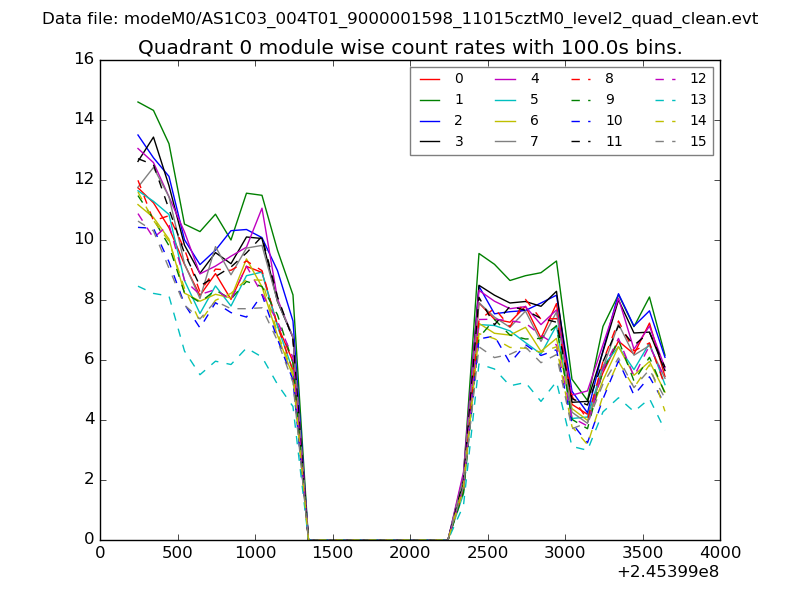 |
 |
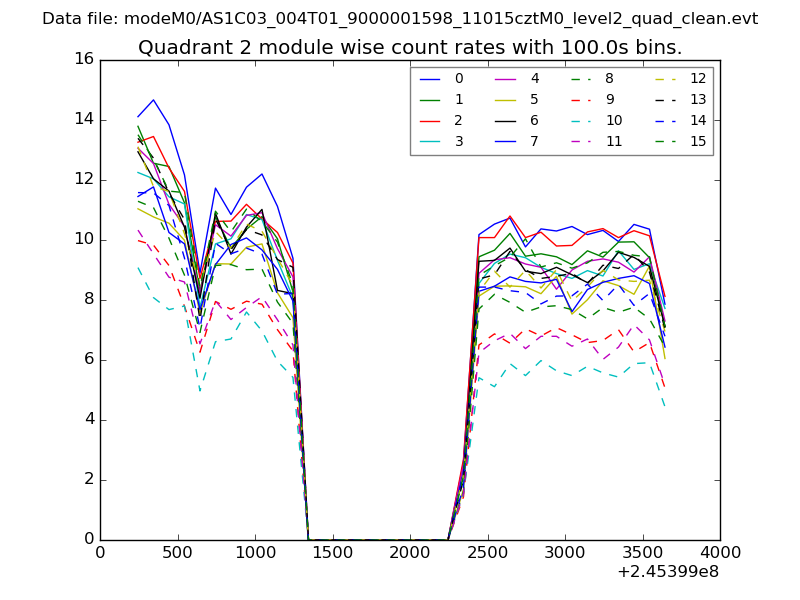
| Module-wise count rates for Quadrant B Data is divided into 100 sec bins |
 |
 |
| Module-wise count rates for Quadrant C Data is divided into 100 sec bins |
 |
 |
| Module-wise count rates for Quadrant D Data is divided into 100 sec bins |
 |
 |
| Parameter | Plot |
|---|---|
| CZT HV Monitor | 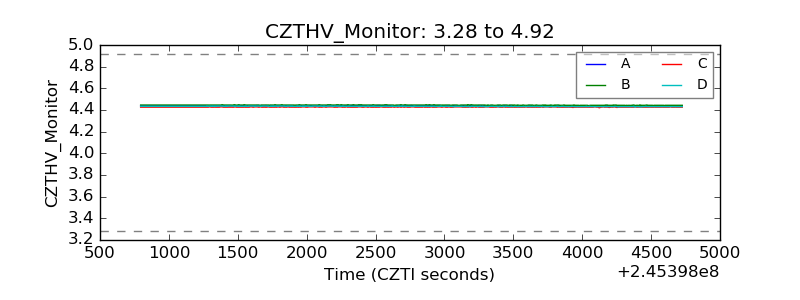 |
| D_VDD | 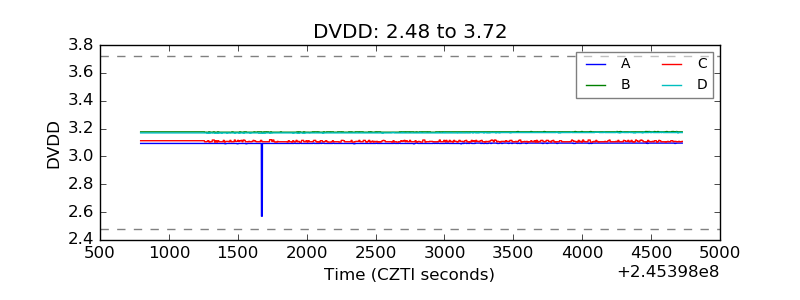 |
| Temperature 1 | 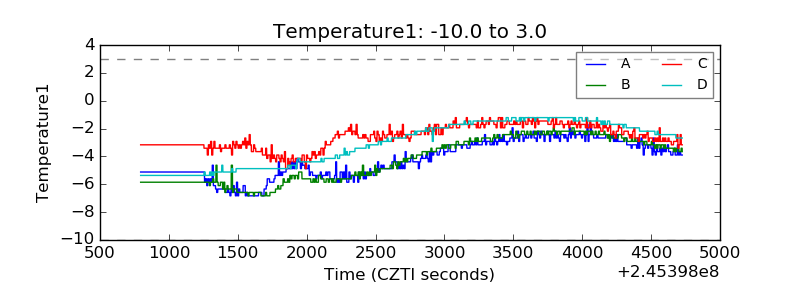 |
| Veto HV Monitor | 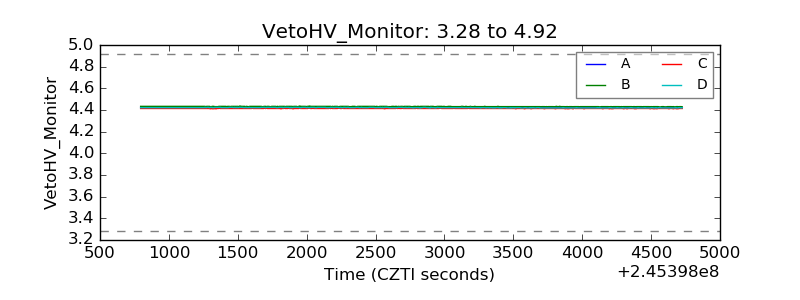 |
| Veto LLD | 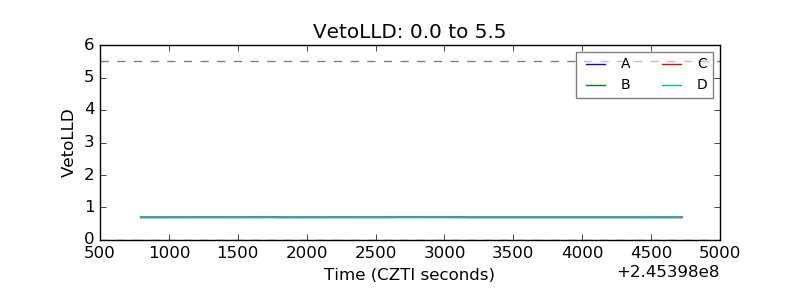 |
| Alpha Counter | 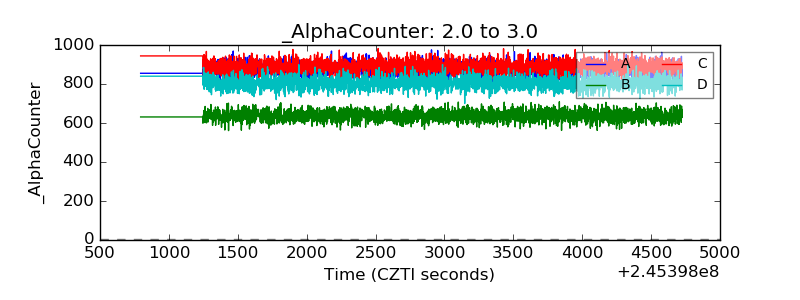 |
| _CPM_Rate | 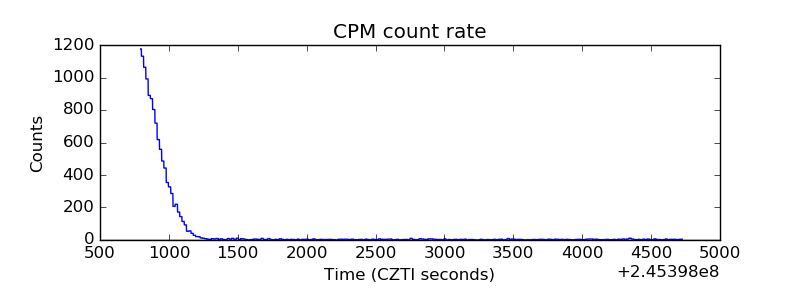 |
| CZT Counter | 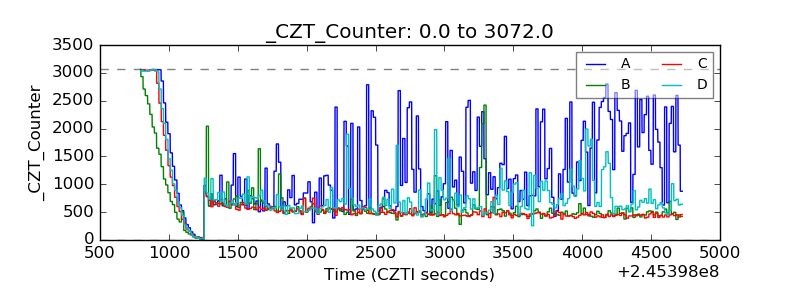 |
| +2.5 Volts monitor |  |
| +5 Volts monitor |  |
| _ROLL_ROT | 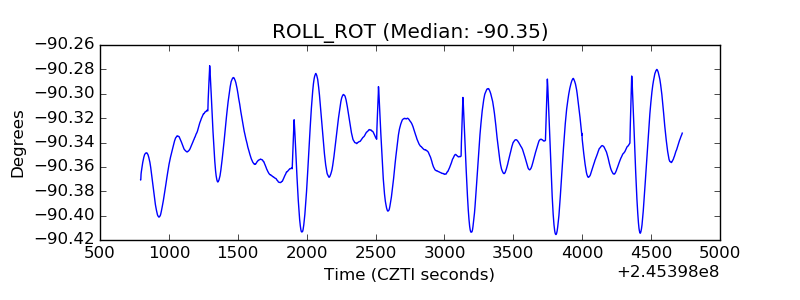 |
| _Roll_DEC | 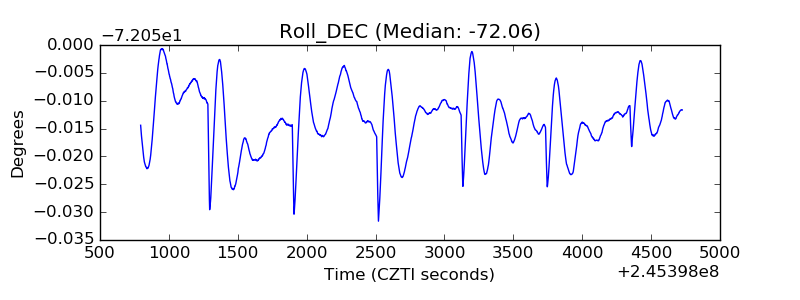 |
| _Roll_RA | 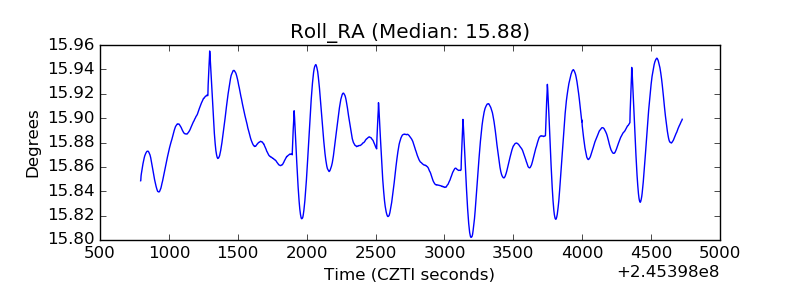 |
| Veto Counter | 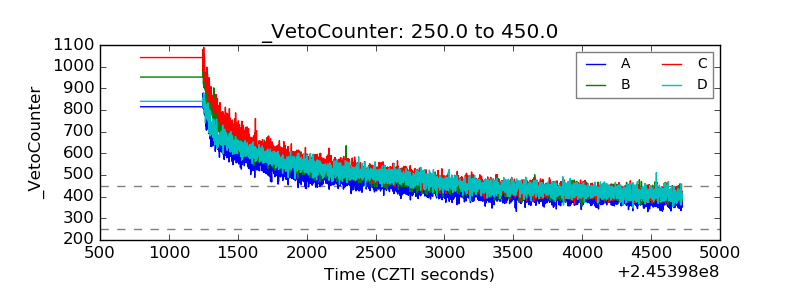 |