| Param | Original file | Final file |
|---|---|---|
| Filename | modeM0/AS1C03_016T01_9000001596cztM0_level2.fits | modeM0/AS1C03_016T01_9000001596cztM0_level2_quad_clean.evt |
| Size (bytes) | 107,389,440 | 64,883,520 |
| Size | 102.4 MB | 61.9 MB |
| Events in quadrant A | 615,904 | 272,001 |
| Events in quadrant B | 615,776 | 293,785 |
| Events in quadrant C | 643,956 | 296,531 |
| Events in quadrant D | 526,776 | 252,332 |
| Mode SS | |||
|---|---|---|---|
| Quadrant | BADHDUFLAG | Total packets | Discarded packets |
| A | 0 | 248 | 0 |
| B | 0 | 250 | 0 |
| C | 0 | 250 | 0 |
| D | 0 | 250 | 0 |
| Mode M0 | |||
|---|---|---|---|
| Quadrant | BADHDUFLAG | Total packets | Discarded packets |
| A | 0 | 36242 | 0 |
| B | 0 | 32082 | 0 |
| C | 0 | 24950 | 0 |
| D | 0 | 39924 | 0 |
| Mode M9 | |||
|---|---|---|---|
| Quadrant | BADHDUFLAG | Total packets | Discarded packets |
| A | 0 | 12 | 0 |
| B | 0 | 12 | 0 |
| C | 0 | 12 | 0 |
| D | 0 | 12 | 0 |
| Quadrant | Total seconds | Saturated seconds | Saturation percentage |
|---|---|---|---|
| A | 12280 | 1312 | 10.684039% |
| B | 12277 | 655 | 5.335180% |
| C | 12280 | 34 | 0.276873% |
| D | 12278 | 1053 | 8.576315% |
Noise dominated data is calculated using 1-second bins in cleaned event files. If a bin has >2000 counts, and if more than 50% of those come from <1% of pixels, then it is considered to be noise-dominated and hence unusable.
| Quadrant | # 1 sec bins | Bins with >0 counts | Bins with >2000 counts | High rate bins dominated by noise | Noise dominated (total time) | Noise dominated (detector-on time) | Marked lightcurve |
|---|---|---|---|---|---|---|---|
| A | 13587 | 12285 | 0 | 0 | 0.00% | 0.00% |  |
| B | 13587 | 12292 | 0 | 0 | 0.00% | 0.00% |  |
| C | 13587 | 12292 | 0 | 0 | 0.00% | 0.00% | 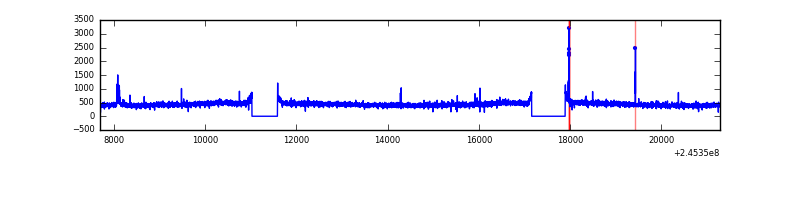 |
| D | 13587 | 12248 | 0 | 0 | 0.00% | 0.00% |  |
Top three noisy pixels from each quadrant. If the there are fewer than three noisy pixels in the level2.evt file, extra rows are filled as -1
| Pixel properties | Quadrant properties | ||||||
|---|---|---|---|---|---|---|---|
| Quadrant | DetID | PixID | Counts | Sigma | Mean | Median | Sigma |
| A | 0 | 29 | 623 | 11.19 | 160 | 150 | 42.3 |
| A | 14 | 188 | 615 | 11.0 | 160 | 150 | 42.3 |
| A | 14 | 204 | 524 | 8.85 | 160 | 150 | 42.3 |
| B | 2 | 9 | 500 | 9.92 | 162 | 154 | 34.9 |
| B | 5 | 128 | 421 | 7.65 | 162 | 154 | 34.9 |
| B | 3 | 17 | 412 | 7.4 | 162 | 154 | 34.9 |
| C | 1 | 81 | 514 | 7.82 | 169 | 157 | 45.6 |
| C | 1 | 65 | 484 | 7.17 | 169 | 157 | 45.6 |
| C | 1 | 80 | 470 | 6.86 | 169 | 157 | 45.6 |
| D | 6 | 231 | 417 | 6.71 | 150 | 136 | 41.9 |
| D | 3 | 14 | 412 | 6.59 | 150 | 136 | 41.9 |
| D | 1 | 19 | 403 | 6.38 | 150 | 136 | 41.9 |
Histogram calculated using DETX and DETY for each event in the final _common_clean file
| Quadrant A | 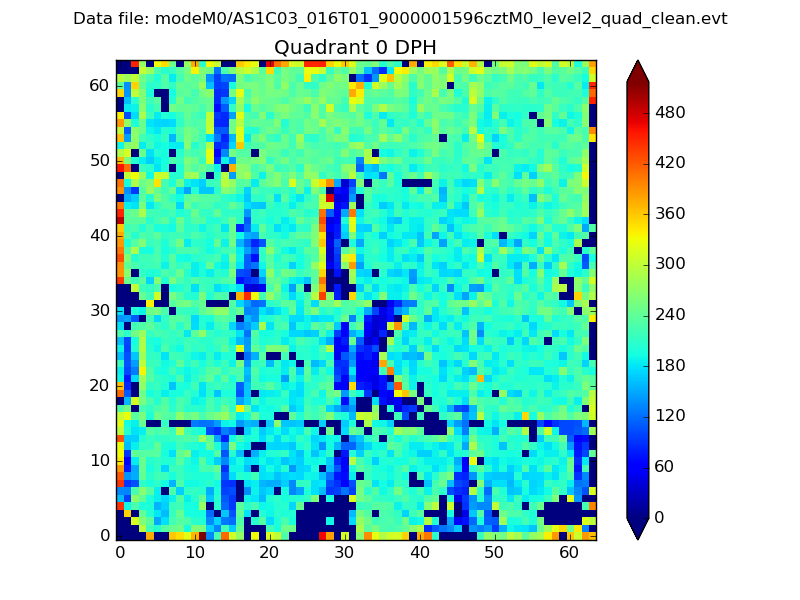 |
 |
Quadrant B |
|---|---|---|---|
| Quadrant D |  |
 |
Quadrant C |
| Plot type | Count rate plots | Images |
|---|---|---|
| Comparison with Poisson distribution Blue bars denote a histogram of data divided into 1 sec bins. Red curve is a Poisson curve with rate = median count rate of data. |
 |
 |
| Quadrant-wise count rates Data is divided into 100 sec bins |
 |
|
| Module-wise count rates for Quadrant A Data is divided into 100 sec bins |
 |
 |
| Module-wise count rates for Quadrant B Data is divided into 100 sec bins |
 |
 |
| Module-wise count rates for Quadrant C Data is divided into 100 sec bins |
 |
 |
| Module-wise count rates for Quadrant D Data is divided into 100 sec bins |
 |
 |
| Parameter | Plot |
|---|---|
| CZT HV Monitor |  |
| D_VDD |  |
| Temperature 1 |  |
| Veto HV Monitor |  |
| Veto LLD |  |
| Alpha Counter |  |
| _CPM_Rate |  |
| CZT Counter |  |
| +2.5 Volts monitor |  |
| +5 Volts monitor |  |
| _ROLL_ROT |  |
| _Roll_DEC |  |
| _Roll_RA |  |
| Veto Counter |  |