| Param | Original file | Final file |
|---|---|---|
| Filename | modeM0/AS1C03_016T01_9000001596_11009cztM0_level2.evt | modeM0/AS1C03_016T01_9000001596_11009cztM0_level2_quad_clean.evt |
| Size (bytes) | 14,342,400 | 3,692,160 |
| Size | 13.7 MB | 3.5 MB |
| Events in quadrant A | 87,507 | 18,338 |
| Events in quadrant B | 104,802 | 21,707 |
| Events in quadrant C | 108,956 | 26,770 |
| Events in quadrant D | 113,776 | 20,137 |
| Mode SS | |||
|---|---|---|---|
| Quadrant | BADHDUFLAG | Total packets | Discarded packets |
| A | 0 | 238 | 232 |
| B | 0 | 236 | 230 |
| C | 0 | 237 | 229 |
| D | 0 | 241 | 237 |
| Mode M0 | |||
|---|---|---|---|
| Quadrant | BADHDUFLAG | Total packets | Discarded packets |
| A | 0 | 34037 | 33649 |
| B | 0 | 30058 | 29592 |
| C | 0 | 23461 | 22925 |
| D | 0 | 38122 | 37653 |
| Mode M9 | |||
|---|---|---|---|
| Quadrant | BADHDUFLAG | Total packets | Discarded packets |
| A | 0 | 15 | 15 |
| B | 0 | 15 | 15 |
| C | 0 | 13 | 13 |
| D | 0 | 13 | 13 |
| Quadrant | Total seconds | Saturated seconds | Saturation percentage |
|---|---|---|---|
| A | 184 | 2 | 1.086957% |
| B | 224 | 2 | 0.892857% |
| C | 268 | 0 | 0.000000% |
| D | 216 | 0 | 0.000000% |
Noise dominated data is calculated using 1-second bins in cleaned event files. If a bin has >2000 counts, and if more than 50% of those come from <1% of pixels, then it is considered to be noise-dominated and hence unusable.
| Quadrant | # 1 sec bins | Bins with >0 counts | Bins with >2000 counts | High rate bins dominated by noise | Noise dominated (total time) | Noise dominated (detector-on time) | Marked lightcurve |
|---|---|---|---|---|---|---|---|
| A | 11947 | 328 | 2 | 2 | 0.02% | 0.61% | 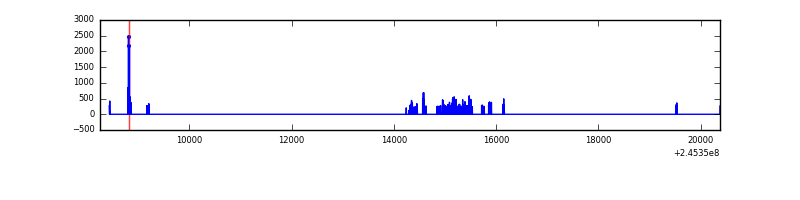 |
| B | 8644 | 392 | 0 | 0 | 0.00% | 0.00% | 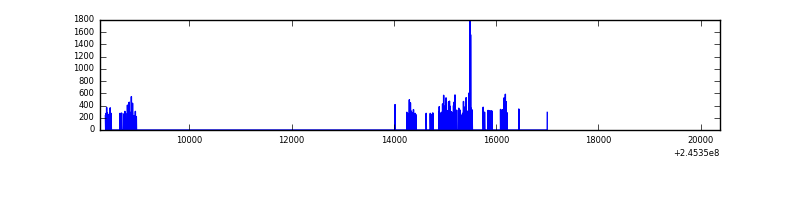 |
| C | 11269 | 470 | 0 | 0 | 0.00% | 0.00% | 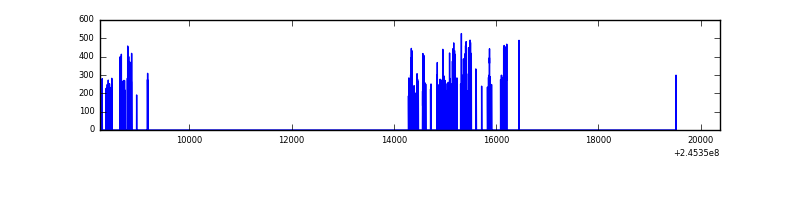 |
| D | 11260 | 385 | 0 | 0 | 0.00% | 0.00% | 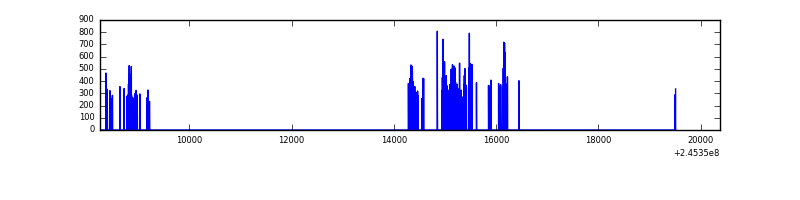 |
Top three noisy pixels from each quadrant. If the there are fewer than three noisy pixels in the level2.evt file, extra rows are filled as -1
| Pixel properties | Quadrant properties | ||||||
|---|---|---|---|---|---|---|---|
| Quadrant | DetID | PixID | Counts | Sigma | Mean | Median | Sigma |
| A | 14 | 238 | 7083 | 1166.52 | 19 | 19 | 6.1 |
| A | 8 | 5 | 3911 | 642.71 | 19 | 19 | 6.1 |
| A | 0 | 226 | 187 | 27.74 | 19 | 19 | 6.1 |
| B | 4 | 239 | 8414 | 1215.02 | 24 | 24 | 6.9 |
| B | 12 | 111 | 510 | 70.38 | 24 | 24 | 6.9 |
| B | 11 | 111 | 424 | 57.93 | 24 | 24 | 6.9 |
| C | 12 | 4 | 258 | 27.75 | 27 | 27 | 8.3 |
| C | 13 | 61 | 211 | 22.1 | 27 | 27 | 8.3 |
| C | 3 | 202 | 84 | 6.85 | 27 | 27 | 8.3 |
| D | 11 | 129 | 13794 | 1873.66 | 22 | 21 | 7.4 |
| D | 1 | 52 | 7652 | 1038.11 | 22 | 21 | 7.4 |
| D | 8 | 195 | 4134 | 559.53 | 22 | 21 | 7.4 |
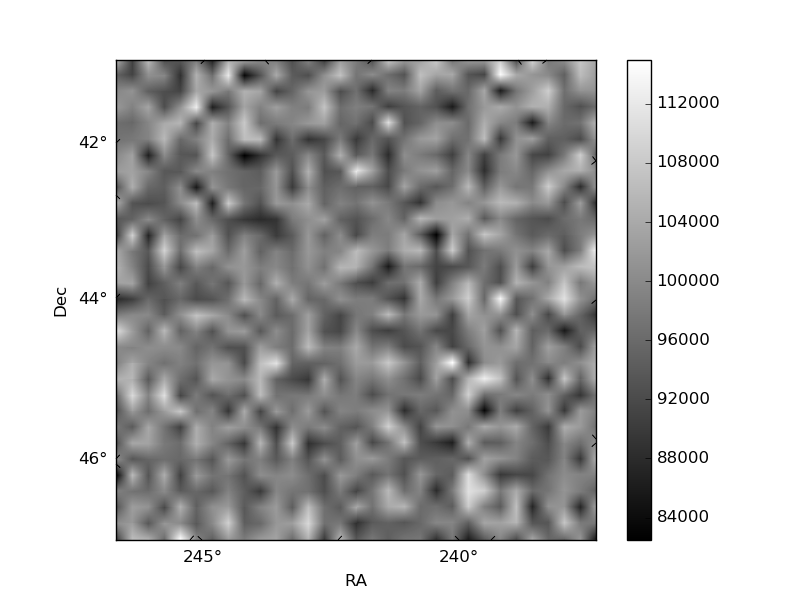
Histogram calculated using DETX and DETY for each event in the final _common_clean file
| Quadrant A | 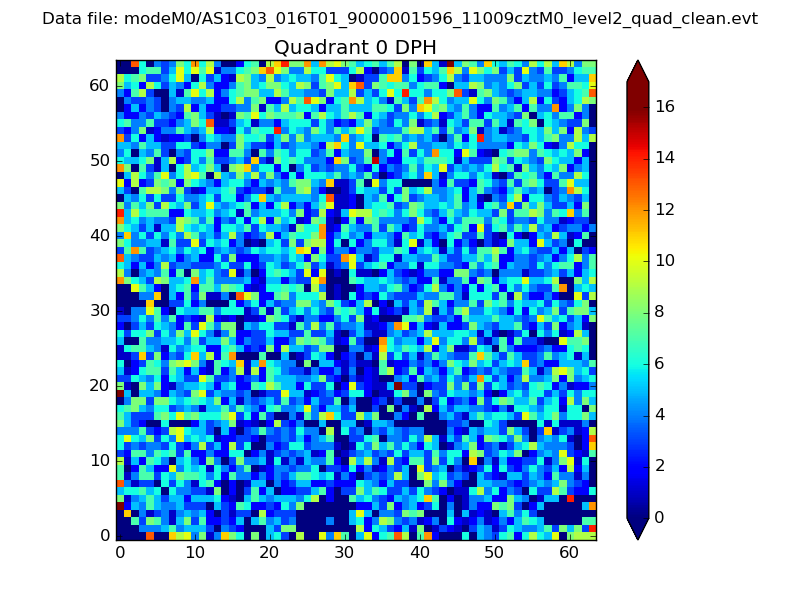 |
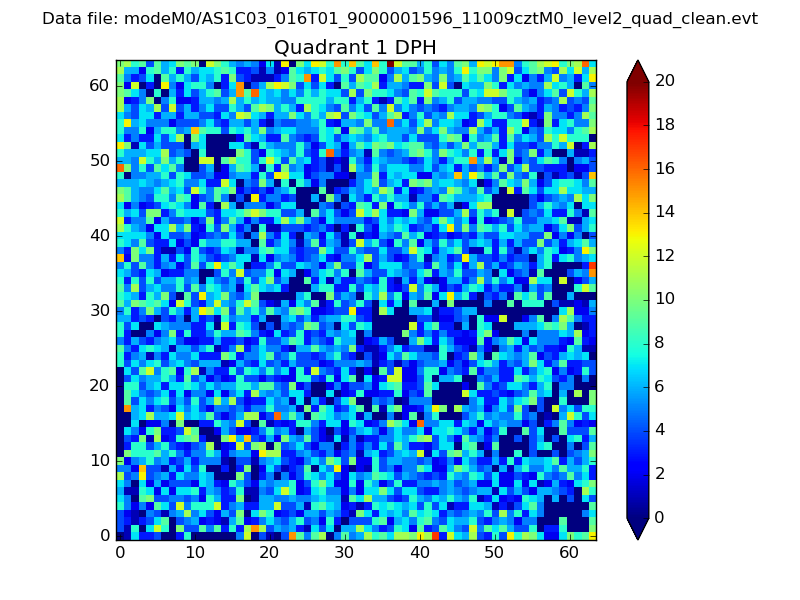 |
Quadrant B |
|---|---|---|---|
| Quadrant D | 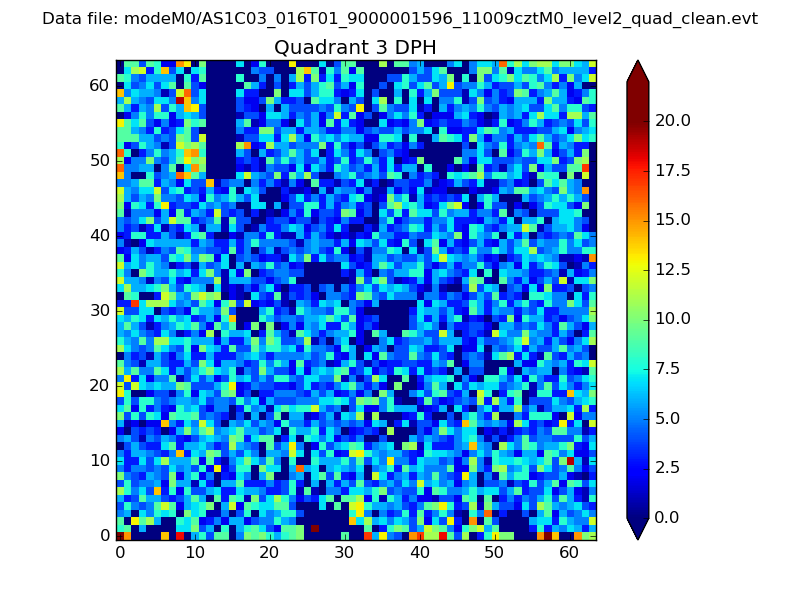 |
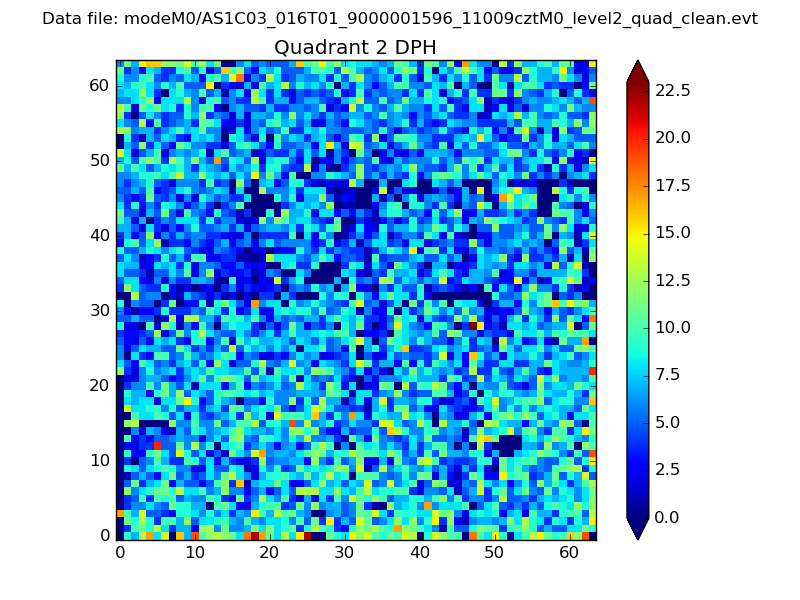 |
Quadrant C |
| Plot type | Count rate plots | Images |
|---|---|---|
| Comparison with Poisson distribution Blue bars denote a histogram of data divided into 1 sec bins. Red curve is a Poisson curve with rate = median count rate of data. |
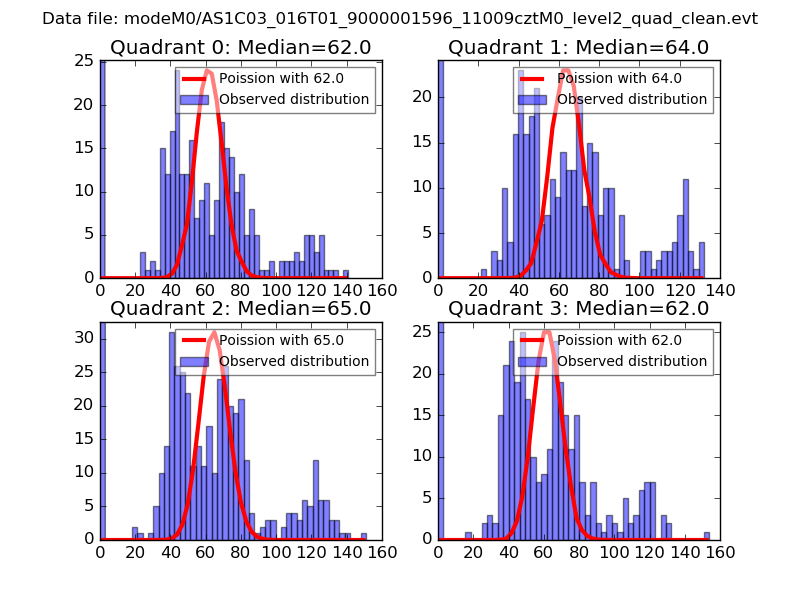 |
 |
| Quadrant-wise count rates Data is divided into 100 sec bins |
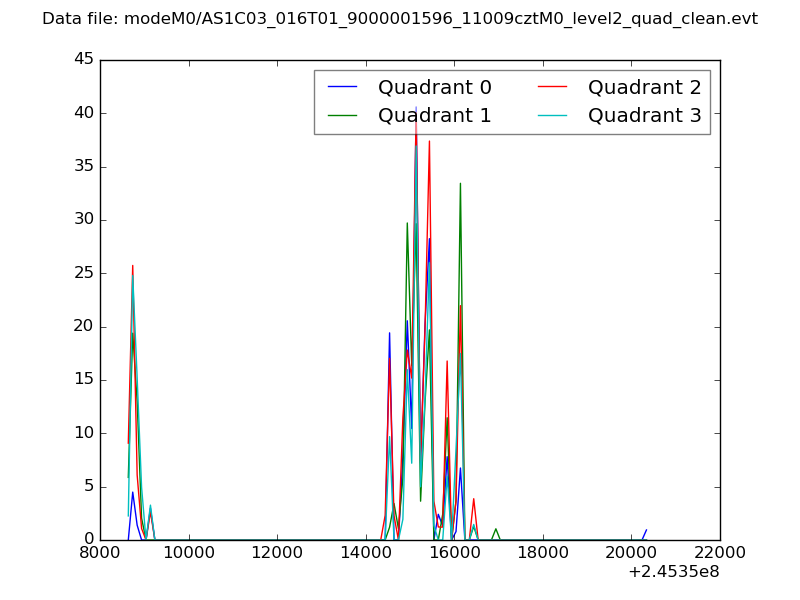 |
|
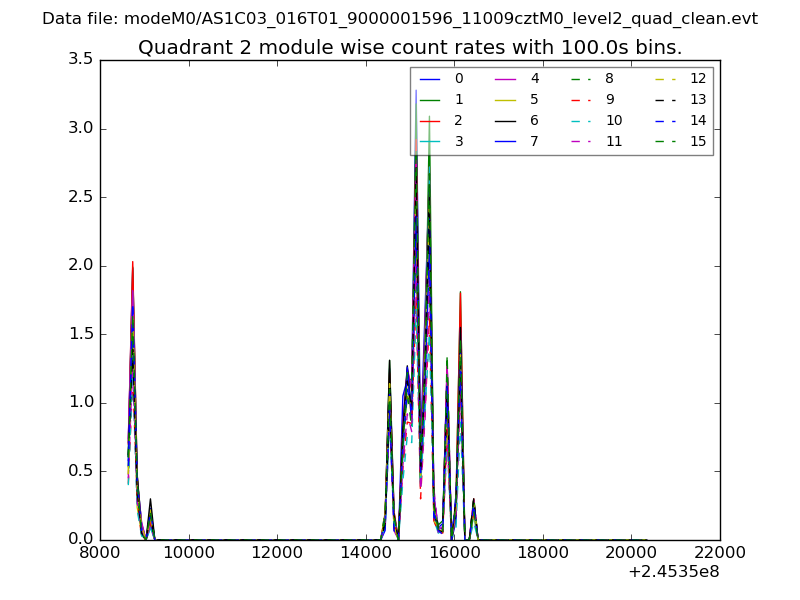
| Module-wise count rates for Quadrant A Data is divided into 100 sec bins |
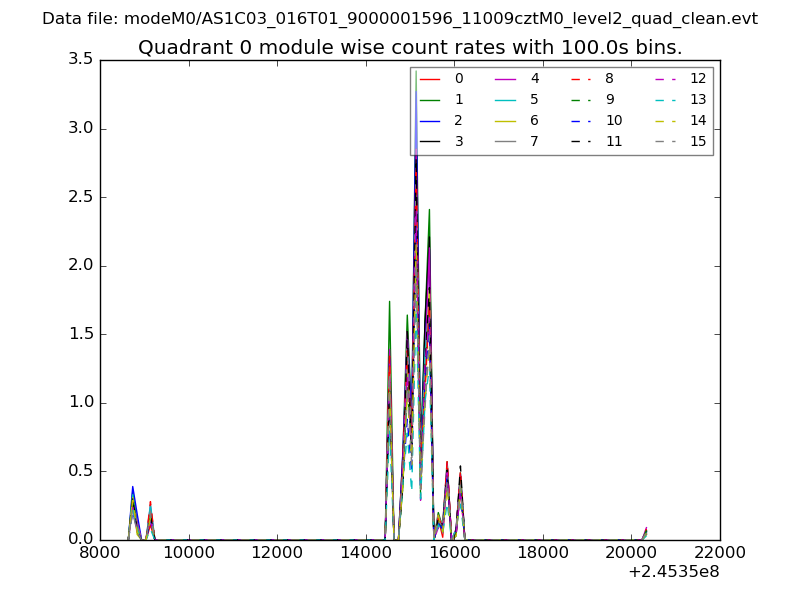 |
 |
| Module-wise count rates for Quadrant B Data is divided into 100 sec bins |
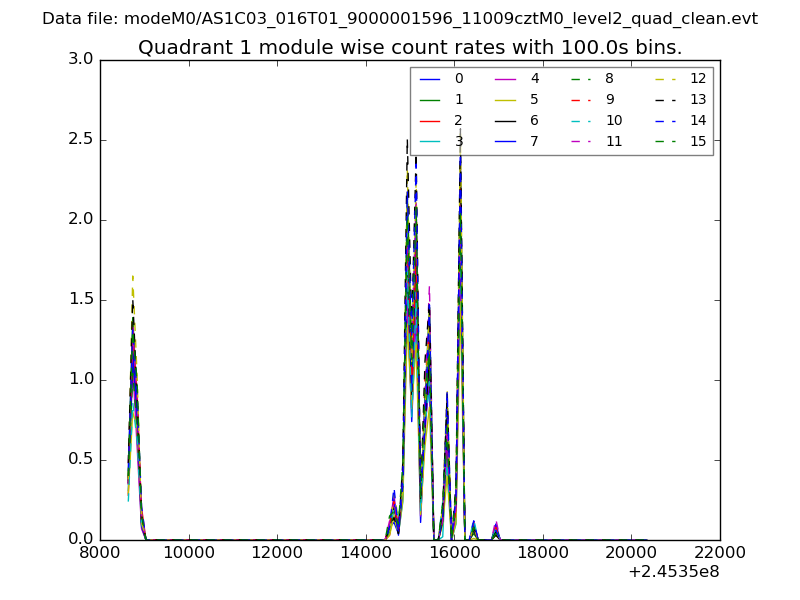 |
 |
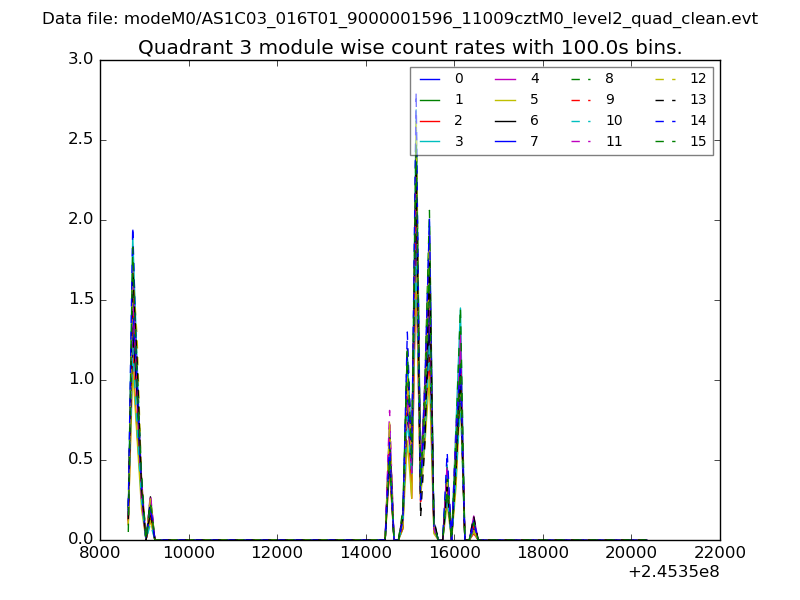
| Module-wise count rates for Quadrant C Data is divided into 100 sec bins |
 |
 |
| Module-wise count rates for Quadrant D Data is divided into 100 sec bins |
 |
 |
| Parameter | Plot |
|---|---|
| CZT HV Monitor | 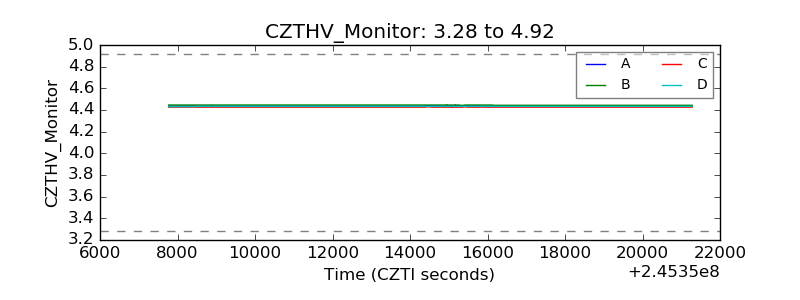 |
| D_VDD |  |
| Temperature 1 | 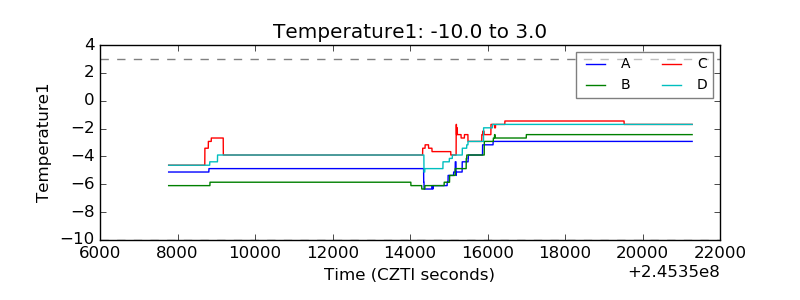 |
| Veto HV Monitor | 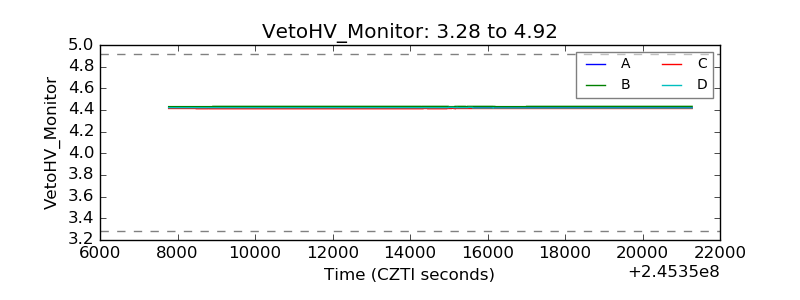 |
| Veto LLD | 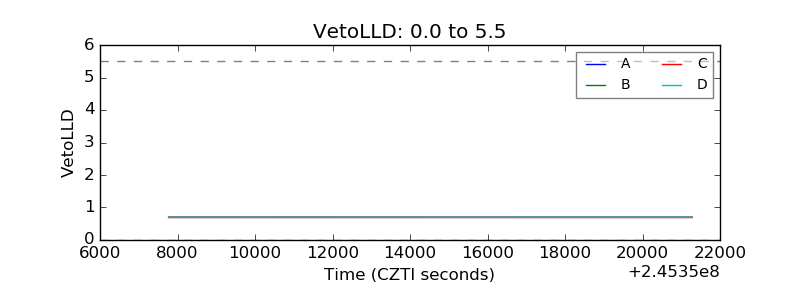 |
| Alpha Counter | 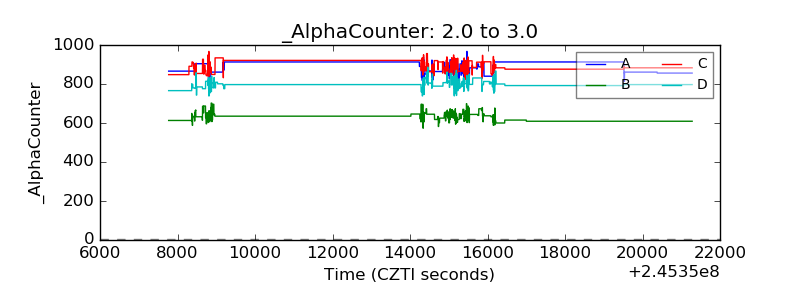 |
| _CPM_Rate | 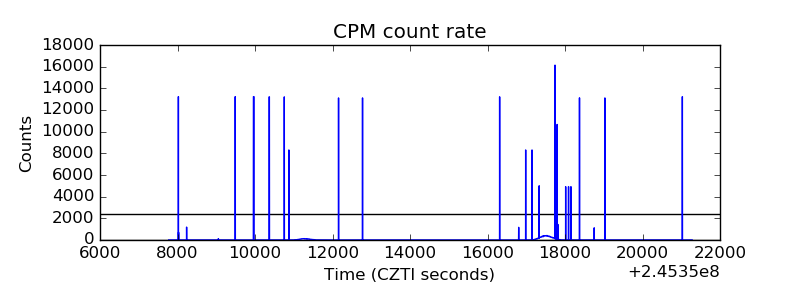 |
| CZT Counter | 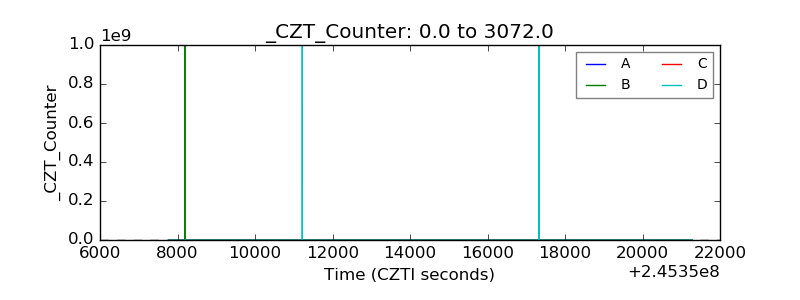 |
| +2.5 Volts monitor |  |
| +5 Volts monitor |  |
| _ROLL_ROT | 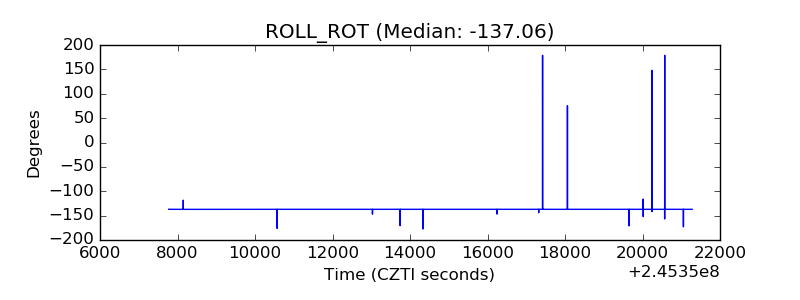 |
| _Roll_DEC | 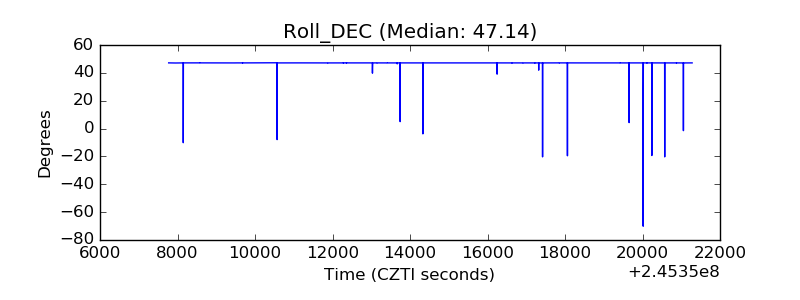 |
| _Roll_RA |  |
| Veto Counter | 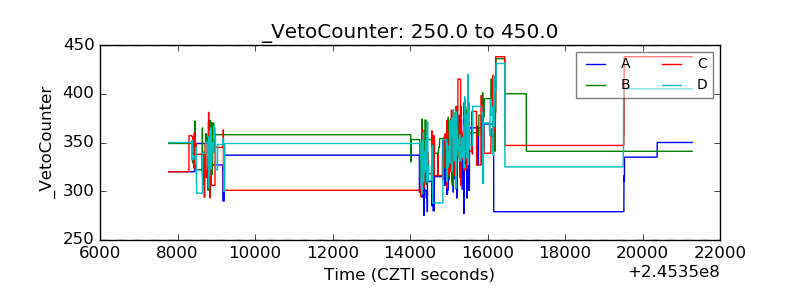 |