| Param | Original file | Final file |
|---|---|---|
| Filename | modeM0/AS1G08_046T09_9000001600cztM0_level2.fits | modeM0/AS1G08_046T09_9000001600cztM0_level2_quad_clean.evt |
| Size (bytes) | 648,512,640 | 673,021,440 |
| Size | 618.5 MB | 641.8 MB |
| Events in quadrant A | 3,719,416 | 3,731,402 |
| Events in quadrant B | 3,768,910 | 4,081,813 |
| Events in quadrant C | 3,942,444 | 4,059,002 |
| Events in quadrant D | 3,354,624 | 3,662,046 |
| Mode M0 | |||
|---|---|---|---|
| Quadrant | BADHDUFLAG | Total packets | Discarded packets |
| A | 0 | 231498 | 0 |
| B | 0 | 191697 | 0 |
| C | 0 | 145884 | 0 |
| D | 0 | 192658 | 0 |
| Mode M9 | |||
|---|---|---|---|
| Quadrant | BADHDUFLAG | Total packets | Discarded packets |
| A | 0 | 118 | 0 |
| B | 0 | 118 | 0 |
| C | 0 | 118 | 0 |
| D | 0 | 118 | 0 |
| Mode SS | |||
|---|---|---|---|
| Quadrant | BADHDUFLAG | Total packets | Discarded packets |
| A | 0 | 1440 | 0 |
| B | 0 | 1442 | 0 |
| C | 0 | 1440 | 0 |
| D | 0 | 1436 | 0 |
| Quadrant | Total seconds | Saturated seconds | Saturation percentage |
|---|---|---|---|
| A | 70599 | 8631 | 12.225386% |
| B | 70690 | 4633 | 6.553968% |
| C | 70780 | 452 | 0.638598% |
| D | 70724 | 2777 | 3.926531% |
Noise dominated data is calculated using 1-second bins in cleaned event files. If a bin has >2000 counts, and if more than 50% of those come from <1% of pixels, then it is considered to be noise-dominated and hence unusable.
| Quadrant | # 1 sec bins | Bins with >0 counts | Bins with >2000 counts | High rate bins dominated by noise | Noise dominated (total time) | Noise dominated (detector-on time) | Marked lightcurve |
|---|---|---|---|---|---|---|---|
| A | 81542 | 70251 | 0 | 0 | 0.00% | 0.00% |  |
| B | 81542 | 70782 | 0 | 0 | 0.00% | 0.00% |  |
| C | 81542 | 70879 | 0 | 0 | 0.00% | 0.00% |  |
| D | 81542 | 70758 | 0 | 0 | 0.00% | 0.00% |  |
Top three noisy pixels from each quadrant. If the there are fewer than three noisy pixels in the level2.evt file, extra rows are filled as -1
| Pixel properties | Quadrant properties | ||||||
|---|---|---|---|---|---|---|---|
| Quadrant | DetID | PixID | Counts | Sigma | Mean | Median | Sigma |
| A | 14 | 188 | 3812 | 11.99 | 967 | 907 | 242.3 |
| A | 0 | 29 | 3392 | 10.26 | 967 | 907 | 242.3 |
| A | 14 | 204 | 3192 | 9.43 | 967 | 907 | 242.3 |
| B | 2 | 9 | 3271 | 11.71 | 994 | 947 | 198.5 |
| B | 3 | 17 | 2505 | 7.85 | 994 | 947 | 198.5 |
| B | 14 | 254 | 2474 | 7.69 | 994 | 947 | 198.5 |
| C | 1 | 80 | 3072 | 7.84 | 1039 | 967 | 268.4 |
| C | 1 | 81 | 3021 | 7.65 | 1039 | 967 | 268.4 |
| C | 12 | 241 | 2789 | 6.79 | 1039 | 967 | 268.4 |
| D | 6 | 231 | 2504 | 6.39 | 956 | 867 | 256.2 |
| D | 3 | 14 | 2481 | 6.3 | 956 | 867 | 256.2 |
| D | 7 | 3 | 2377 | 5.89 | 956 | 867 | 256.2 |
Histogram calculated using DETX and DETY for each event in the final _common_clean file
| Quadrant A |  |
 |
Quadrant B |
|---|---|---|---|
| Quadrant D |  |
 |
Quadrant C |
| Plot type | Count rate plots | Images |
|---|---|---|
| Comparison with Poisson distribution Blue bars denote a histogram of data divided into 1 sec bins. Red curve is a Poisson curve with rate = median count rate of data. |
 |
 |
| Quadrant-wise count rates Data is divided into 100 sec bins |
 |
|
| Module-wise count rates for Quadrant A Data is divided into 100 sec bins |
 |
 |
| Module-wise count rates for Quadrant B Data is divided into 100 sec bins |
 |
 |
| Module-wise count rates for Quadrant C Data is divided into 100 sec bins |
 |
 |
| Module-wise count rates for Quadrant D Data is divided into 100 sec bins |
 |
 |
| Parameter | Plot |
|---|---|
| CZT HV Monitor |  |
| D_VDD | 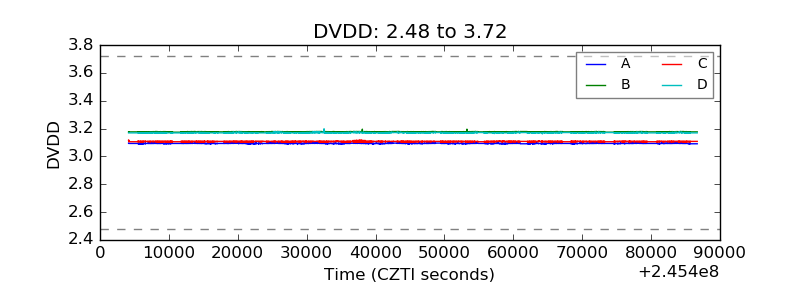 |
| Temperature 1 |  |
| Veto HV Monitor |  |
| Veto LLD |  |
| Alpha Counter |  |
| _CPM_Rate |  |
| CZT Counter |  |
| +2.5 Volts monitor |  |
| +5 Volts monitor |  |
| _ROLL_ROT |  |
| _Roll_DEC |  |
| _Roll_RA |  |
| Veto Counter |  |