| Param | Original file | Final file |
|---|---|---|
| Filename | modeM0/AS1G08_046T09_9000001600_11015cztM0_level2.evt | modeM0/AS1G08_046T09_9000001600_11015cztM0_level2_quad_clean.evt |
| Size (bytes) | 145,010,880 | 27,103,680 |
| Size | 138.3 MB | 25.8 MB |
| Events in quadrant A | 1,445,556 | 172,342 |
| Events in quadrant B | 857,948 | 192,820 |
| Events in quadrant C | 702,514 | 190,031 |
| Events in quadrant D | 1,292,300 | 164,907 |
| Mode M0 | |||
|---|---|---|---|
| Quadrant | BADHDUFLAG | Total packets | Discarded packets |
| A | 0 | 5223 | 2 |
| B | 0 | 3394 | 6 |
| C | 0 | 2913 | 3 |
| D | 0 | 4729 | 13 |
| Mode M9 | |||
|---|---|---|---|
| Quadrant | BADHDUFLAG | Total packets | Discarded packets |
| A | 0 | 13 | 0 |
| B | 0 | 13 | 0 |
| C | 0 | 13 | 0 |
| D | 0 | 13 | 0 |
| Mode SS | |||
|---|---|---|---|
| Quadrant | BADHDUFLAG | Total packets | Discarded packets |
| A | 0 | 28 | 0 |
| B | 0 | 28 | 0 |
| C | 0 | 28 | 0 |
| D | 0 | 28 | 0 |
| Quadrant | Total seconds | Saturated seconds | Saturation percentage |
|---|---|---|---|
| A | 1341 | 283 | 21.103654% |
| B | 1339 | 89 | 6.646751% |
| C | 1340 | 46 | 3.432836% |
| D | 1339 | 223 | 16.654220% |
Noise dominated data is calculated using 1-second bins in cleaned event files. If a bin has >2000 counts, and if more than 50% of those come from <1% of pixels, then it is considered to be noise-dominated and hence unusable.
| Quadrant | # 1 sec bins | Bins with >0 counts | Bins with >2000 counts | High rate bins dominated by noise | Noise dominated (total time) | Noise dominated (detector-on time) | Marked lightcurve |
|---|---|---|---|---|---|---|---|
| A | 2621 | 1341 | 160 | 160 | 6.10% | 11.93% | 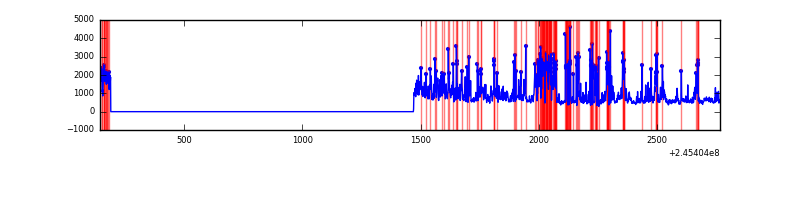 |
| B | 2621 | 1341 | 13 | 13 | 0.50% | 0.97% | 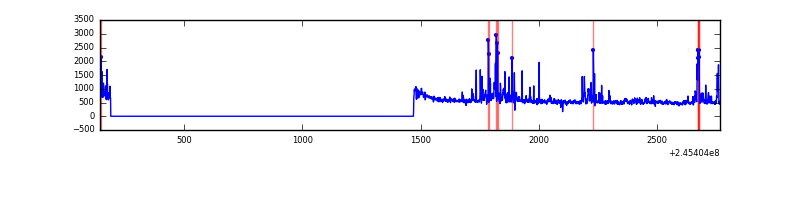 |
| C | 2621 | 1342 | 3 | 3 | 0.11% | 0.22% |  |
| D | 2621 | 1341 | 165 | 165 | 6.30% | 12.30% | 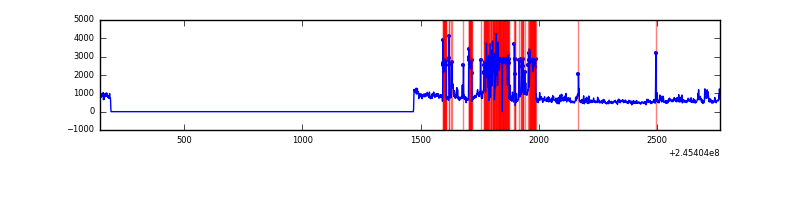 |
Top three noisy pixels from each quadrant. If the there are fewer than three noisy pixels in the level2.evt file, extra rows are filled as -1
| Pixel properties | Quadrant properties | ||||||
|---|---|---|---|---|---|---|---|
| Quadrant | DetID | PixID | Counts | Sigma | Mean | Median | Sigma |
| A | 8 | 5 | 519436 | 14690.68 | 166 | 163 | 35.3 |
| A | 14 | 238 | 281215 | 7951.2 | 166 | 163 | 35.3 |
| A | 14 | 254 | 2716 | 72.23 | 166 | 163 | 35.3 |
| B | 4 | 239 | 135844 | 3678.09 | 181 | 177 | 36.9 |
| B | 0 | 187 | 9605 | 255.6 | 181 | 177 | 36.9 |
| B | 11 | 51 | 4151 | 107.74 | 181 | 177 | 36.9 |
| C | 14 | 234 | 17987 | 425.23 | 175 | 175 | 41.9 |
| C | 13 | 61 | 1266 | 26.05 | 175 | 175 | 41.9 |
| C | 12 | 4 | 706 | 12.68 | 175 | 175 | 41.9 |
| D | 10 | 253 | 408641 | 10047.99 | 163 | 158 | 40.7 |
| D | 11 | 129 | 127279 | 3126.96 | 163 | 158 | 40.7 |
| D | 1 | 52 | 107980 | 2652.24 | 163 | 158 | 40.7 |
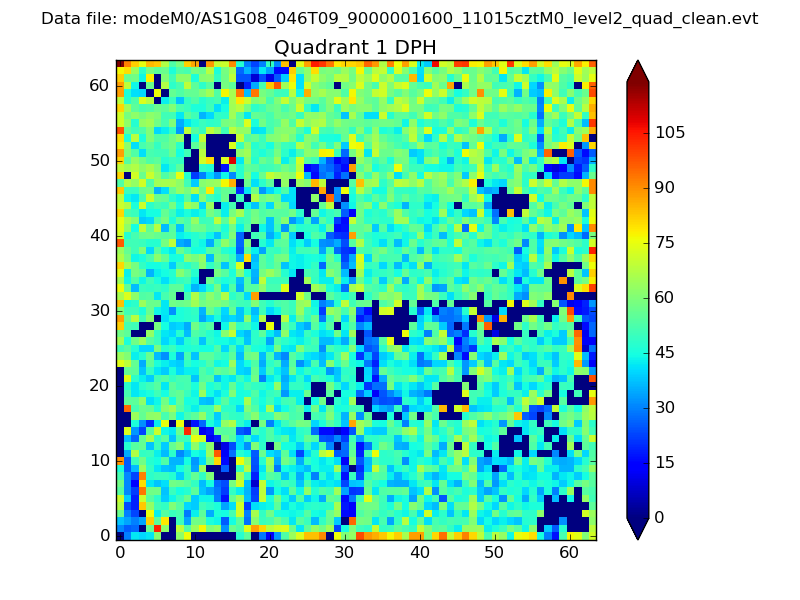
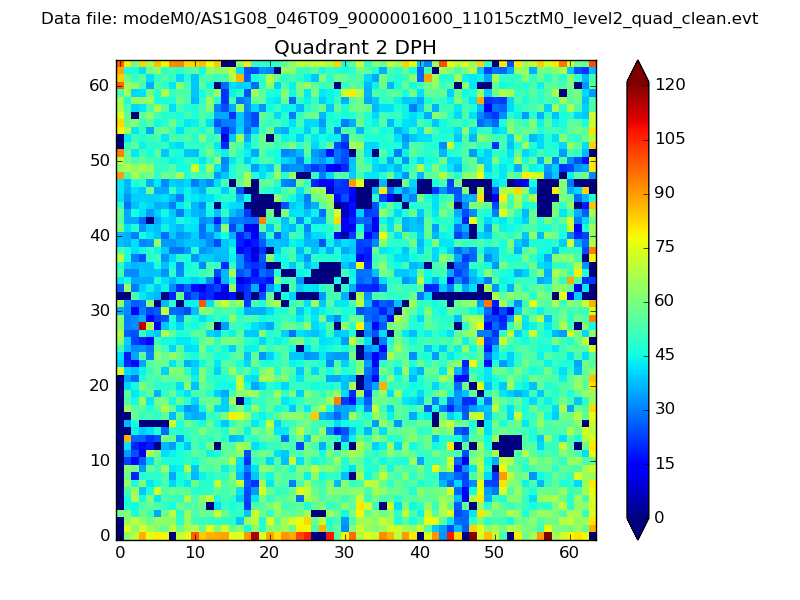
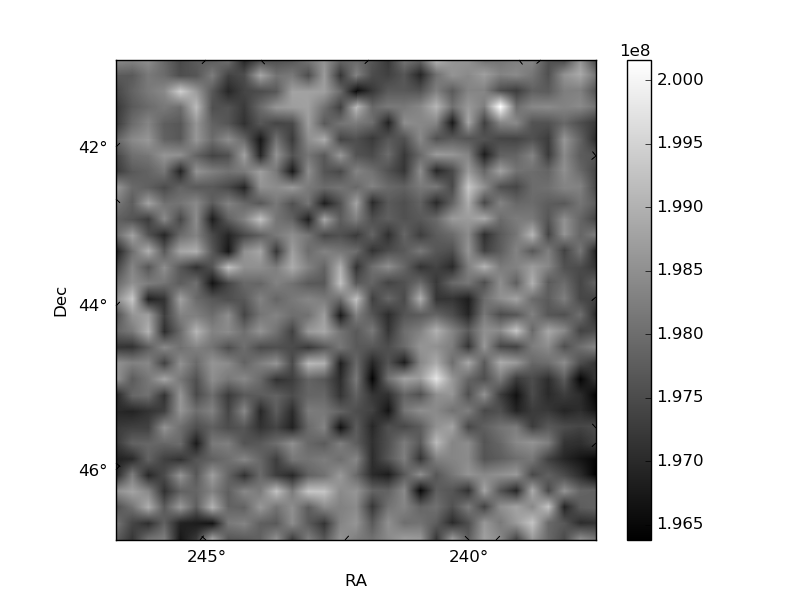
Histogram calculated using DETX and DETY for each event in the final _common_clean file
| Quadrant A | 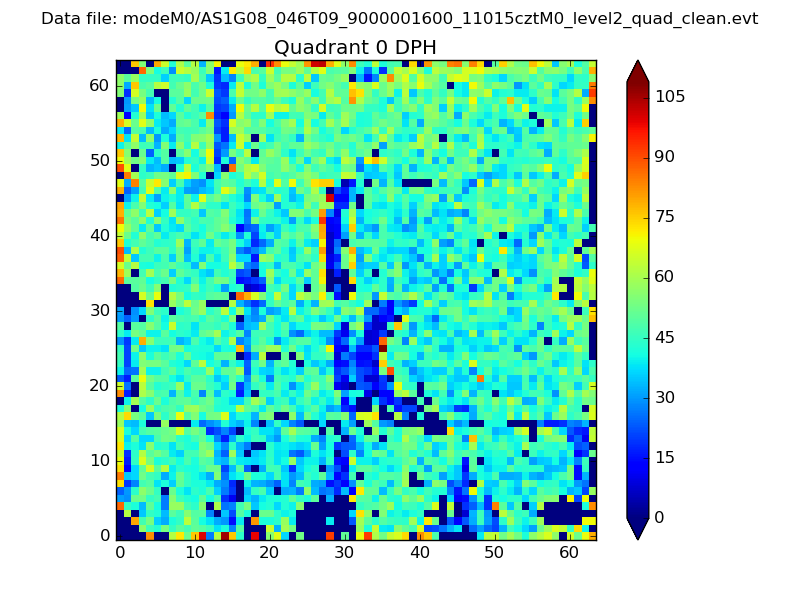 |
 |
Quadrant B |
|---|---|---|---|
| Quadrant D | 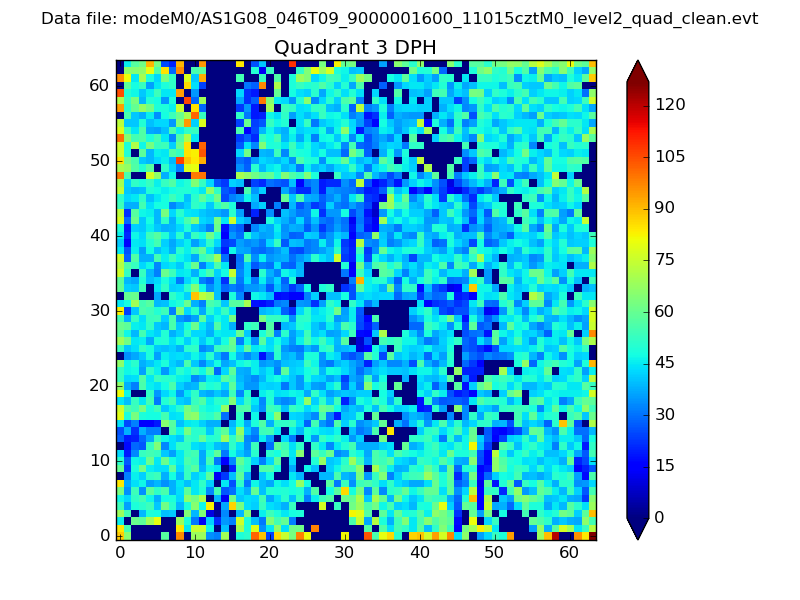 |
 |
Quadrant C |
| Plot type | Count rate plots | Images |
|---|---|---|
| Comparison with Poisson distribution Blue bars denote a histogram of data divided into 1 sec bins. Red curve is a Poisson curve with rate = median count rate of data. |
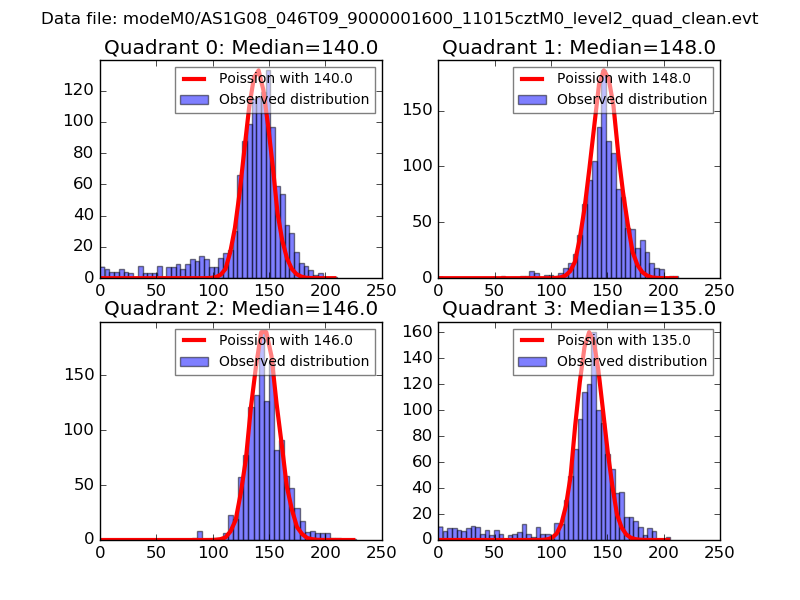 |
 |
| Quadrant-wise count rates Data is divided into 100 sec bins |
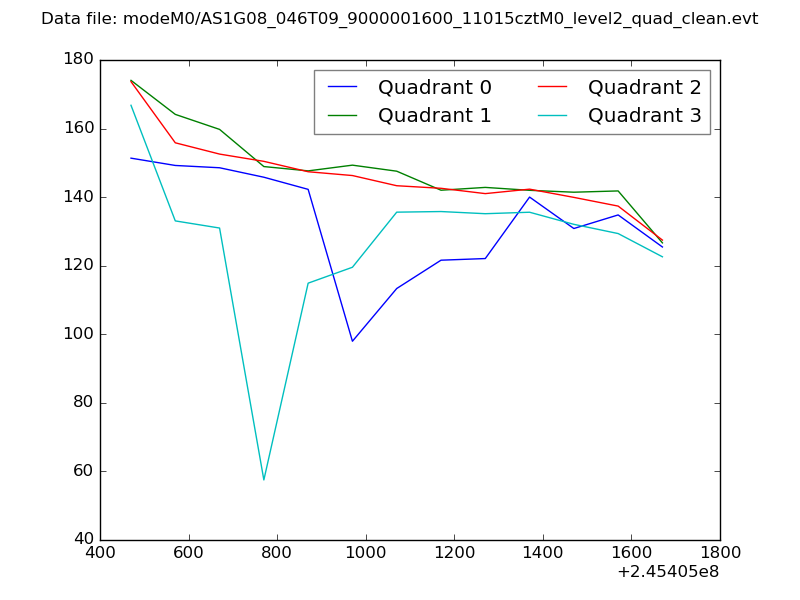 |
|
| Module-wise count rates for Quadrant A Data is divided into 100 sec bins |
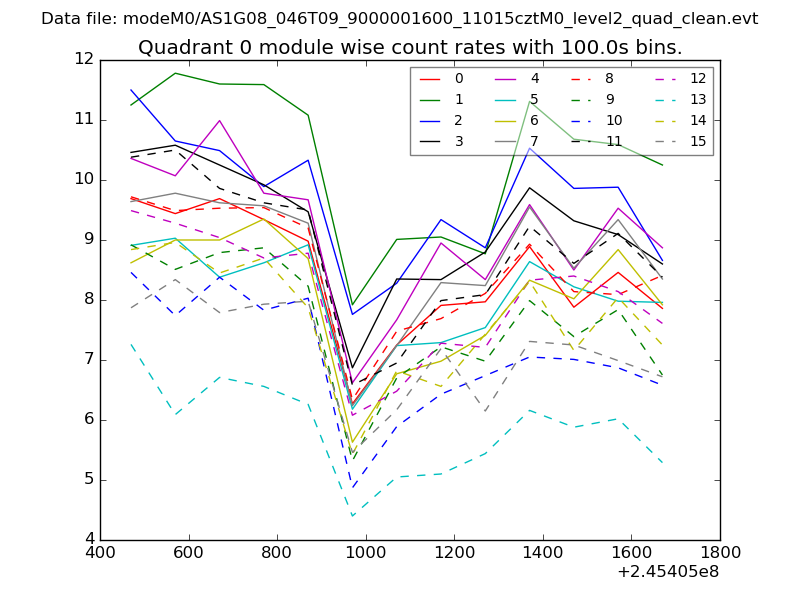 |
 |
| Module-wise count rates for Quadrant B Data is divided into 100 sec bins |
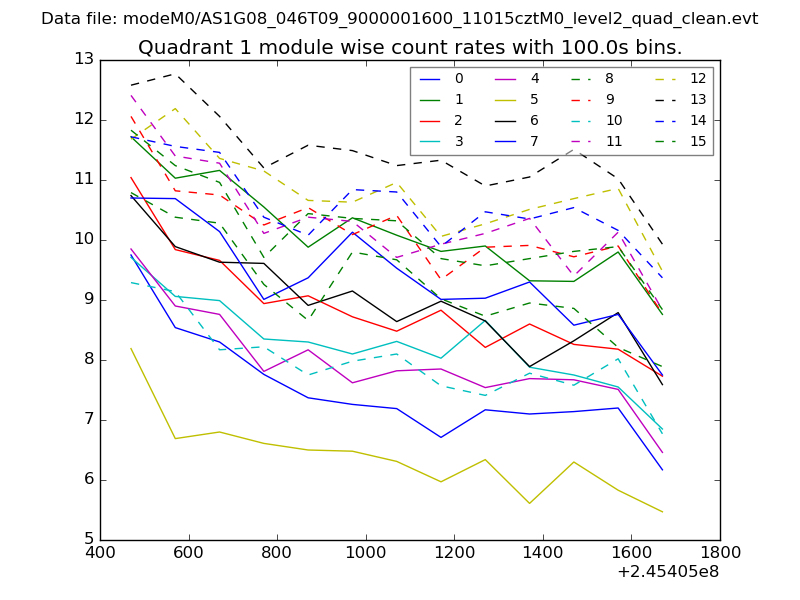 |
 |
| Module-wise count rates for Quadrant C Data is divided into 100 sec bins |
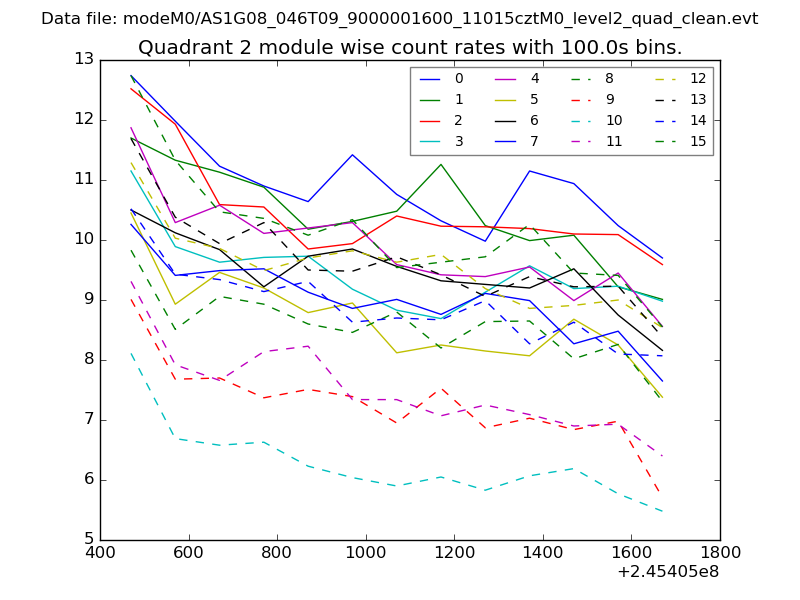 |
 |
| Module-wise count rates for Quadrant D Data is divided into 100 sec bins |
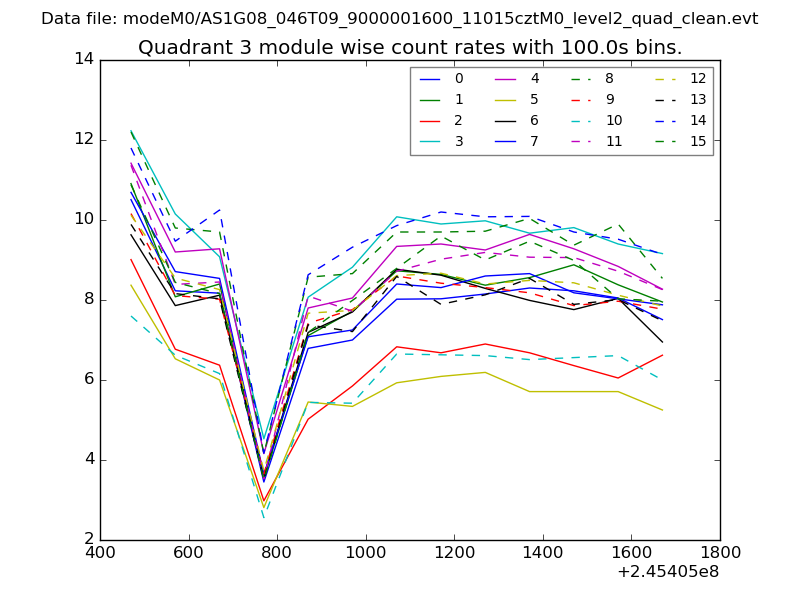 |
 |
| Parameter | Plot |
|---|---|
| CZT HV Monitor | 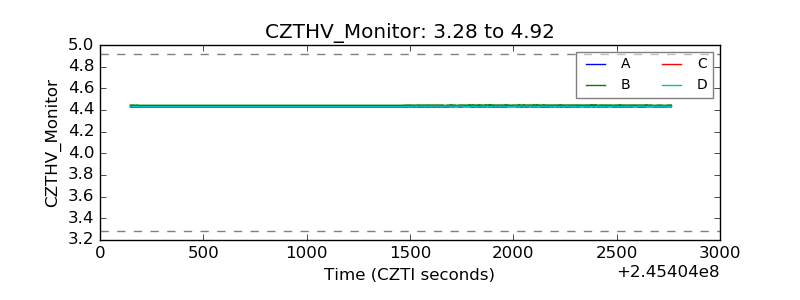 |
| D_VDD | 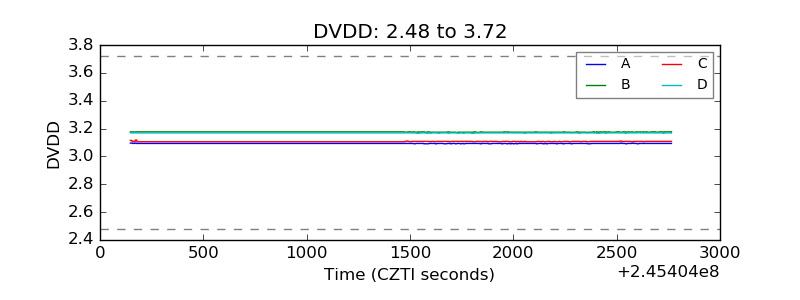 |
| Temperature 1 | 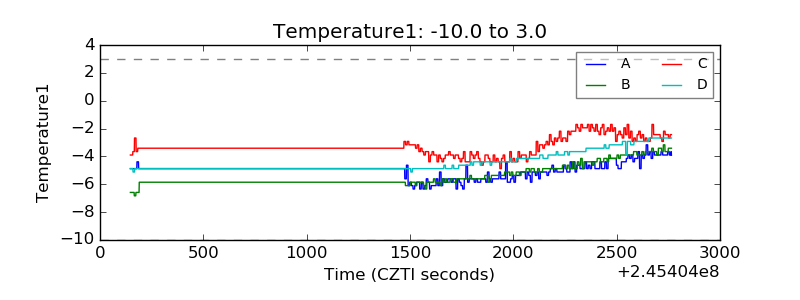 |
| Veto HV Monitor | 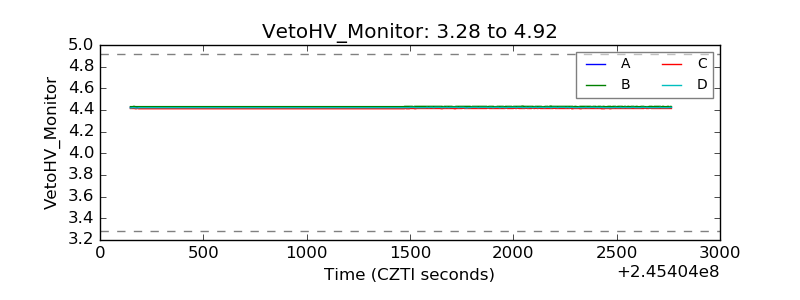 |
| Veto LLD | 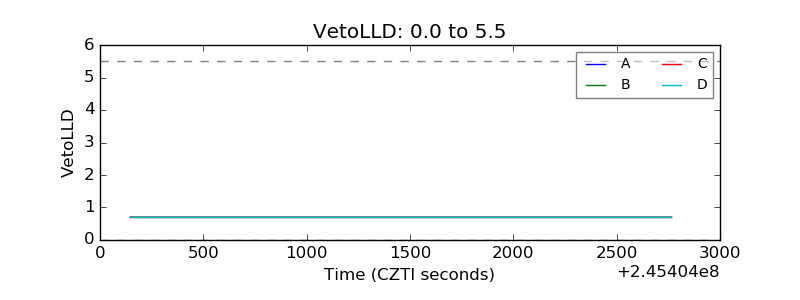 |
| Alpha Counter | 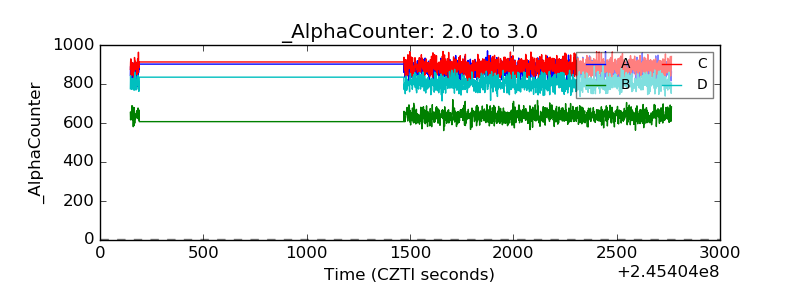 |
| _CPM_Rate | 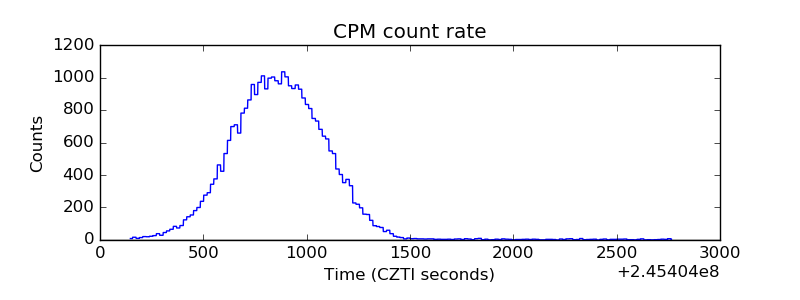 |
| CZT Counter | 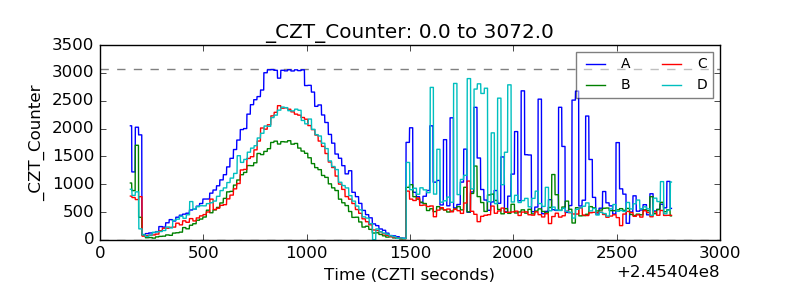 |
| +2.5 Volts monitor |  |
| +5 Volts monitor | 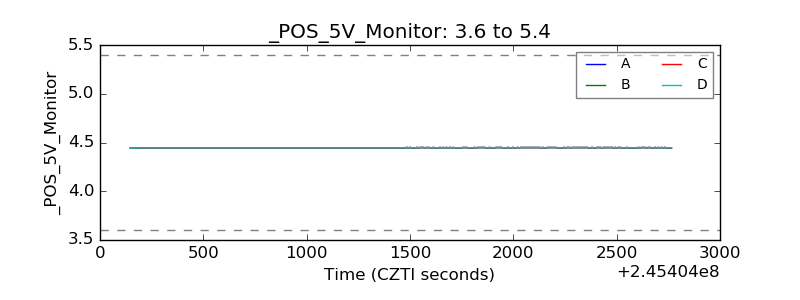 |
| _ROLL_ROT | 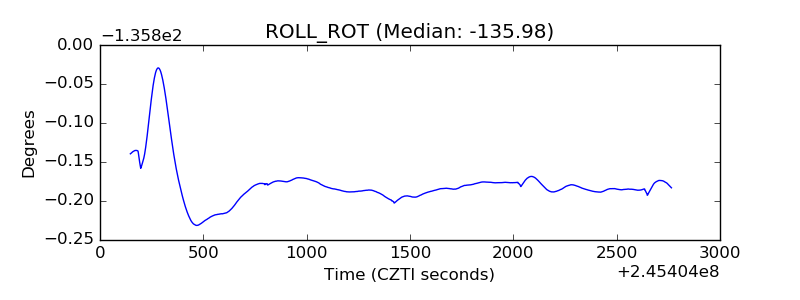 |
| _Roll_DEC | 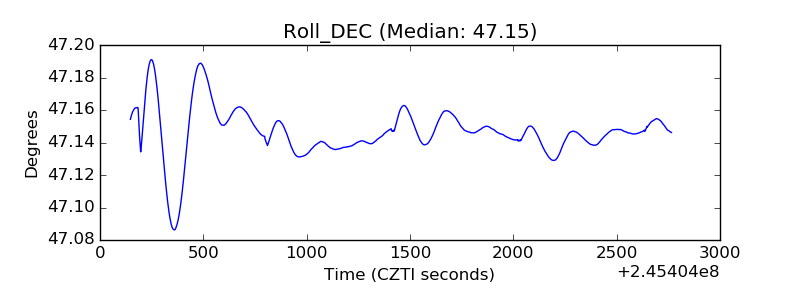 |
| _Roll_RA | 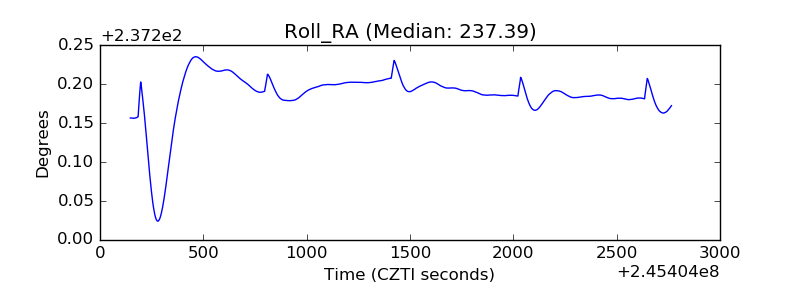 |
| Veto Counter | 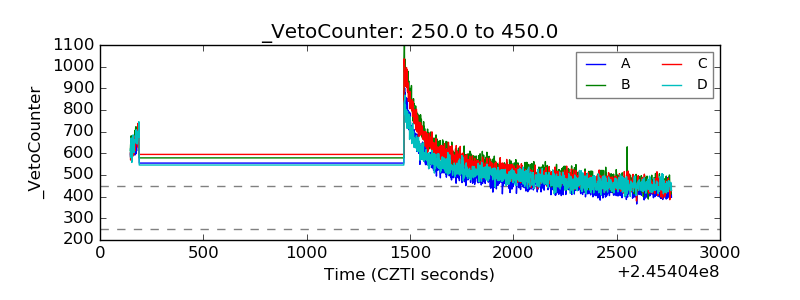 |