| Param | Original file | Final file |
|---|---|---|
| Filename | modeM0/AS1G08_046T09_9000001600_11017cztM0_level2.evt | modeM0/AS1G08_046T09_9000001600_11017cztM0_level2_quad_clean.evt |
| Size (bytes) | 767,770,560 | 85,504,320 |
| Size | 732.2 MB | 81.5 MB |
| Events in quadrant A | 10,749,070 | 409,225 |
| Events in quadrant B | 4,471,003 | 578,093 |
| Events in quadrant C | 3,017,367 | 580,395 |
| Events in quadrant D | 4,561,402 | 553,176 |
| Mode M0 | |||
|---|---|---|---|
| Quadrant | BADHDUFLAG | Total packets | Discarded packets |
| A | 0 | 36715 | 149 |
| B | 0 | 17779 | 24 |
| C | 0 | 13741 | 7 |
| D | 0 | 17959 | 50 |
| Mode M9 | |||
|---|---|---|---|
| Quadrant | BADHDUFLAG | Total packets | Discarded packets |
| A | 0 | 8 | 0 |
| B | 0 | 8 | 0 |
| C | 0 | 8 | 0 |
| D | 0 | 8 | 0 |
| Mode SS | |||
|---|---|---|---|
| Quadrant | BADHDUFLAG | Total packets | Discarded packets |
| A | 0 | 136 | 0 |
| B | 0 | 136 | 0 |
| C | 0 | 136 | 0 |
| D | 0 | 136 | 0 |
| Quadrant | Total seconds | Saturated seconds | Saturation percentage |
|---|---|---|---|
| A | 6689 | 3117 | 46.598894% |
| B | 6705 | 438 | 6.532438% |
| C | 6710 | 51 | 0.760060% |
| D | 6699 | 265 | 3.955814% |
Noise dominated data is calculated using 1-second bins in cleaned event files. If a bin has >2000 counts, and if more than 50% of those come from <1% of pixels, then it is considered to be noise-dominated and hence unusable.
| Quadrant | # 1 sec bins | Bins with >0 counts | Bins with >2000 counts | High rate bins dominated by noise | Noise dominated (total time) | Noise dominated (detector-on time) | Marked lightcurve |
|---|---|---|---|---|---|---|---|
| A | 7543 | 6706 | 2630 | 2630 | 34.87% | 39.22% | 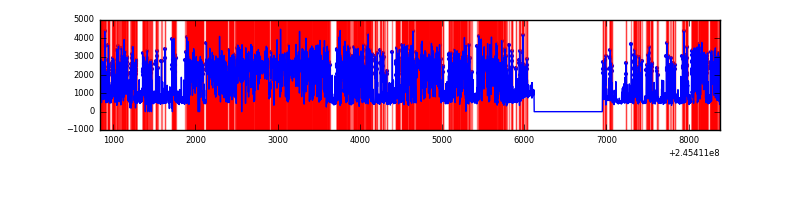 |
| B | 7543 | 6714 | 245 | 245 | 3.25% | 3.65% | 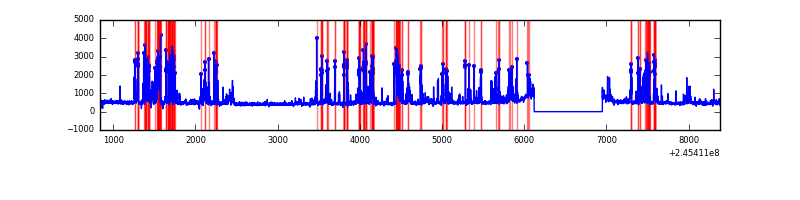 |
| C | 7543 | 6714 | 0 | 0 | 0.00% | 0.00% | 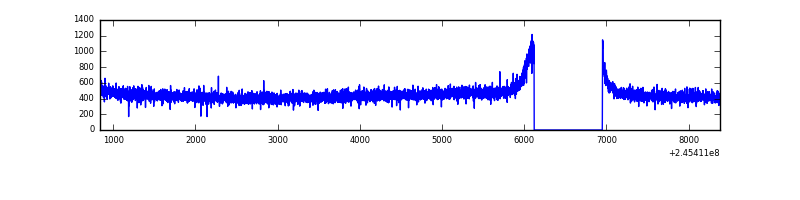 |
| D | 7543 | 6712 | 183 | 183 | 2.43% | 2.73% | 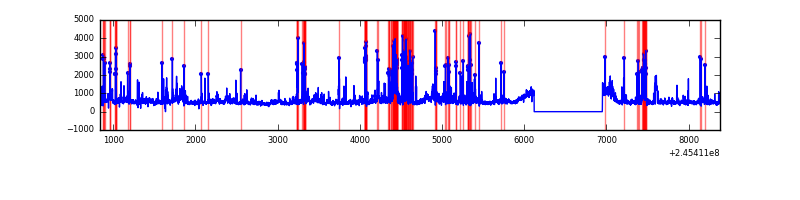 |
Top three noisy pixels from each quadrant. If the there are fewer than three noisy pixels in the level2.evt file, extra rows are filled as -1
| Pixel properties | Quadrant properties | ||||||
|---|---|---|---|---|---|---|---|
| Quadrant | DetID | PixID | Counts | Sigma | Mean | Median | Sigma |
| A | 14 | 238 | 8076455 | 65113.1 | 605 | 592 | 124.0 |
| A | 8 | 5 | 309746 | 2492.61 | 605 | 592 | 124.0 |
| A | 15 | 174 | 12563 | 96.52 | 605 | 592 | 124.0 |
| B | 4 | 239 | 1332789 | 8888.54 | 780 | 760 | 149.9 |
| B | 0 | 214 | 37928 | 248.02 | 780 | 760 | 149.9 |
| B | 4 | 81 | 26007 | 168.47 | 780 | 760 | 149.9 |
| C | 13 | 61 | 5698 | 27.58 | 773 | 778 | 178.4 |
| C | 5 | 207 | 2398 | 9.08 | 773 | 778 | 178.4 |
| C | 14 | 234 | 2164 | 7.77 | 773 | 778 | 178.4 |
| D | 11 | 129 | 511180 | 2784.59 | 768 | 748 | 183.3 |
| D | 10 | 253 | 441392 | 2403.87 | 768 | 748 | 183.3 |
| D | 2 | 14 | 173697 | 943.5 | 768 | 748 | 183.3 |
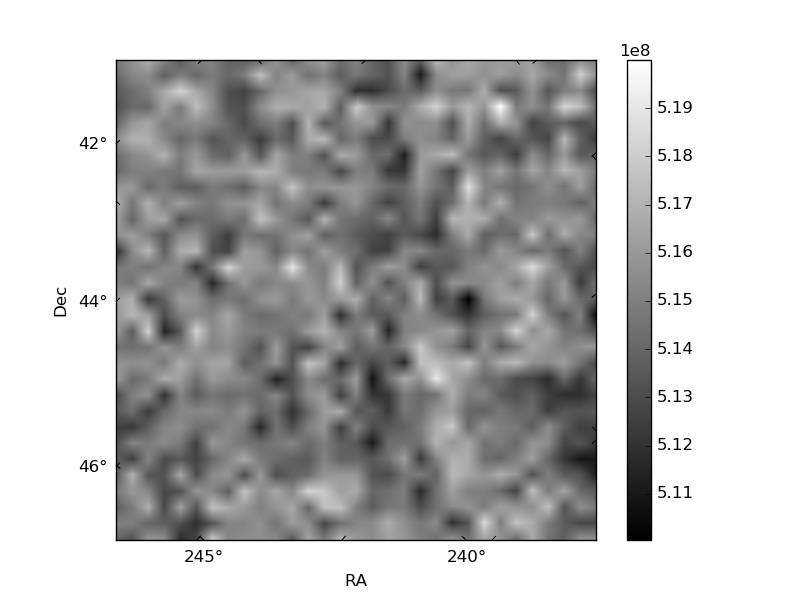
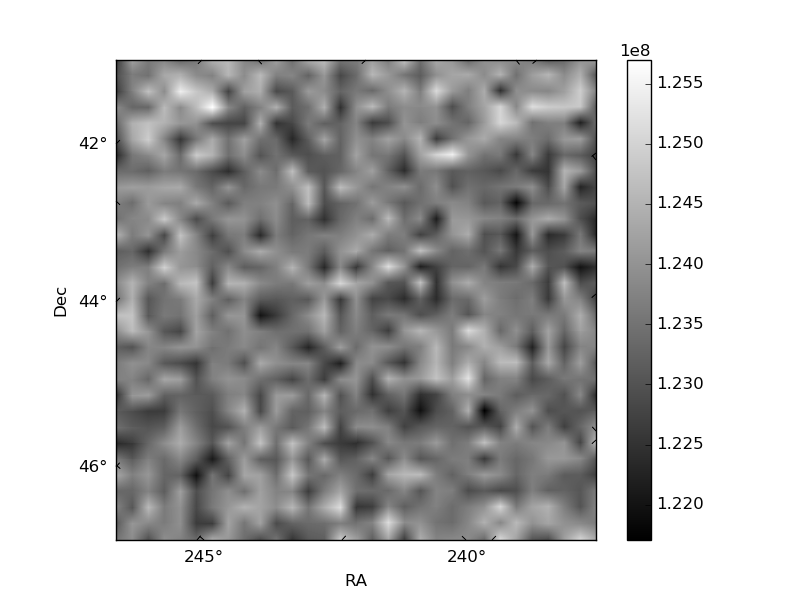
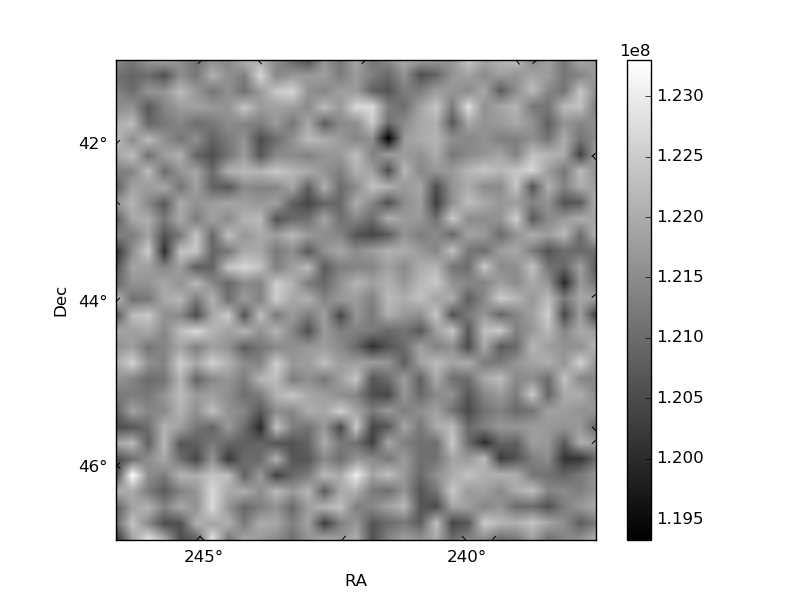
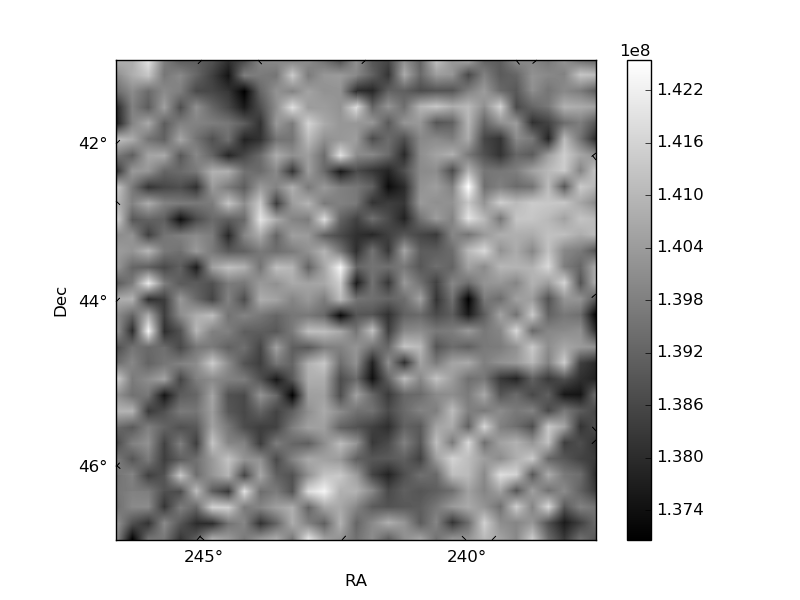
Histogram calculated using DETX and DETY for each event in the final _common_clean file
| Quadrant A | 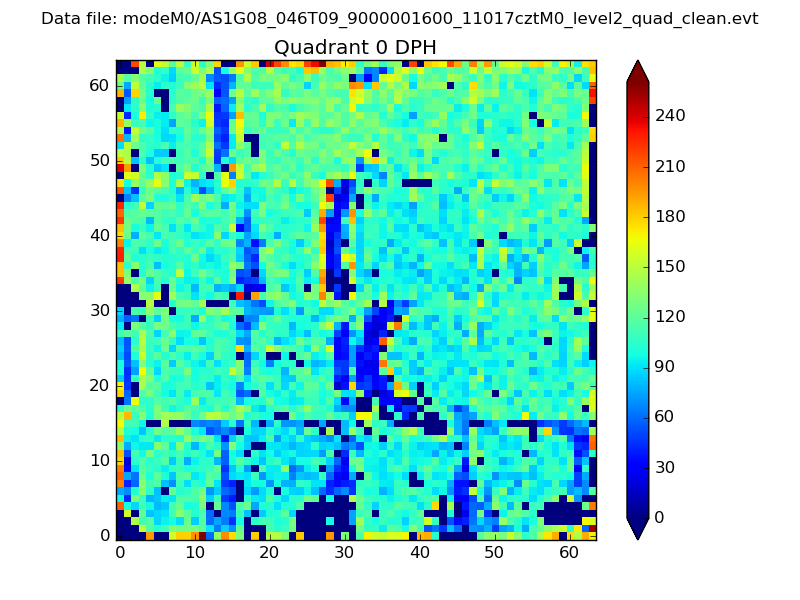 |
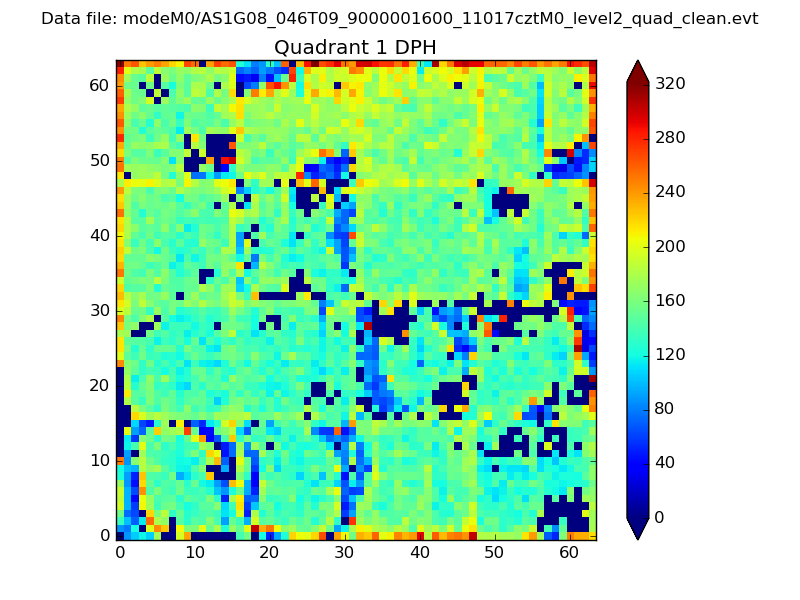 |
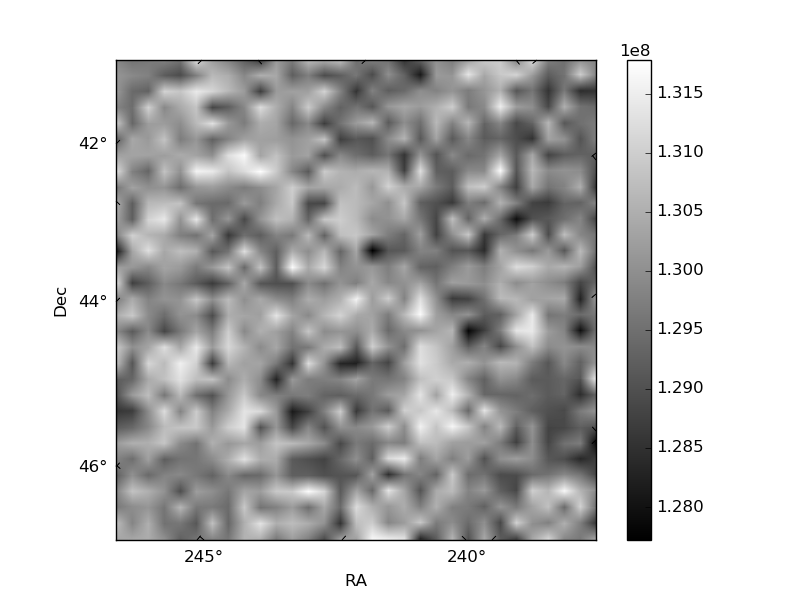
Quadrant B |
|---|---|---|---|
| Quadrant D | 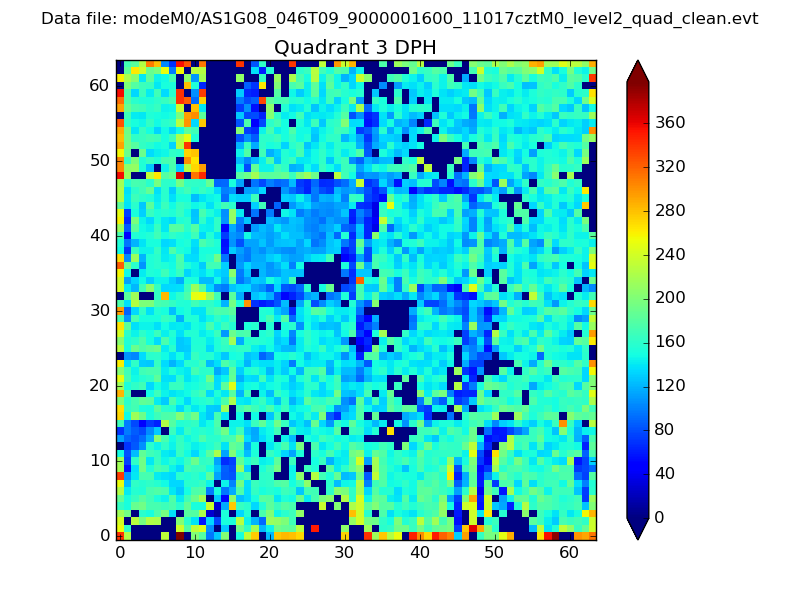 |
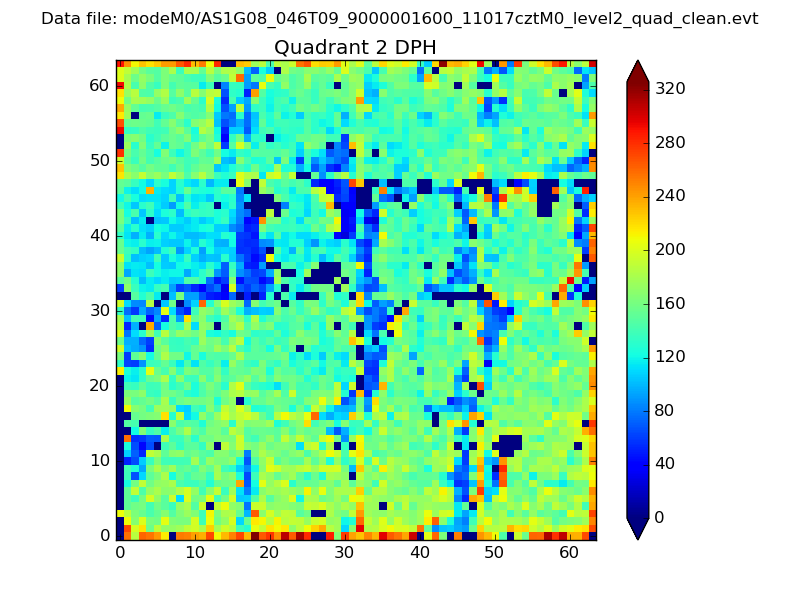 |
Quadrant C |
| Plot type | Count rate plots | Images |
|---|---|---|
| Comparison with Poisson distribution Blue bars denote a histogram of data divided into 1 sec bins. Red curve is a Poisson curve with rate = median count rate of data. |
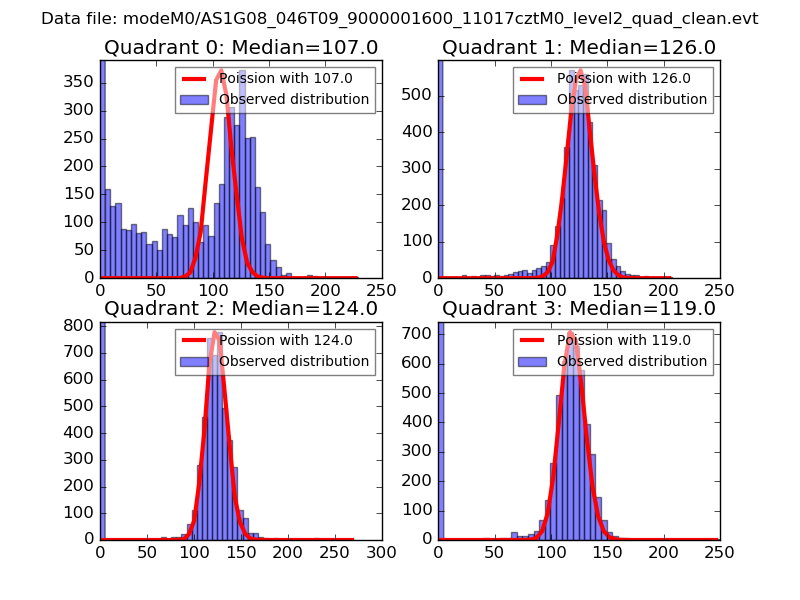 |
 |
| Quadrant-wise count rates Data is divided into 100 sec bins |
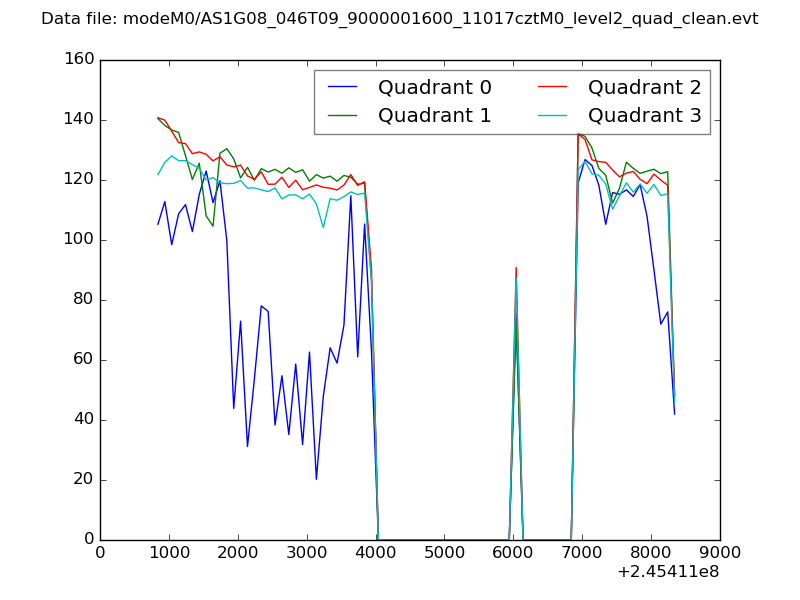 |
|
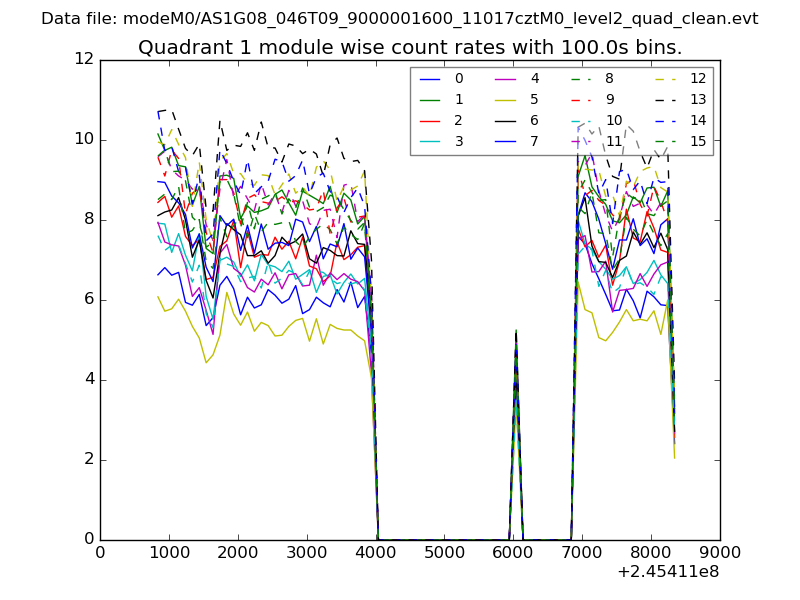
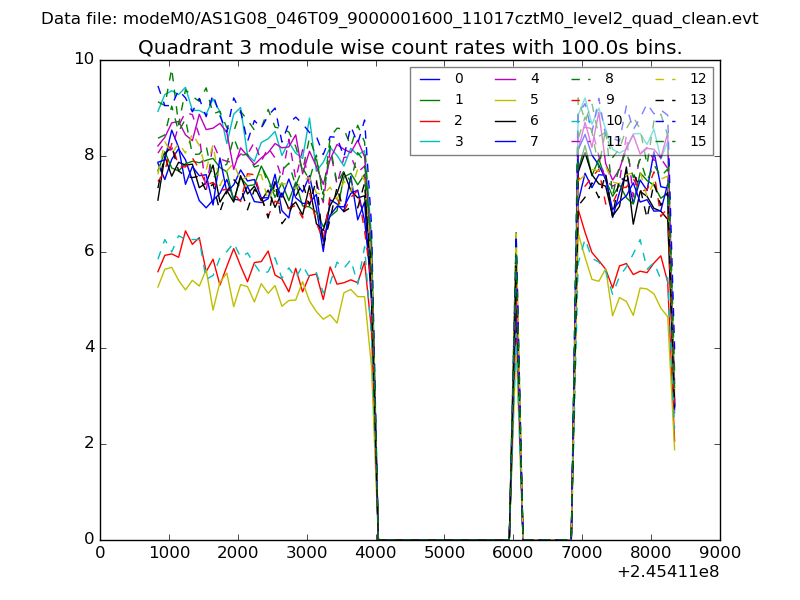
| Module-wise count rates for Quadrant A Data is divided into 100 sec bins |
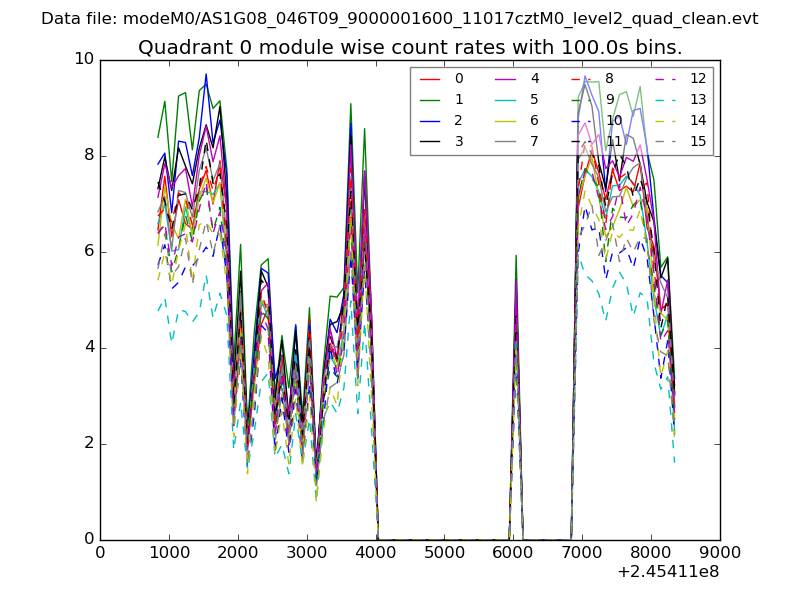 |
 |
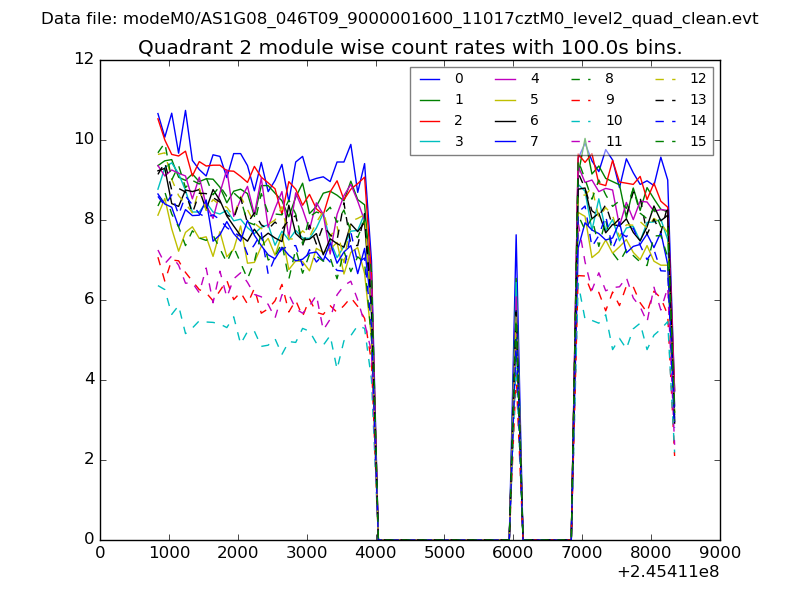
| Module-wise count rates for Quadrant B Data is divided into 100 sec bins |
 |
 |
| Module-wise count rates for Quadrant C Data is divided into 100 sec bins |
 |
 |
| Module-wise count rates for Quadrant D Data is divided into 100 sec bins |
 |
 |
| Parameter | Plot |
|---|---|
| CZT HV Monitor | 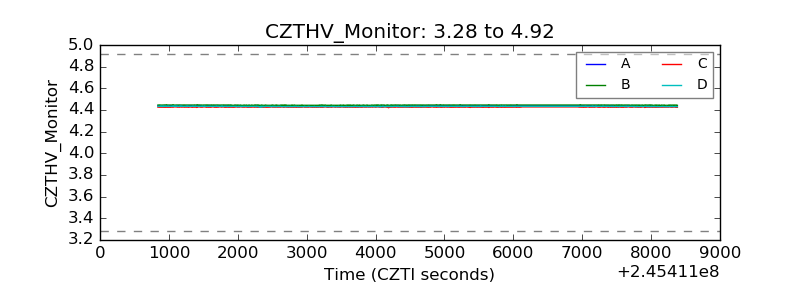 |
| D_VDD | 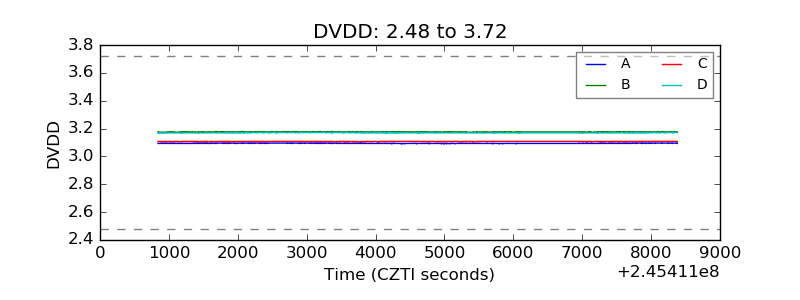 |
| Temperature 1 | 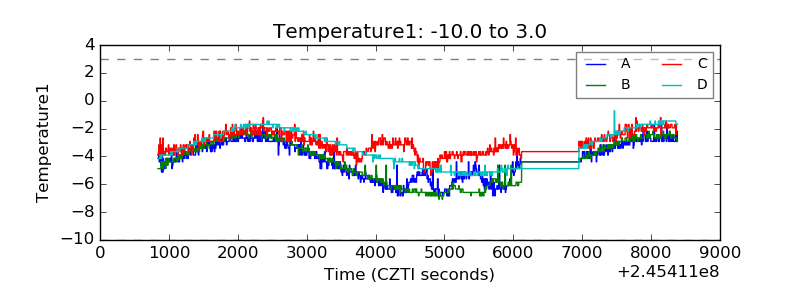 |
| Veto HV Monitor | 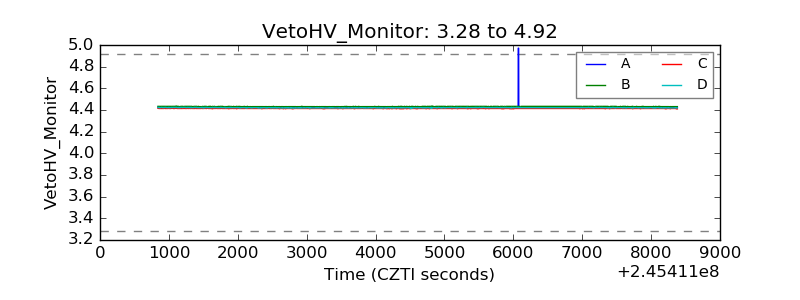 |
| Veto LLD | 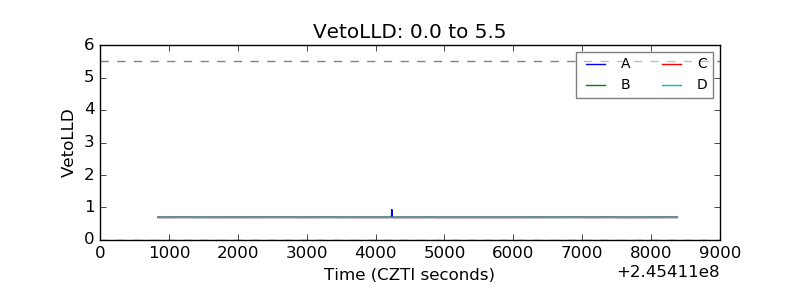 |
| Alpha Counter | 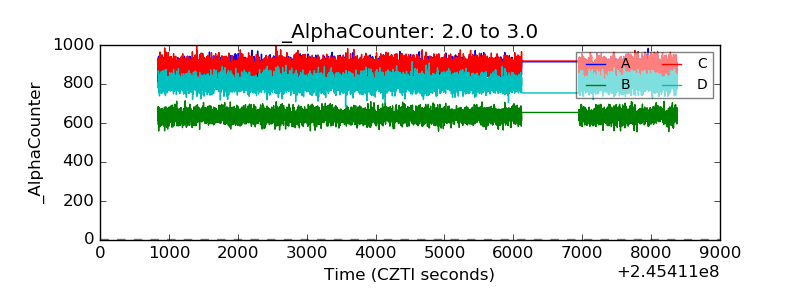 |
| _CPM_Rate | 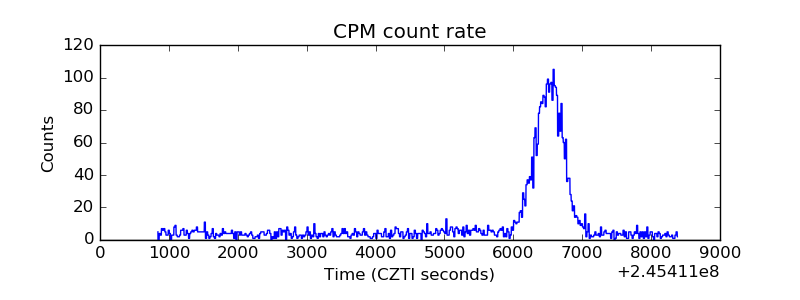 |
| CZT Counter | 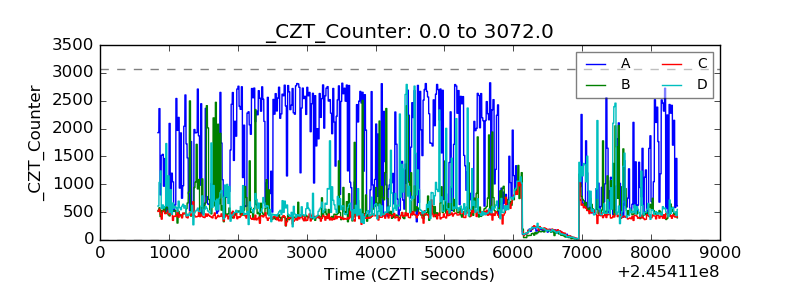 |
| +2.5 Volts monitor | 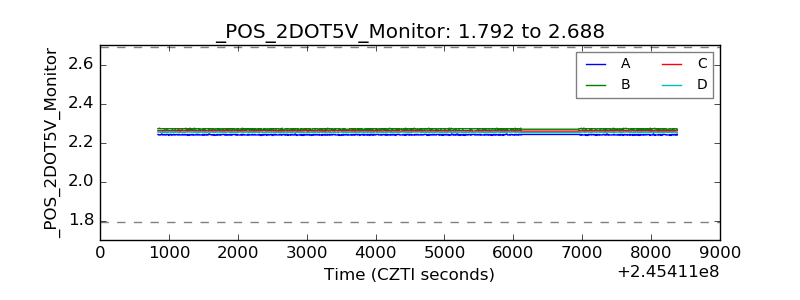 |
| +5 Volts monitor |  |
| _ROLL_ROT | 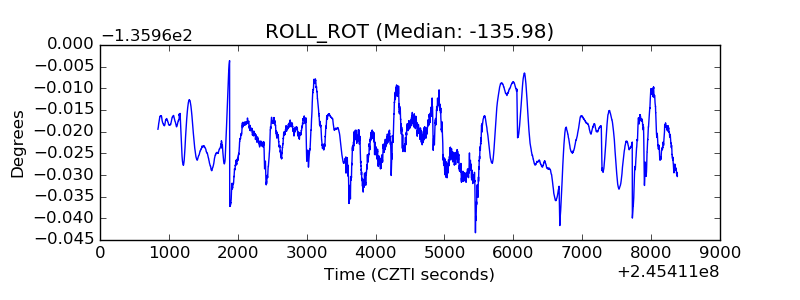 |
| _Roll_DEC | 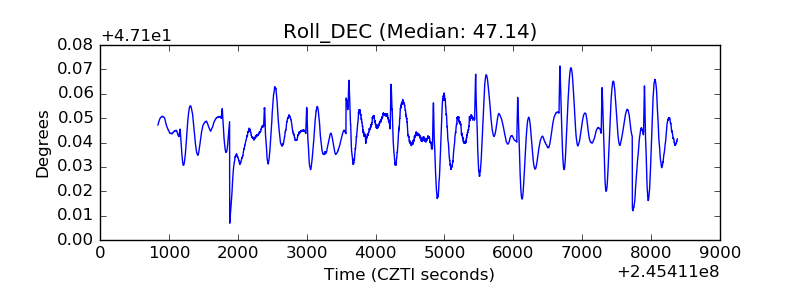 |
| _Roll_RA | 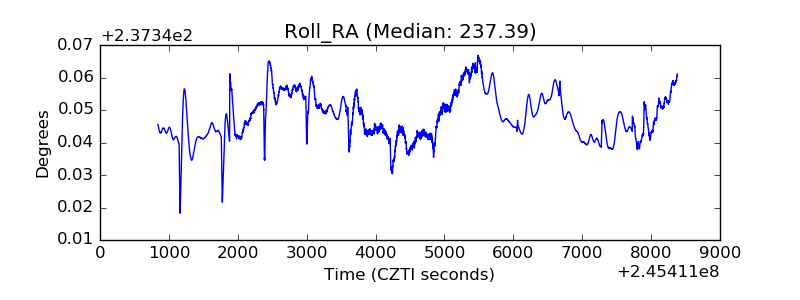 |
| Veto Counter | 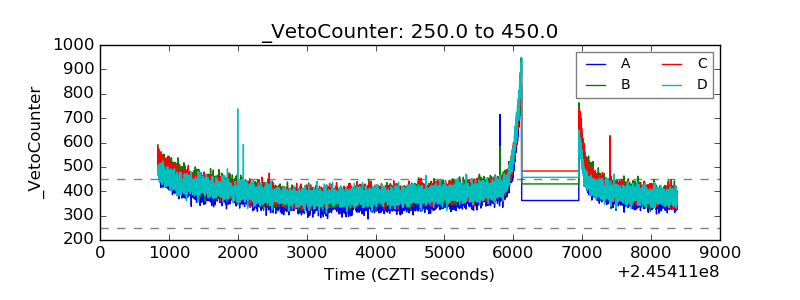 |