| Param | Original file | Final file |
|---|---|---|
| Filename | modeM0/AS1G08_046T09_9000001600_11018cztM0_level2.evt | modeM0/AS1G08_046T09_9000001600_11018cztM0_level2_quad_clean.evt |
| Size (bytes) | 114,949,440 | 19,523,520 |
| Size | 109.6 MB | 18.6 MB |
| Events in quadrant A | 1,393,817 | 98,785 |
| Events in quadrant B | 688,952 | 139,757 |
| Events in quadrant C | 514,713 | 139,382 |
| Events in quadrant D | 805,926 | 128,487 |
| Mode M0 | |||
|---|---|---|---|
| Quadrant | BADHDUFLAG | Total packets | Discarded packets |
| A | 0 | 7908 | 3077 |
| B | 0 | 4007 | 1229 |
| C | 0 | 3452 | 1120 |
| D | 0 | 4872 | 1666 |
| Mode M9 | |||
|---|---|---|---|
| Quadrant | BADHDUFLAG | Total packets | Discarded packets |
| A | 0 | 2 | 1 |
| B | 0 | 4 | 4 |
| C | 0 | 3 | 2 |
| D | 0 | 2 | 1 |
| Mode SS | |||
|---|---|---|---|
| Quadrant | BADHDUFLAG | Total packets | Discarded packets |
| A | 0 | 34 | 12 |
| B | 0 | 34 | 14 |
| C | 0 | 35 | 13 |
| D | 0 | 33 | 13 |
| Quadrant | Total seconds | Saturated seconds | Saturation percentage |
|---|---|---|---|
| A | 1042 | 407 | 39.059501% |
| B | 1138 | 53 | 4.657293% |
| C | 1139 | 7 | 0.614574% |
| D | 1112 | 34 | 3.057554% |
Noise dominated data is calculated using 1-second bins in cleaned event files. If a bin has >2000 counts, and if more than 50% of those come from <1% of pixels, then it is considered to be noise-dominated and hence unusable.
| Quadrant | # 1 sec bins | Bins with >0 counts | Bins with >2000 counts | High rate bins dominated by noise | Noise dominated (total time) | Noise dominated (detector-on time) | Marked lightcurve |
|---|---|---|---|---|---|---|---|
| A | 2149 | 1109 | 286 | 286 | 13.31% | 25.79% | 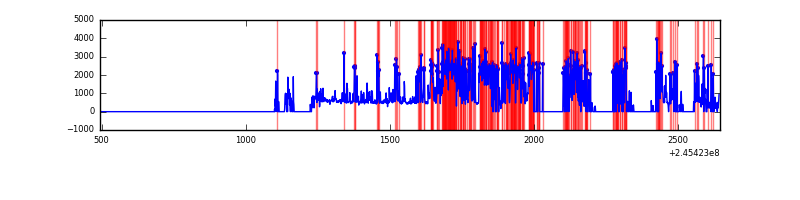 |
| B | 1542 | 1230 | 15 | 15 | 0.97% | 1.22% | 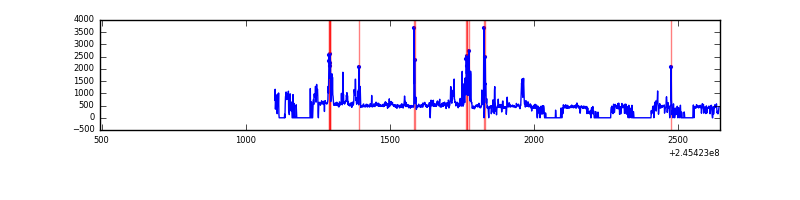 |
| C | 1545 | 1246 | 0 | 0 | 0.00% | 0.00% | 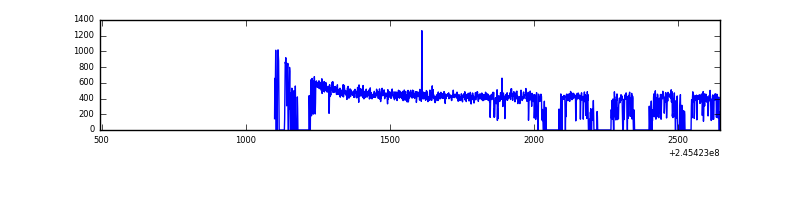 |
| D | 1544 | 1201 | 18 | 18 | 1.17% | 1.50% | 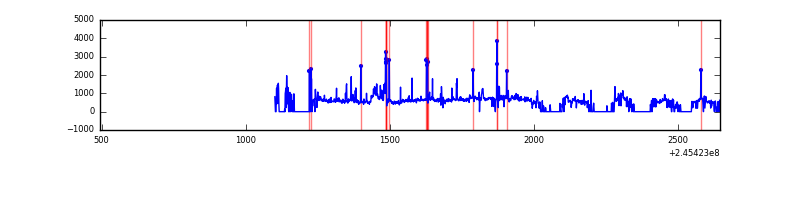 |
Top three noisy pixels from each quadrant. If the there are fewer than three noisy pixels in the level2.evt file, extra rows are filled as -1
| Pixel properties | Quadrant properties | ||||||
|---|---|---|---|---|---|---|---|
| Quadrant | DetID | PixID | Counts | Sigma | Mean | Median | Sigma |
| A | 14 | 238 | 956279 | 41866.62 | 102 | 100 | 22.8 |
| A | 8 | 5 | 40371 | 1763.28 | 102 | 100 | 22.8 |
| A | 14 | 254 | 1115 | 44.44 | 102 | 100 | 22.8 |
| B | 4 | 239 | 122306 | 4348.87 | 135 | 131 | 28.1 |
| B | 0 | 214 | 13733 | 484.17 | 135 | 131 | 28.1 |
| B | 0 | 219 | 7718 | 270.06 | 135 | 131 | 28.1 |
| C | 12 | 4 | 1213 | 33.75 | 131 | 131 | 32.1 |
| C | 13 | 61 | 1012 | 27.48 | 131 | 131 | 32.1 |
| C | 5 | 207 | 368 | 7.39 | 131 | 131 | 32.1 |
| D | 8 | 195 | 124515 | 3784.92 | 128 | 124 | 32.9 |
| D | 11 | 129 | 81217 | 2467.47 | 128 | 124 | 32.9 |
| D | 2 | 14 | 35083 | 1063.72 | 128 | 124 | 32.9 |
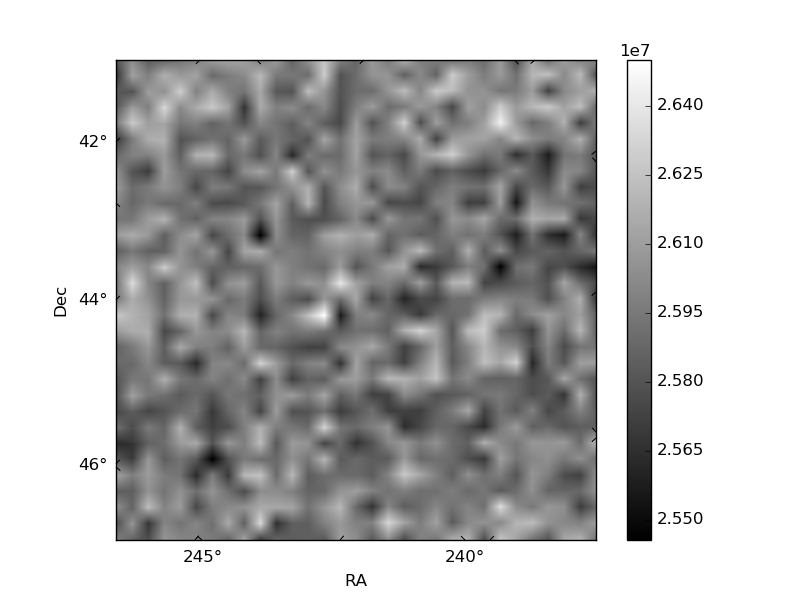
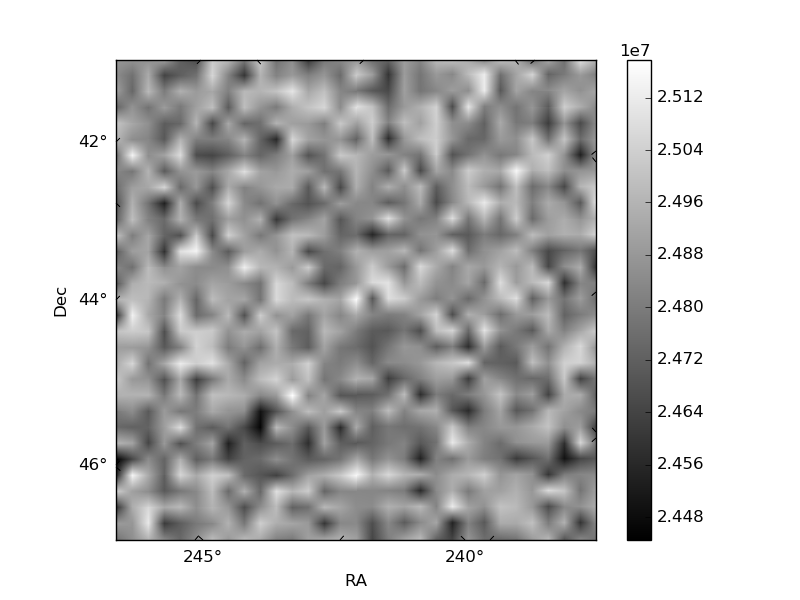
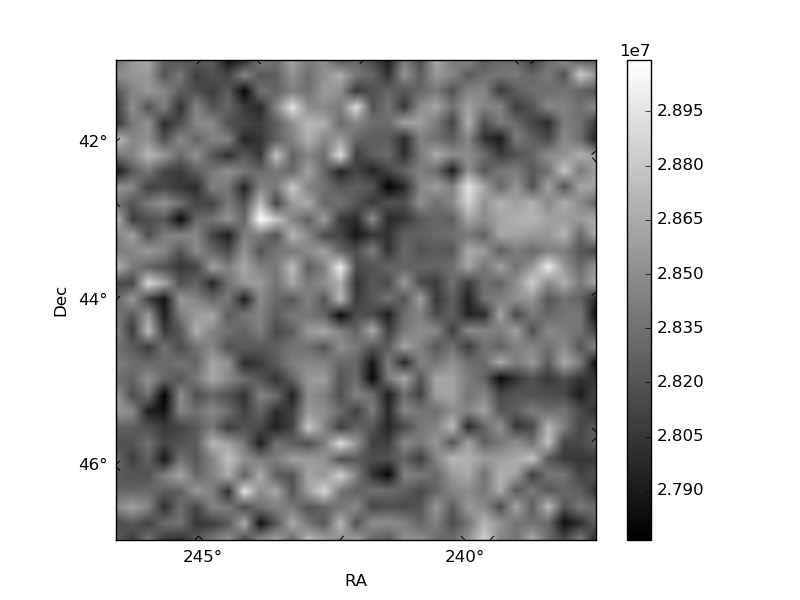
Histogram calculated using DETX and DETY for each event in the final _common_clean file
| Quadrant A |  |
 |
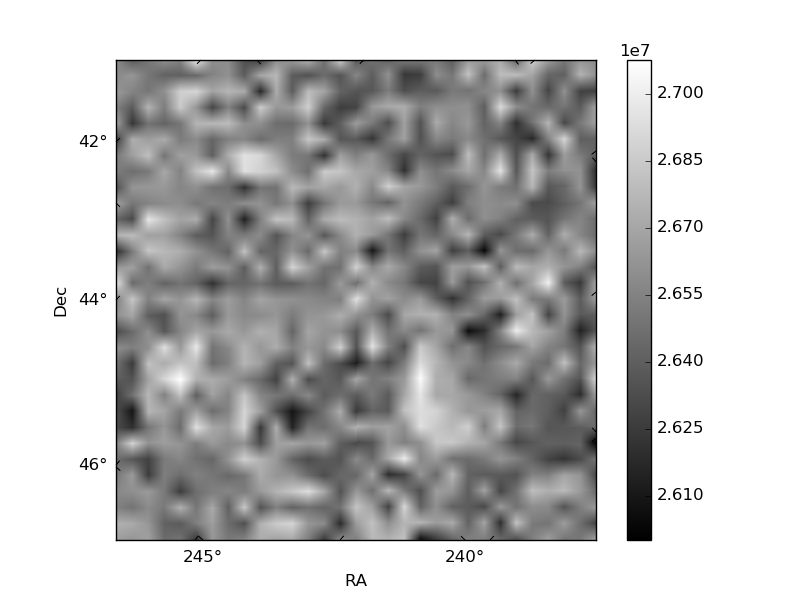
Quadrant B |
|---|---|---|---|
| Quadrant D | 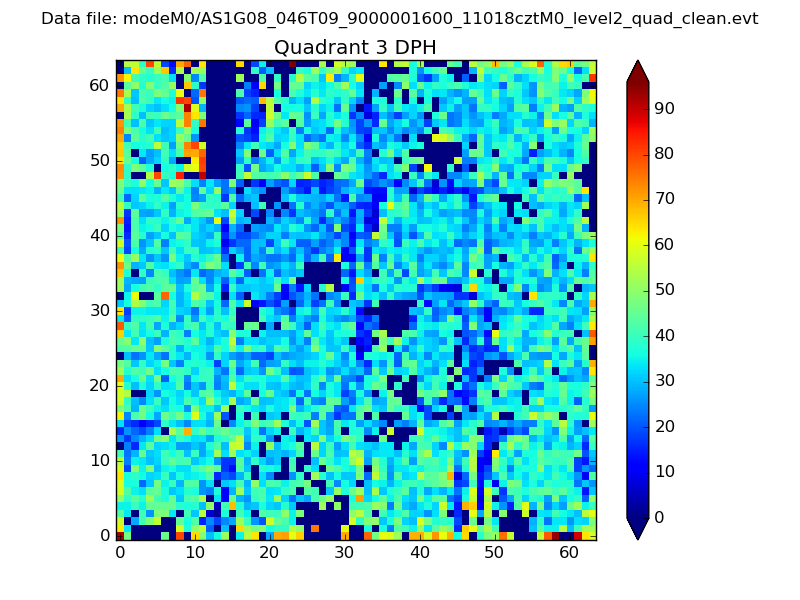 |
 |
Quadrant C |
| Plot type | Count rate plots | Images |
|---|---|---|
| Comparison with Poisson distribution Blue bars denote a histogram of data divided into 1 sec bins. Red curve is a Poisson curve with rate = median count rate of data. |
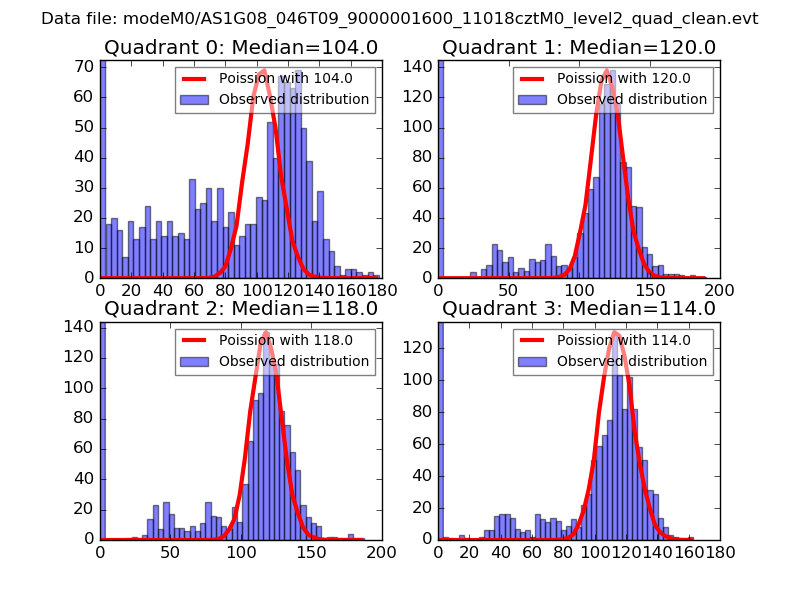 |
 |
| Quadrant-wise count rates Data is divided into 100 sec bins |
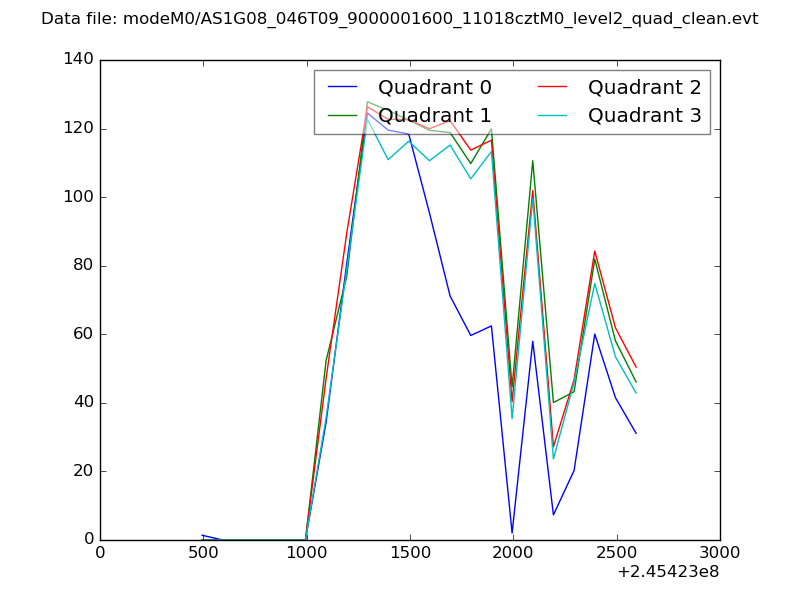 |
|
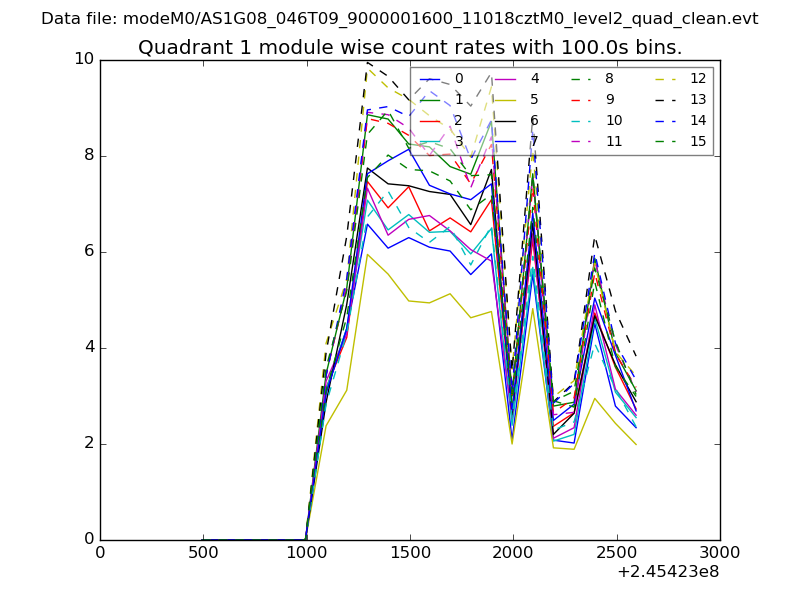
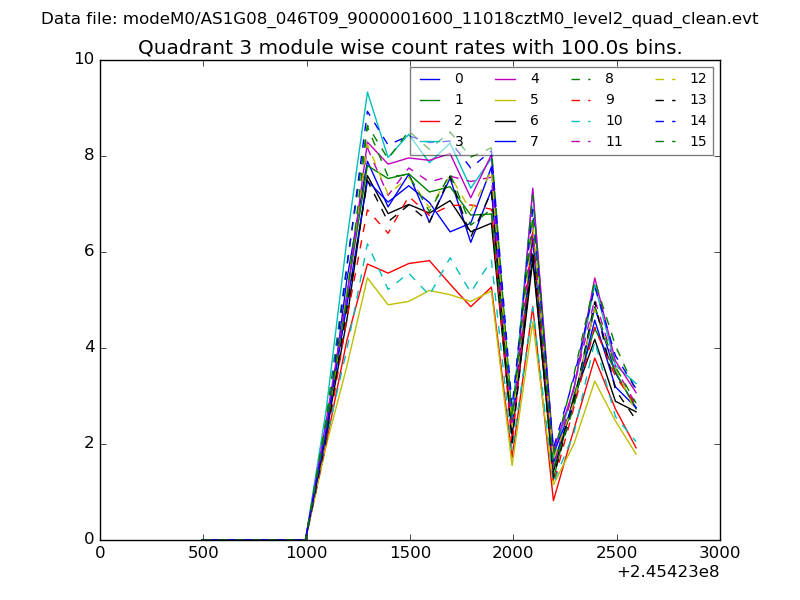
| Module-wise count rates for Quadrant A Data is divided into 100 sec bins |
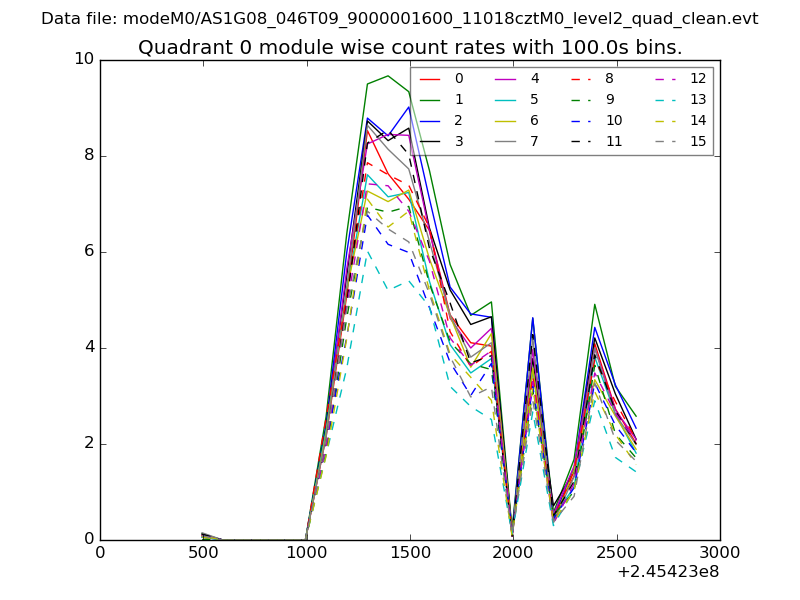 |
 |
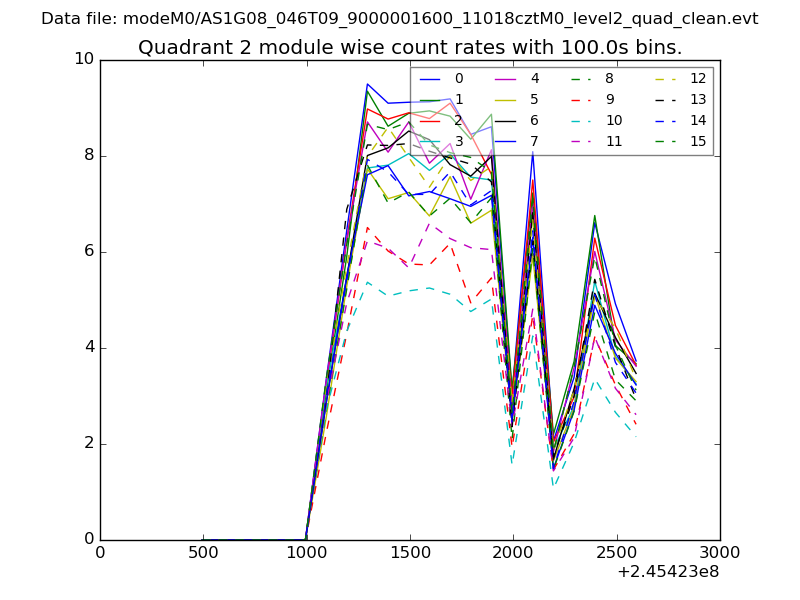
| Module-wise count rates for Quadrant B Data is divided into 100 sec bins |
 |
 |
| Module-wise count rates for Quadrant C Data is divided into 100 sec bins |
 |
 |
| Module-wise count rates for Quadrant D Data is divided into 100 sec bins |
 |
 |
| Parameter | Plot |
|---|---|
| CZT HV Monitor | 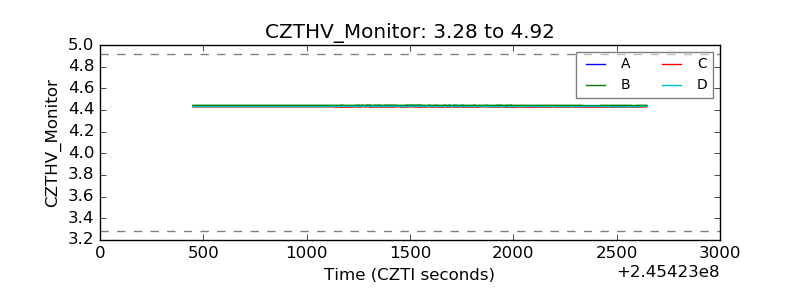 |
| D_VDD | 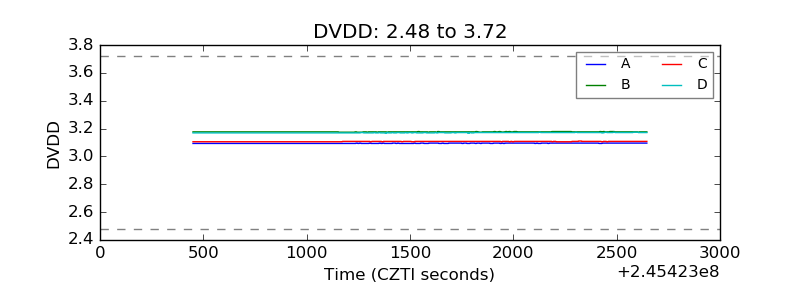 |
| Temperature 1 | 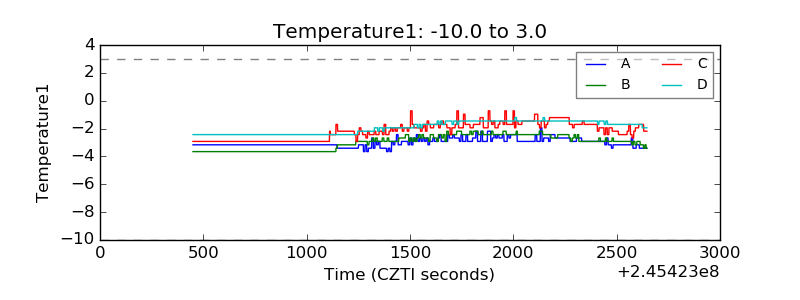 |
| Veto HV Monitor | 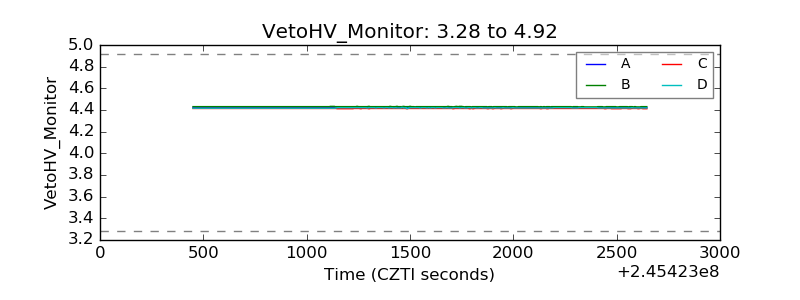 |
| Veto LLD | 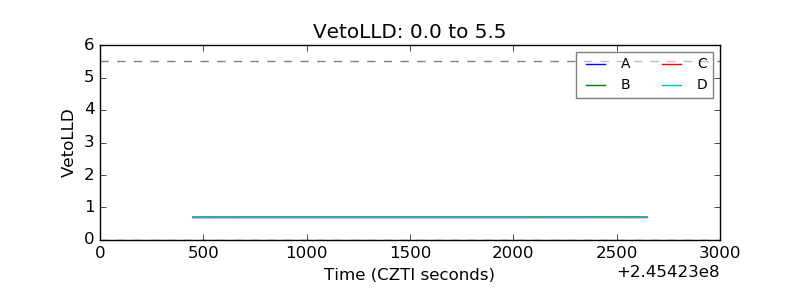 |
| Alpha Counter | 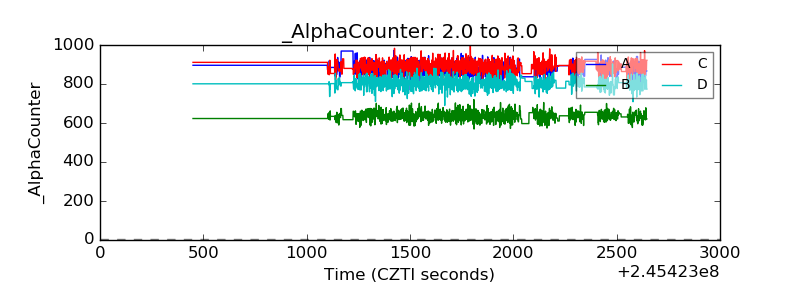 |
| _CPM_Rate | 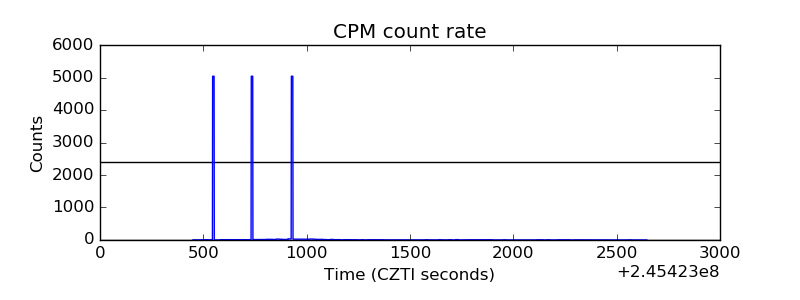 |
| CZT Counter |  |
| +2.5 Volts monitor |  |
| +5 Volts monitor |  |
| _ROLL_ROT |  |
| _Roll_DEC | 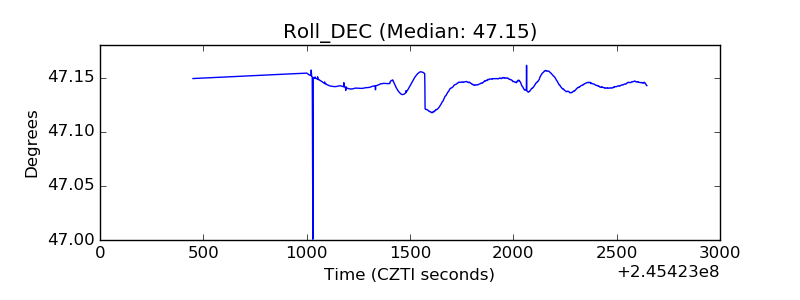 |
| _Roll_RA |  |
| Veto Counter | 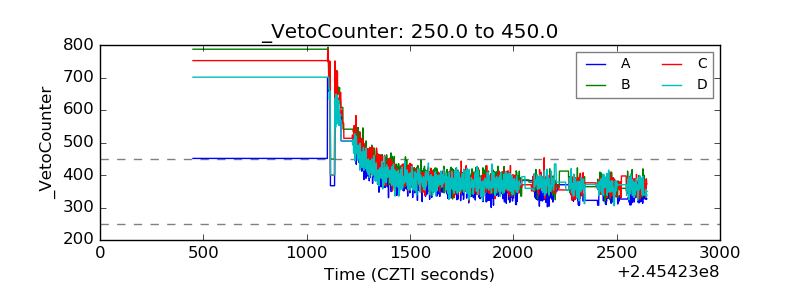 |