| Param | Original file | Final file |
|---|---|---|
| Filename | modeM0/AS1G08_046T09_9000001600_11019cztM0_level2.evt | modeM0/AS1G08_046T09_9000001600_11019cztM0_level2_quad_clean.evt |
| Size (bytes) | 1,241,187,840 | 163,514,880 |
| Size | 1.2 GB | 155.9 MB |
| Events in quadrant A | 12,972,355 | 906,021 |
| Events in quadrant B | 8,531,906 | 1,064,609 |
| Events in quadrant C | 5,773,518 | 1,082,583 |
| Events in quadrant D | 9,452,666 | 1,017,517 |
| Mode M0 | |||
|---|---|---|---|
| Quadrant | BADHDUFLAG | Total packets | Discarded packets |
| A | 0 | 48084 | 930 |
| B | 0 | 34148 | 192 |
| C | 0 | 26524 | 86 |
| D | 0 | 36966 | 257 |
| Mode M9 | |||
|---|---|---|---|
| Quadrant | BADHDUFLAG | Total packets | Discarded packets |
| A | 0 | 4 | 0 |
| B | 0 | 4 | 0 |
| C | 0 | 4 | 0 |
| D | 0 | 4 | 0 |
| Mode SS | |||
|---|---|---|---|
| Quadrant | BADHDUFLAG | Total packets | Discarded packets |
| A | 0 | 258 | 0 |
| B | 0 | 258 | 0 |
| C | 0 | 258 | 0 |
| D | 0 | 258 | 2 |
| Quadrant | Total seconds | Saturated seconds | Saturation percentage |
|---|---|---|---|
| A | 12663 | 2733 | 21.582563% |
| B | 12747 | 857 | 6.723151% |
| C | 12772 | 97 | 0.759474% |
| D | 12734 | 726 | 5.701272% |
Noise dominated data is calculated using 1-second bins in cleaned event files. If a bin has >2000 counts, and if more than 50% of those come from <1% of pixels, then it is considered to be noise-dominated and hence unusable.
| Quadrant | # 1 sec bins | Bins with >0 counts | Bins with >2000 counts | High rate bins dominated by noise | Noise dominated (total time) | Noise dominated (detector-on time) | Marked lightcurve |
|---|---|---|---|---|---|---|---|
| A | 13165 | 12726 | 2106 | 2106 | 16.00% | 16.55% | 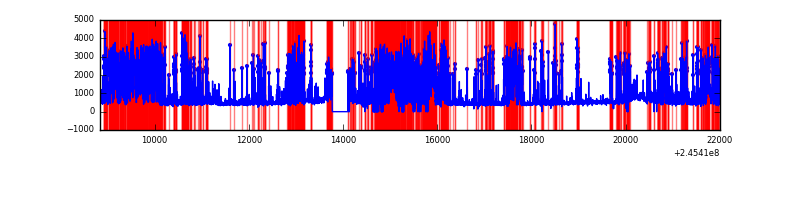 |
| B | 13165 | 12800 | 395 | 395 | 3.00% | 3.09% | 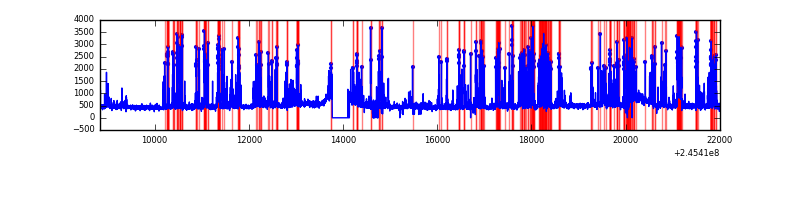 |
| C | 13165 | 12815 | 0 | 0 | 0.00% | 0.00% | 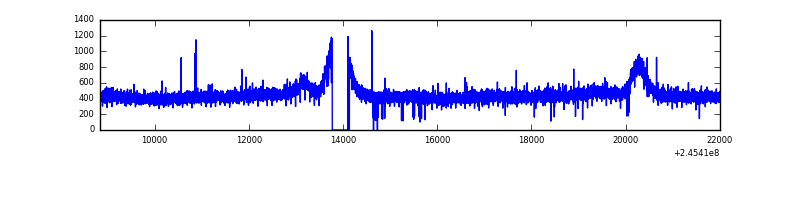 |
| D | 13165 | 12797 | 510 | 510 | 3.87% | 3.99% | 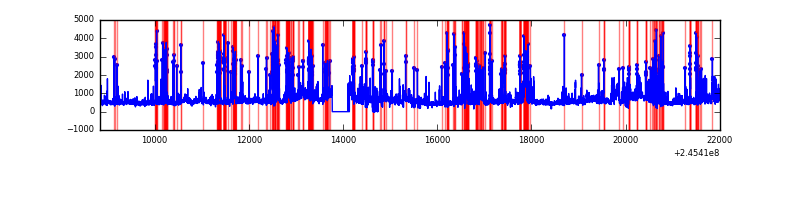 |
Top three noisy pixels from each quadrant. If the there are fewer than three noisy pixels in the level2.evt file, extra rows are filled as -1
| Pixel properties | Quadrant properties | ||||||
|---|---|---|---|---|---|---|---|
| Quadrant | DetID | PixID | Counts | Sigma | Mean | Median | Sigma |
| A | 14 | 238 | 6964481 | 25463.35 | 1351 | 1321 | 273.5 |
| A | 8 | 5 | 770358 | 2812.27 | 1351 | 1321 | 273.5 |
| A | 14 | 254 | 20408 | 69.8 | 1351 | 1321 | 273.5 |
| B | 4 | 239 | 2610895 | 9158.56 | 1481 | 1447 | 284.9 |
| B | 0 | 214 | 79012 | 272.24 | 1481 | 1447 | 284.9 |
| B | 15 | 204 | 34721 | 116.78 | 1481 | 1447 | 284.9 |
| C | 13 | 61 | 11005 | 27.68 | 1479 | 1485 | 344.0 |
| C | 14 | 67 | 5250 | 10.95 | 1479 | 1485 | 344.0 |
| C | 14 | 234 | 3780 | 6.67 | 1479 | 1485 | 344.0 |
| D | 1 | 52 | 845895 | 2427.77 | 1449 | 1408 | 347.8 |
| D | 2 | 14 | 698020 | 2002.65 | 1449 | 1408 | 347.8 |
| D | 10 | 253 | 629444 | 1805.51 | 1449 | 1408 | 347.8 |
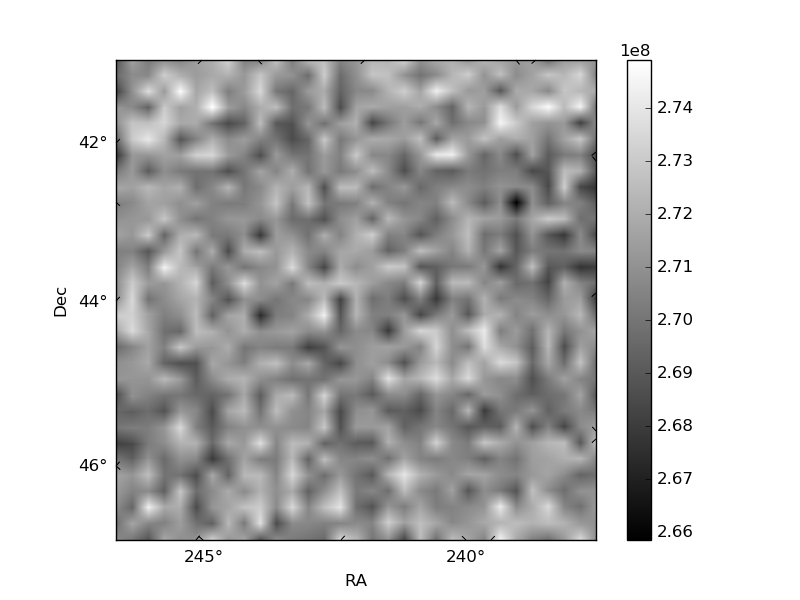
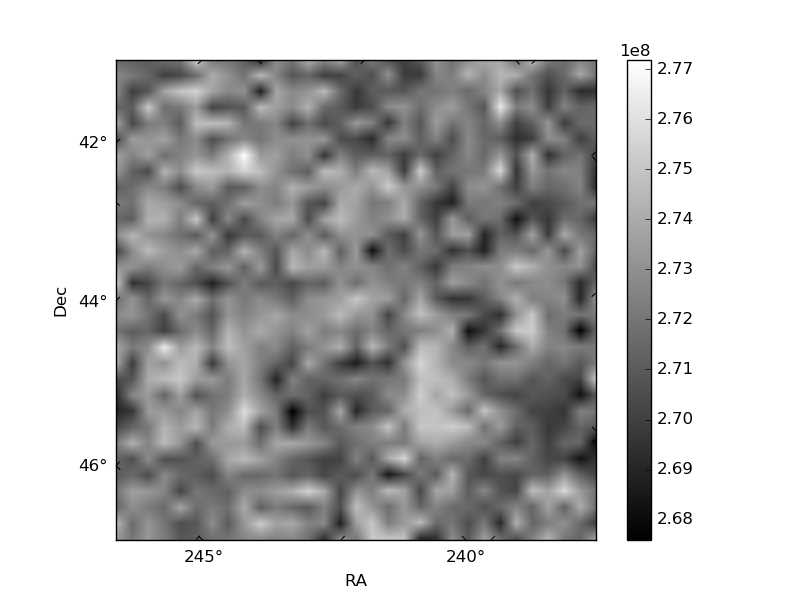
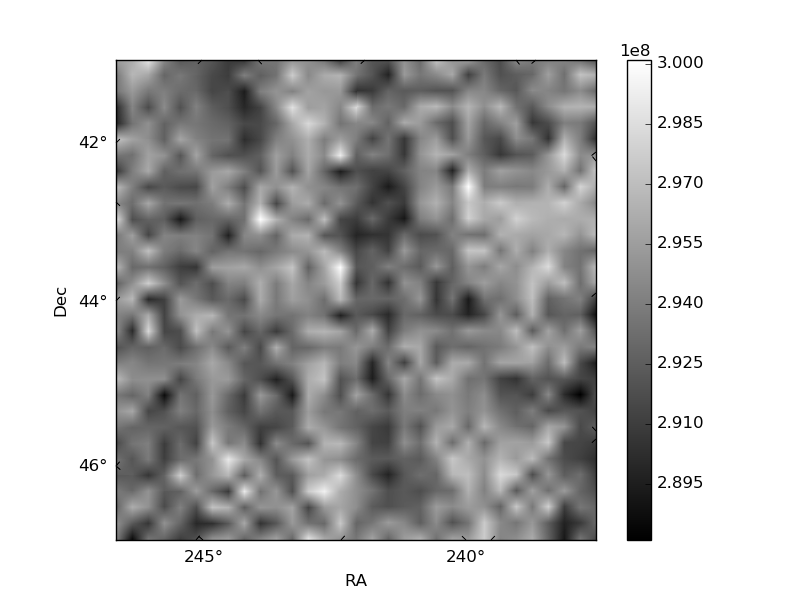
Histogram calculated using DETX and DETY for each event in the final _common_clean file
| Quadrant A | 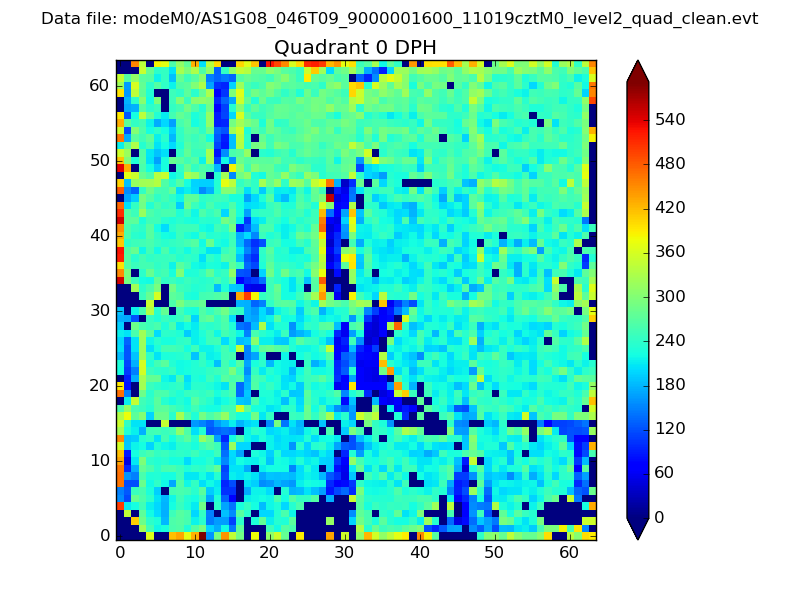 |
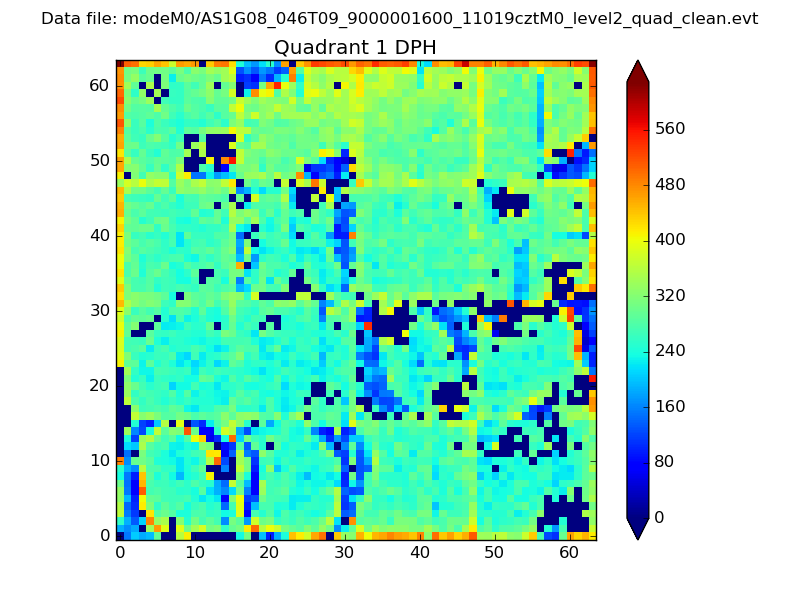 |
Quadrant B |
|---|---|---|---|
| Quadrant D | 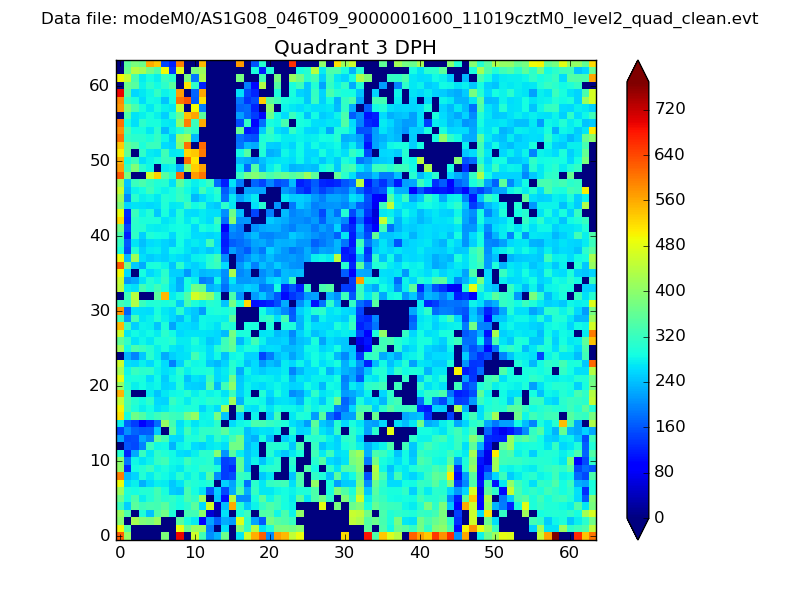 |
 |
Quadrant C |
| Plot type | Count rate plots | Images |
|---|---|---|
| Comparison with Poisson distribution Blue bars denote a histogram of data divided into 1 sec bins. Red curve is a Poisson curve with rate = median count rate of data. |
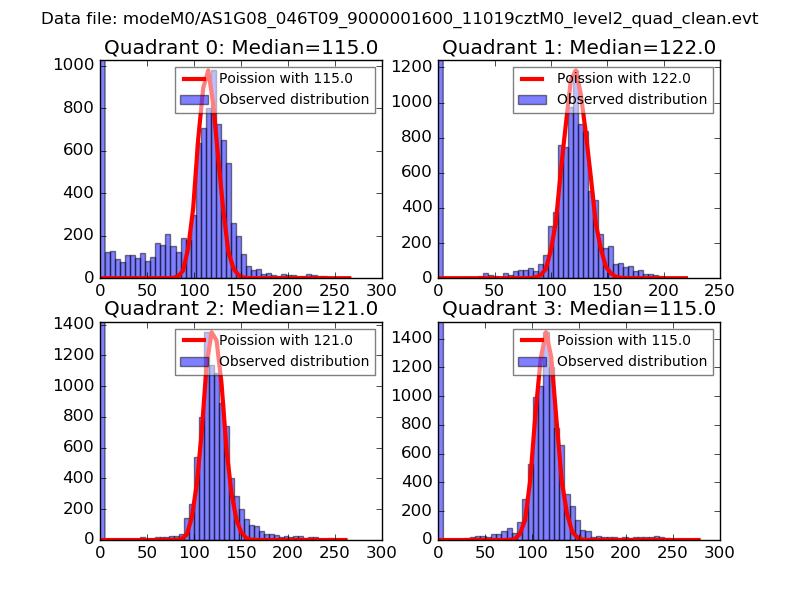 |
 |
| Quadrant-wise count rates Data is divided into 100 sec bins |
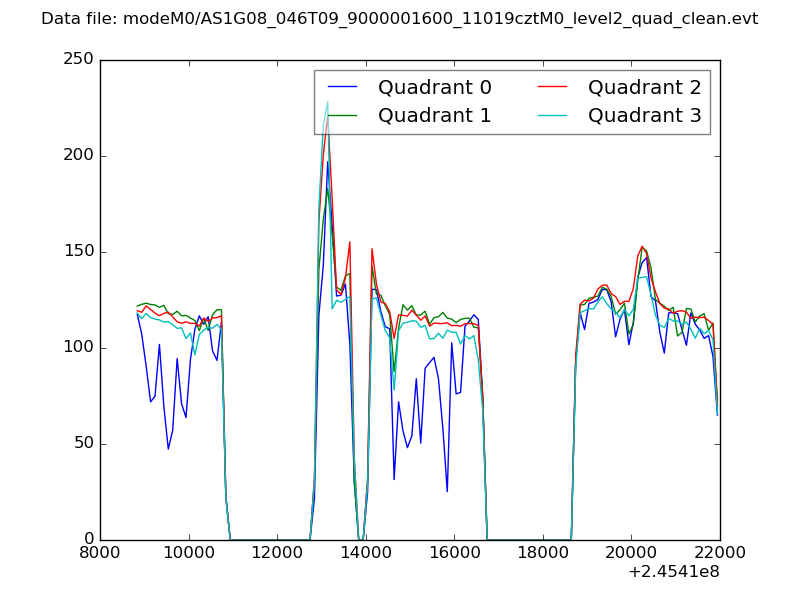 |
|
| Module-wise count rates for Quadrant A Data is divided into 100 sec bins |
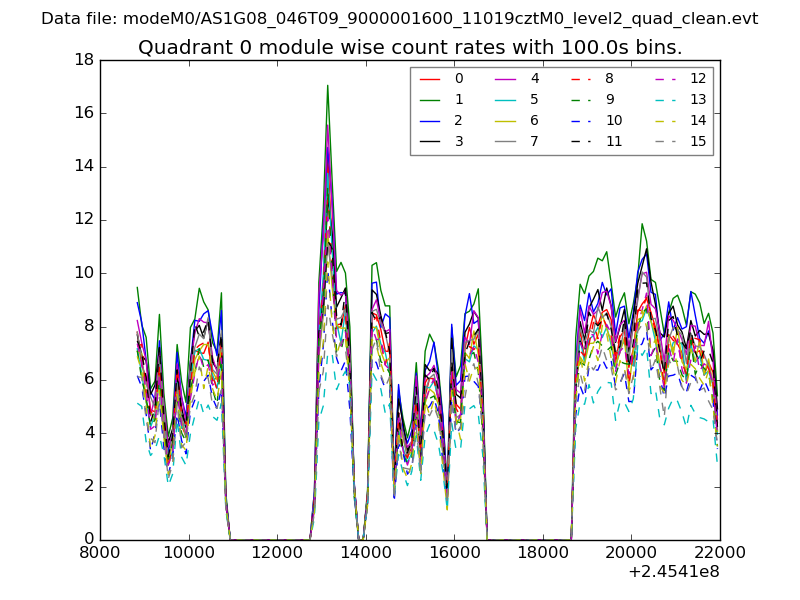 |
 |
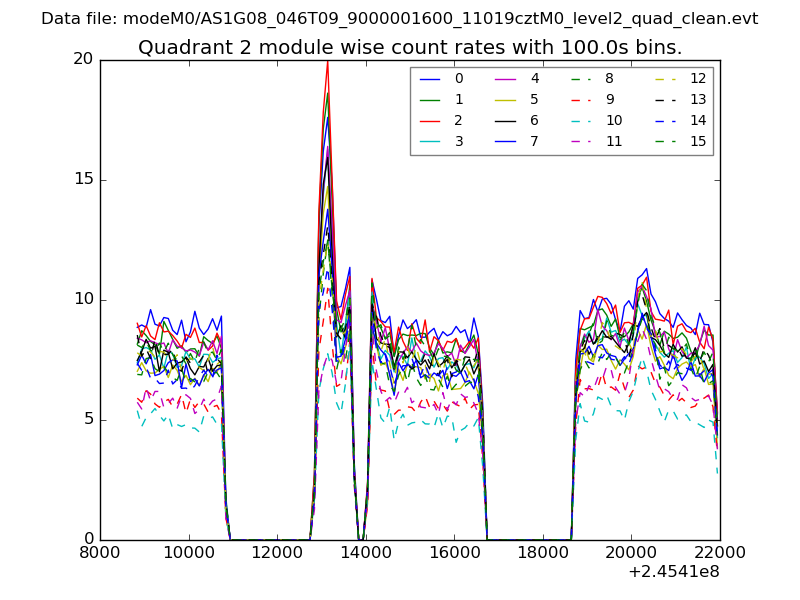
| Module-wise count rates for Quadrant B Data is divided into 100 sec bins |
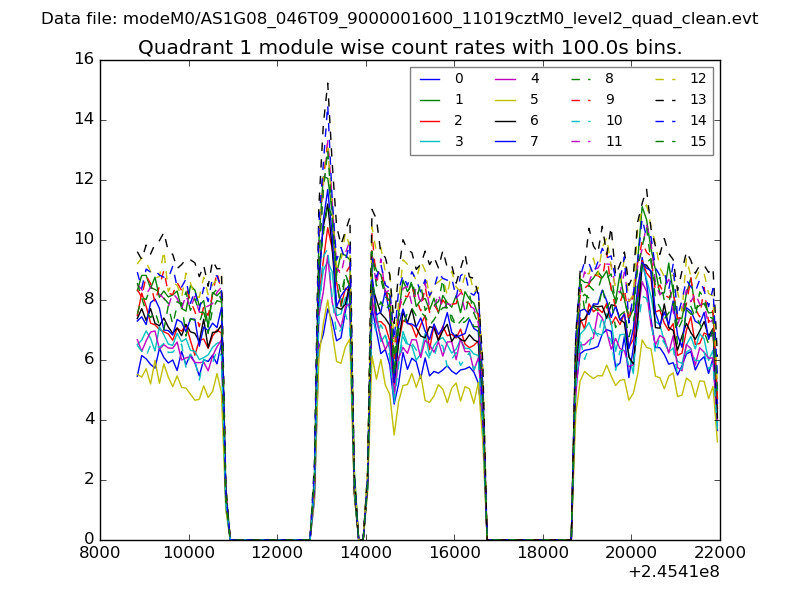 |
 |
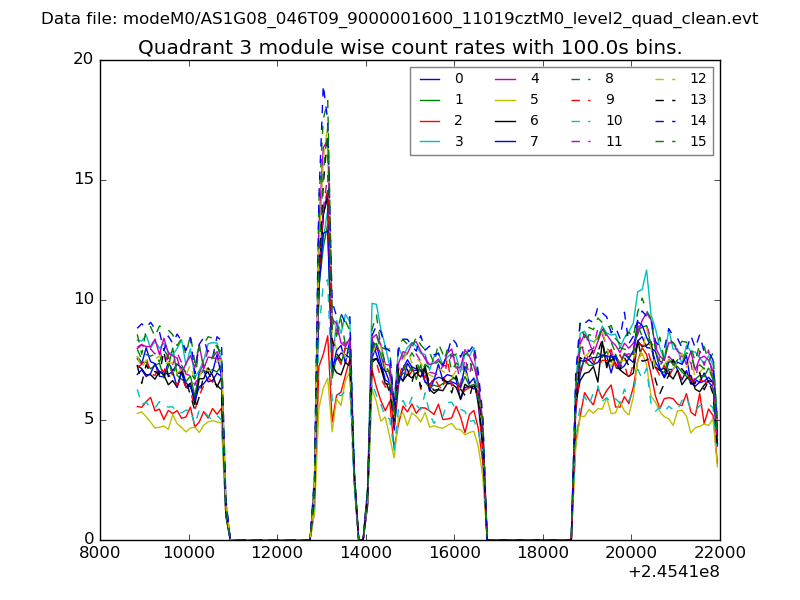
| Module-wise count rates for Quadrant C Data is divided into 100 sec bins |
 |
 |
| Module-wise count rates for Quadrant D Data is divided into 100 sec bins |
 |
 |
| Parameter | Plot |
|---|---|
| CZT HV Monitor | 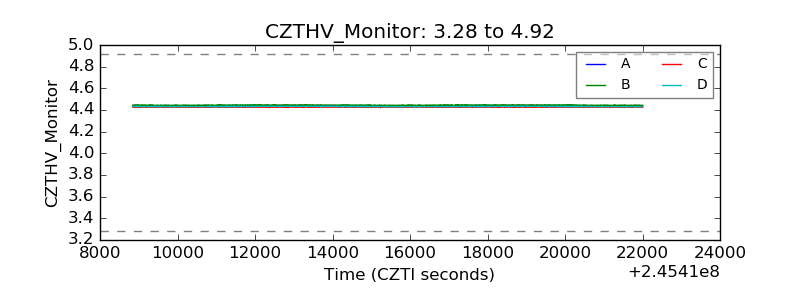 |
| D_VDD | 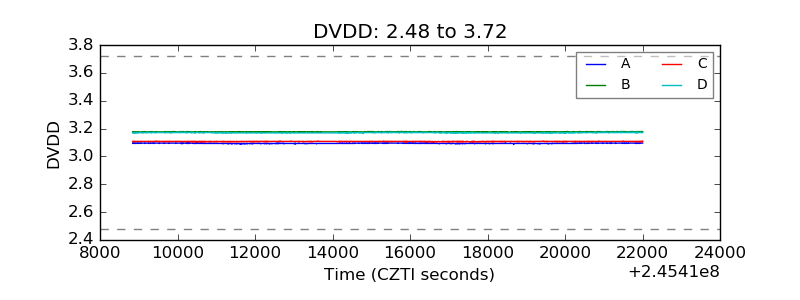 |
| Temperature 1 | 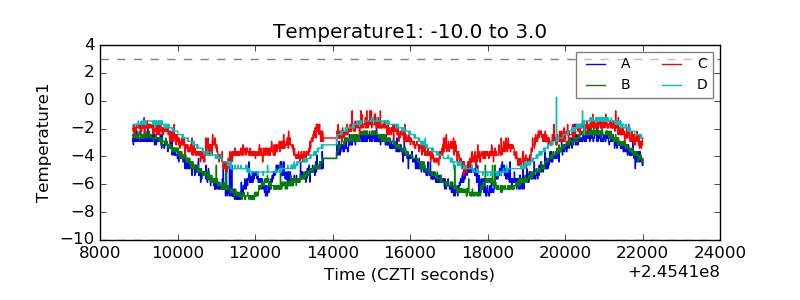 |
| Veto HV Monitor | 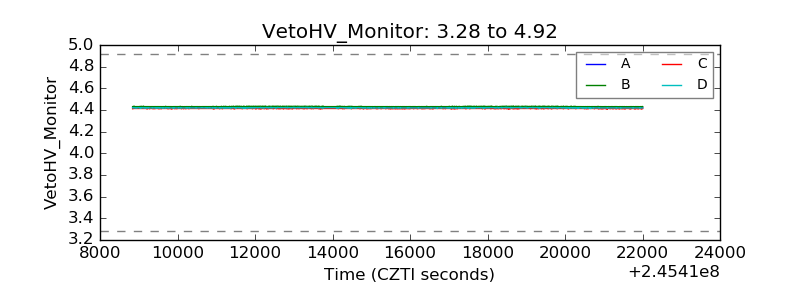 |
| Veto LLD | 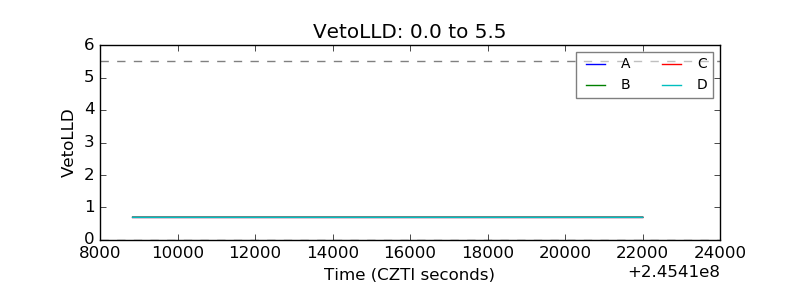 |
| Alpha Counter | 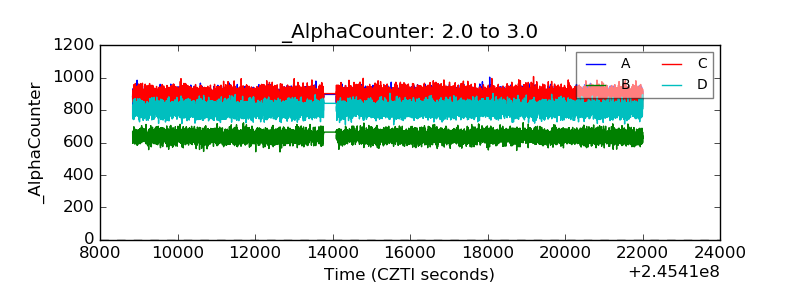 |
| _CPM_Rate | 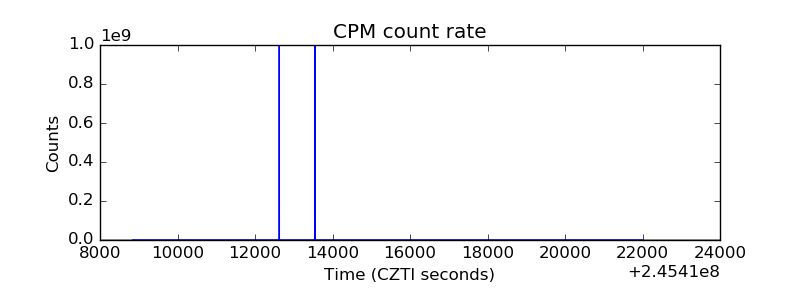 |
| CZT Counter |  |
| +2.5 Volts monitor |  |
| +5 Volts monitor |  |
| _ROLL_ROT | 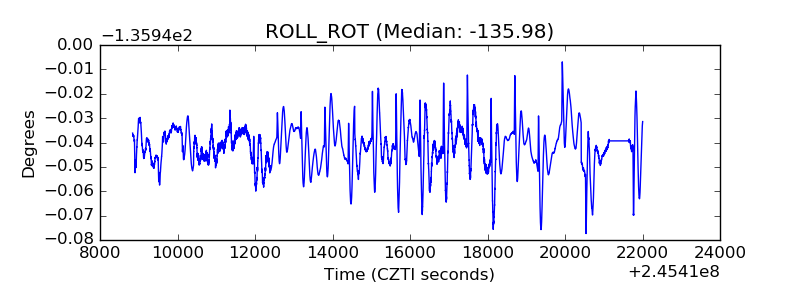 |
| _Roll_DEC | 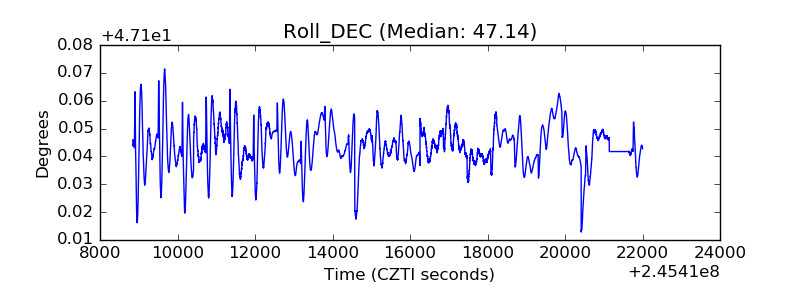 |
| _Roll_RA |  |
| Veto Counter | 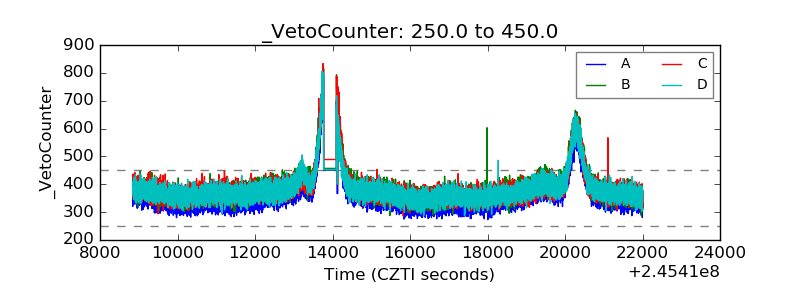 |