| Param | Original file | Final file |
|---|---|---|
| Filename | modeM0/AS1G08_046T09_9000001600_11020cztM0_level2.evt | modeM0/AS1G08_046T09_9000001600_11020cztM0_level2_quad_clean.evt |
| Size (bytes) | 652,348,800 | 102,104,640 |
| Size | 622.1 MB | 97.4 MB |
| Events in quadrant A | 4,732,465 | 644,351 |
| Events in quadrant B | 5,187,515 | 650,607 |
| Events in quadrant C | 3,275,908 | 660,084 |
| Events in quadrant D | 6,058,172 | 620,329 |
| Mode M0 | |||
|---|---|---|---|
| Quadrant | BADHDUFLAG | Total packets | Discarded packets |
| A | 0 | 19150 | 90 |
| B | 0 | 20492 | 110 |
| C | 0 | 15128 | 49 |
| D | 0 | 23254 | 83 |
| Mode M9 | |||
|---|---|---|---|
| Quadrant | BADHDUFLAG | Total packets | Discarded packets |
| A | 0 | 3 | 0 |
| B | 0 | 3 | 0 |
| C | 0 | 3 | 0 |
| D | 0 | 3 | 0 |
| Mode SS | |||
|---|---|---|---|
| Quadrant | BADHDUFLAG | Total packets | Discarded packets |
| A | 0 | 150 | 0 |
| B | 0 | 150 | 0 |
| C | 0 | 150 | 0 |
| D | 0 | 150 | 0 |
| Quadrant | Total seconds | Saturated seconds | Saturation percentage |
|---|---|---|---|
| A | 7416 | 326 | 4.395901% |
| B | 7421 | 468 | 6.306428% |
| C | 7429 | 23 | 0.309598% |
| D | 7424 | 349 | 4.700970% |
Noise dominated data is calculated using 1-second bins in cleaned event files. If a bin has >2000 counts, and if more than 50% of those come from <1% of pixels, then it is considered to be noise-dominated and hence unusable.
| Quadrant | # 1 sec bins | Bins with >0 counts | Bins with >2000 counts | High rate bins dominated by noise | Noise dominated (total time) | Noise dominated (detector-on time) | Marked lightcurve |
|---|---|---|---|---|---|---|---|
| A | 7678 | 7448 | 244 | 244 | 3.18% | 3.28% | 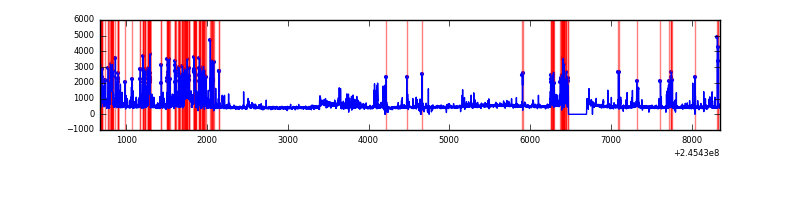 |
| B | 7678 | 7451 | 267 | 267 | 3.48% | 3.58% | 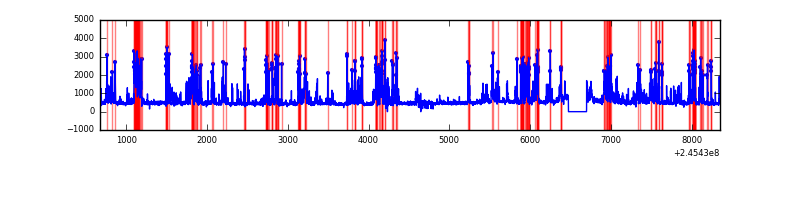 |
| C | 7678 | 7452 | 0 | 0 | 0.00% | 0.00% |  |
| D | 7678 | 7454 | 293 | 293 | 3.82% | 3.93% | 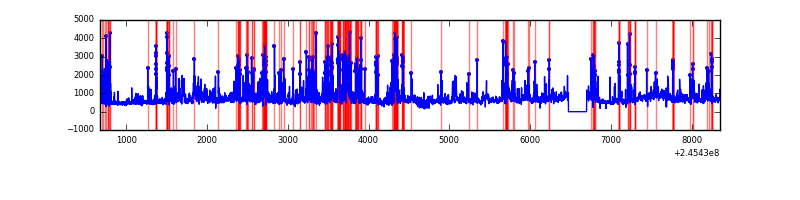 |
Top three noisy pixels from each quadrant. If the there are fewer than three noisy pixels in the level2.evt file, extra rows are filled as -1
| Pixel properties | Quadrant properties | ||||||
|---|---|---|---|---|---|---|---|
| Quadrant | DetID | PixID | Counts | Sigma | Mean | Median | Sigma |
| A | 14 | 238 | 757237 | 4390.02 | 843 | 822 | 172.3 |
| A | 8 | 5 | 706026 | 4092.81 | 843 | 822 | 172.3 |
| A | 15 | 174 | 16489 | 90.93 | 843 | 822 | 172.3 |
| B | 4 | 239 | 1792235 | 11180.04 | 841 | 821 | 160.2 |
| B | 0 | 214 | 39452 | 241.09 | 841 | 821 | 160.2 |
| B | 15 | 204 | 31271 | 190.04 | 841 | 821 | 160.2 |
| C | 13 | 61 | 6131 | 27.22 | 837 | 841 | 194.4 |
| C | 8 | 128 | 3879 | 15.63 | 837 | 841 | 194.4 |
| C | 14 | 234 | 2500 | 8.54 | 837 | 841 | 194.4 |
| D | 1 | 52 | 1297769 | 6516.28 | 823 | 799 | 199.0 |
| D | 10 | 253 | 493169 | 2473.78 | 823 | 799 | 199.0 |
| D | 8 | 195 | 373659 | 1873.34 | 823 | 799 | 199.0 |
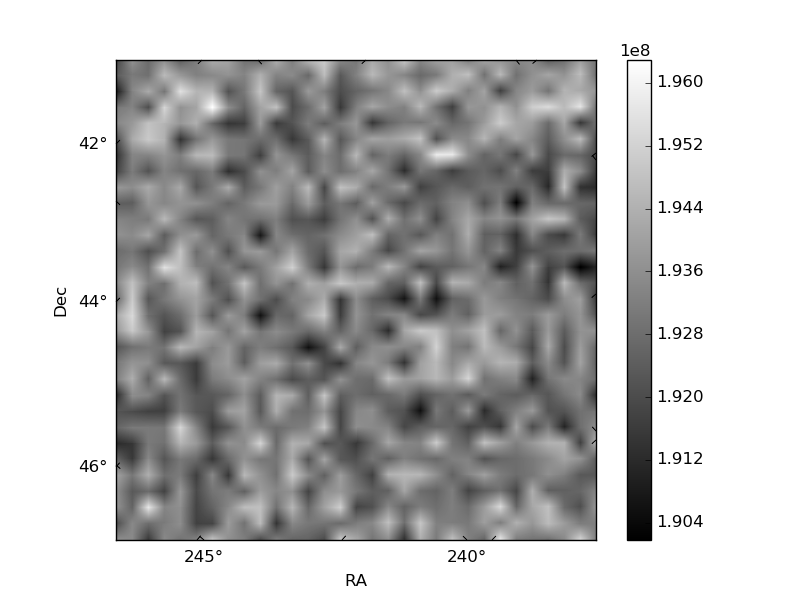
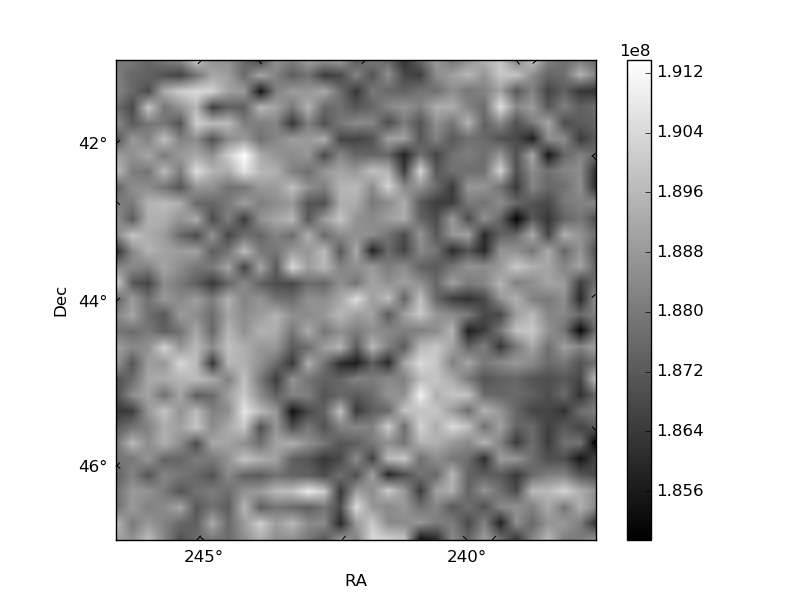
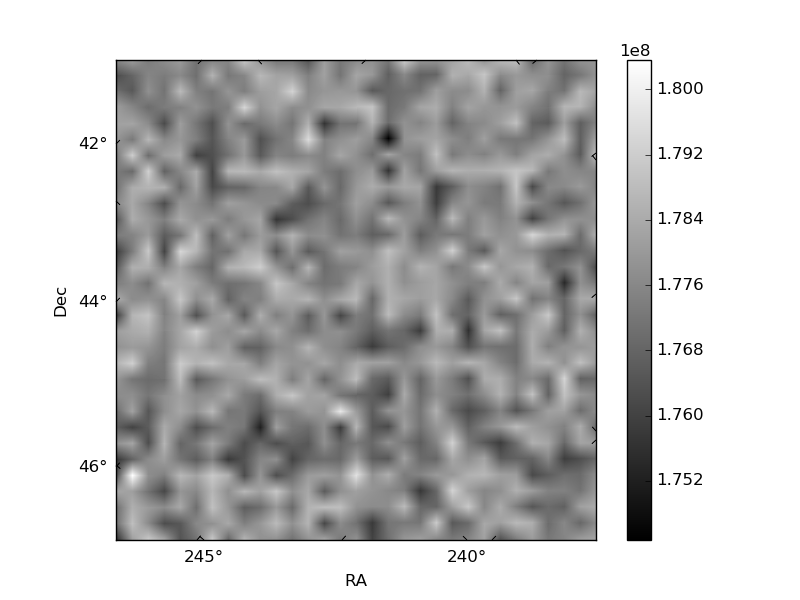
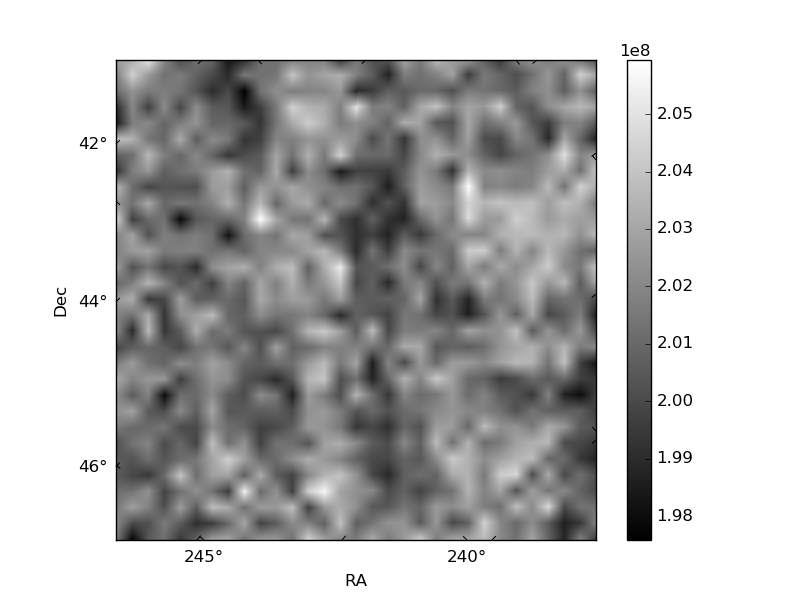
Histogram calculated using DETX and DETY for each event in the final _common_clean file
| Quadrant A | 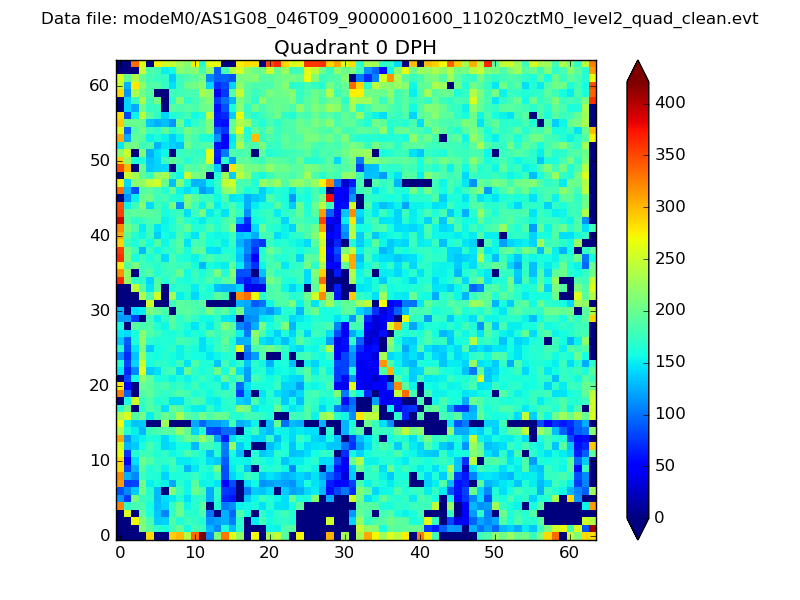 |
 |
Quadrant B |
|---|---|---|---|
| Quadrant D | 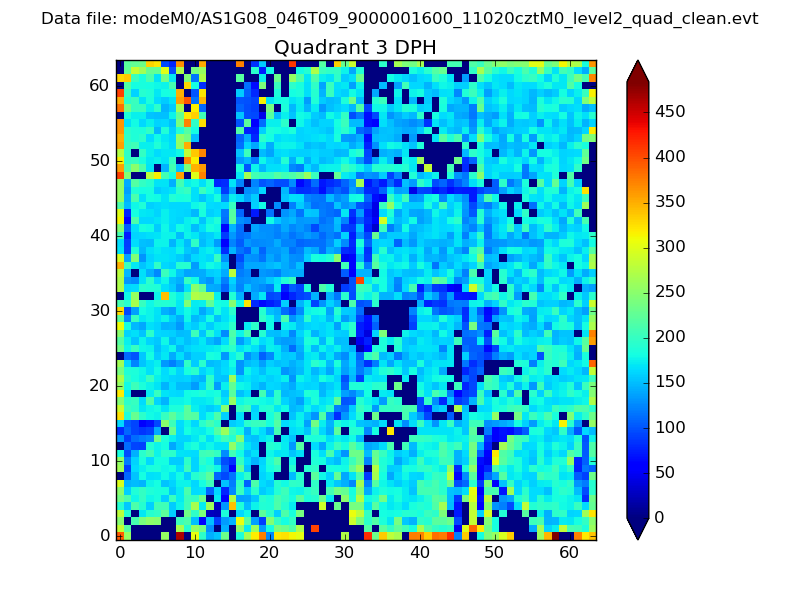 |
 |
Quadrant C |
| Plot type | Count rate plots | Images |
|---|---|---|
| Comparison with Poisson distribution Blue bars denote a histogram of data divided into 1 sec bins. Red curve is a Poisson curve with rate = median count rate of data. |
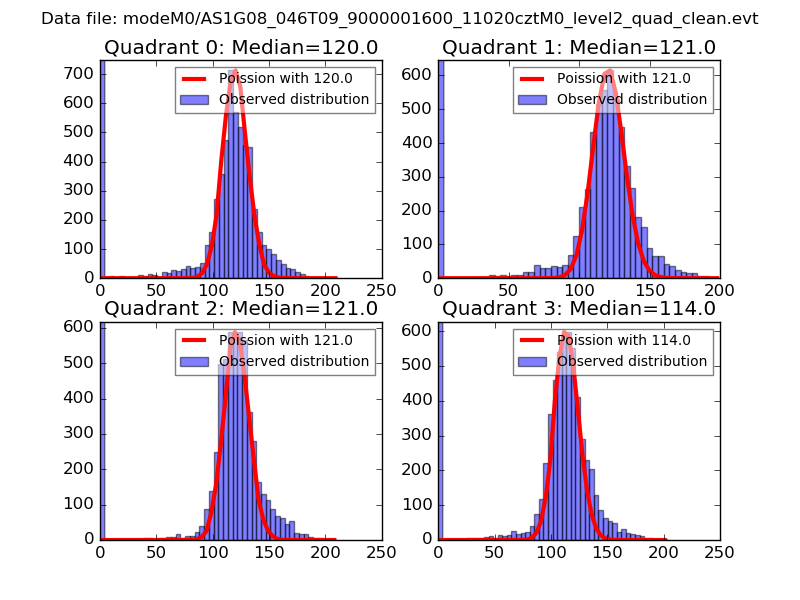 |
 |
| Quadrant-wise count rates Data is divided into 100 sec bins |
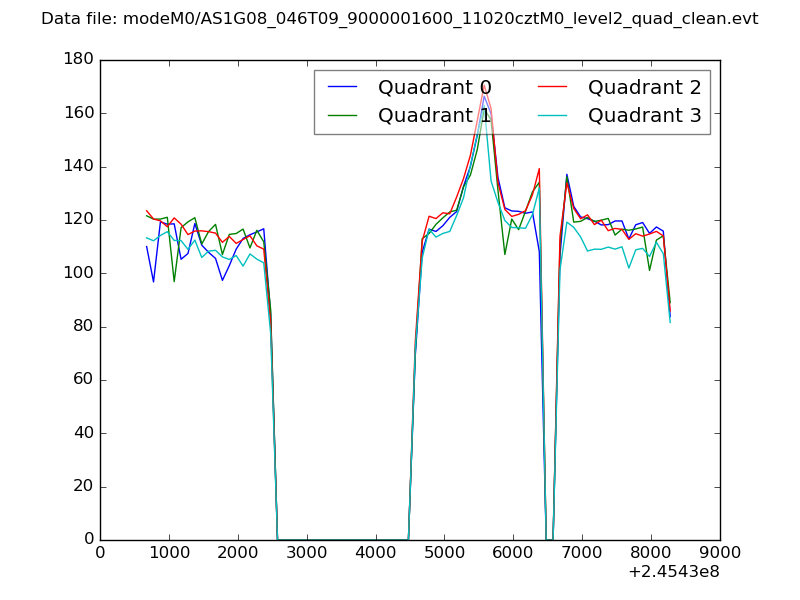 |
|
| Module-wise count rates for Quadrant A Data is divided into 100 sec bins |
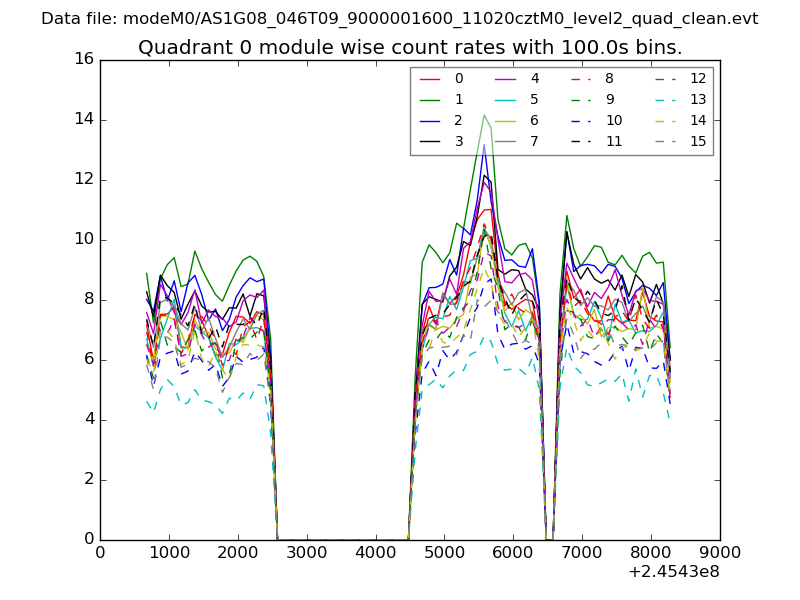 |
 |
| Module-wise count rates for Quadrant B Data is divided into 100 sec bins |
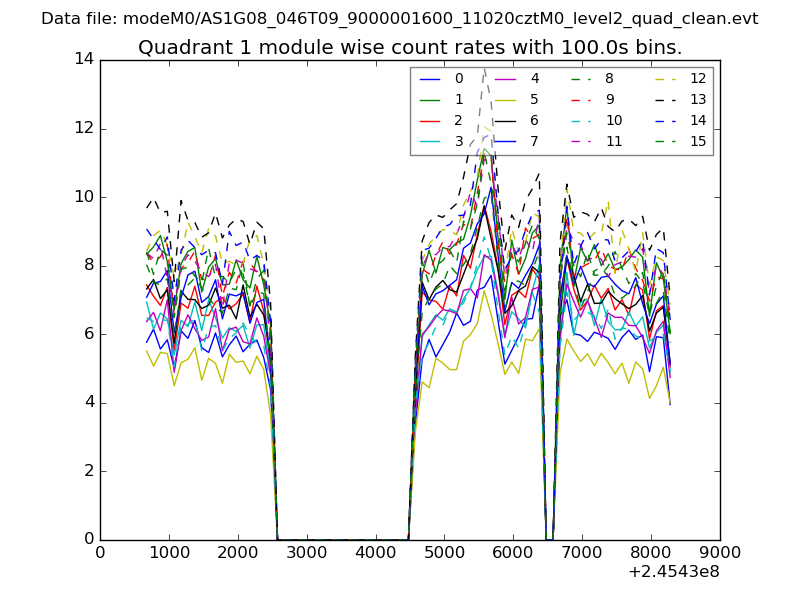 |
 |
| Module-wise count rates for Quadrant C Data is divided into 100 sec bins |
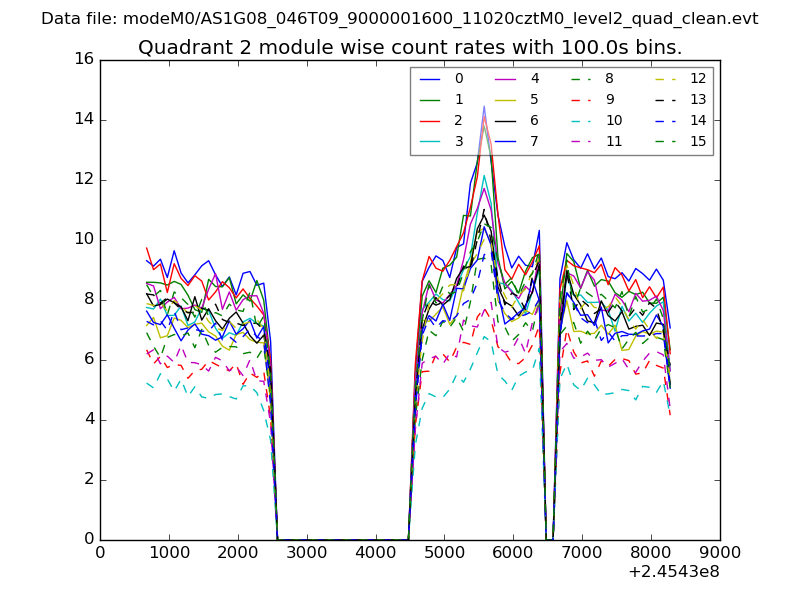 |
 |
| Module-wise count rates for Quadrant D Data is divided into 100 sec bins |
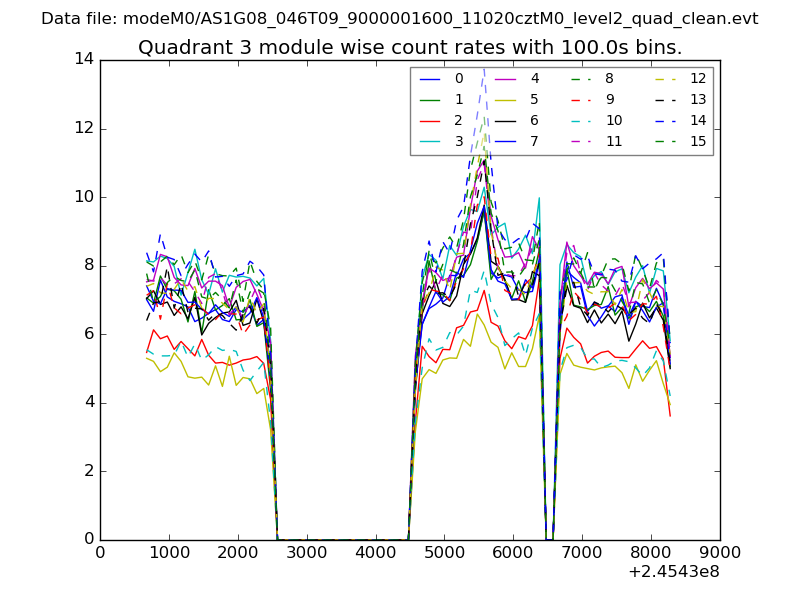 |
 |
| Parameter | Plot |
|---|---|
| CZT HV Monitor | 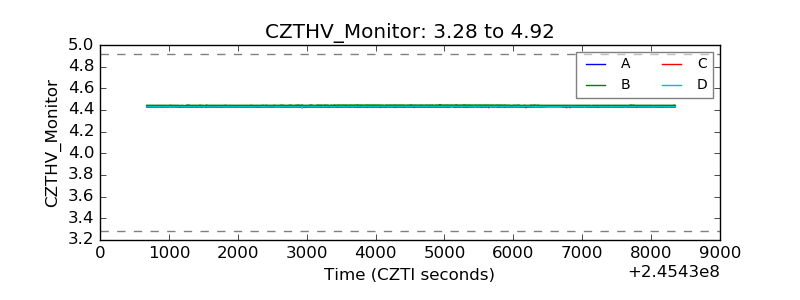 |
| D_VDD | 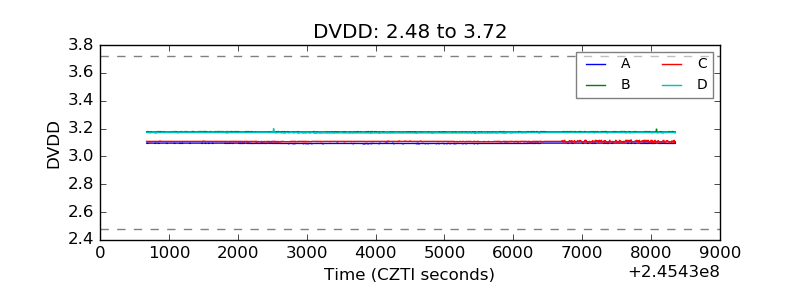 |
| Temperature 1 | 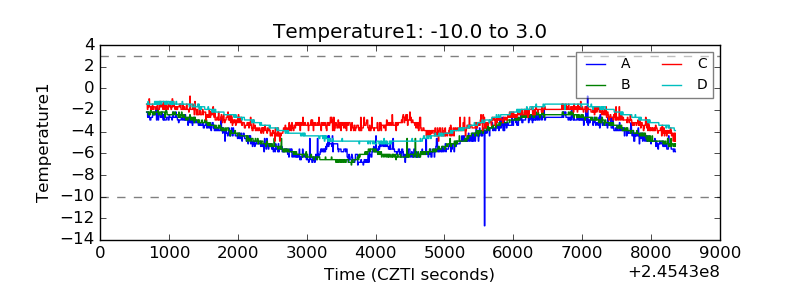 |
| Veto HV Monitor | 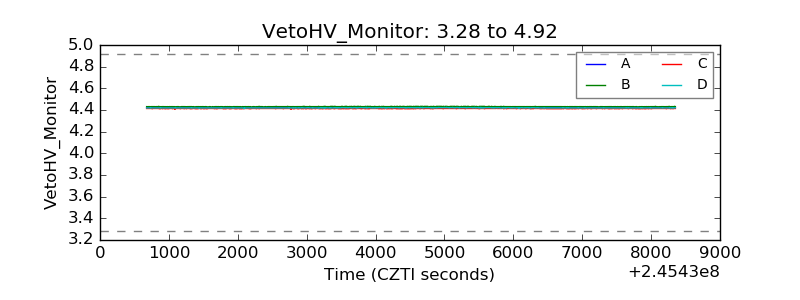 |
| Veto LLD | 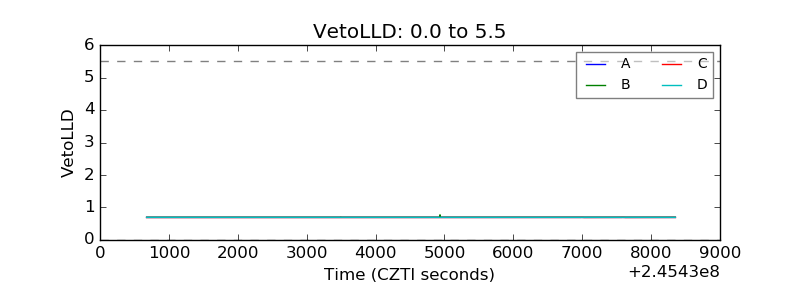 |
| Alpha Counter | 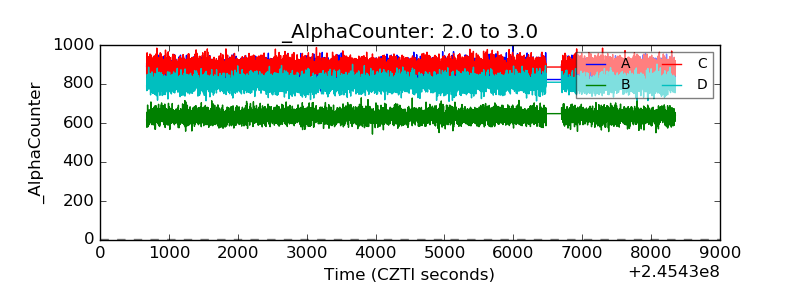 |
| _CPM_Rate | 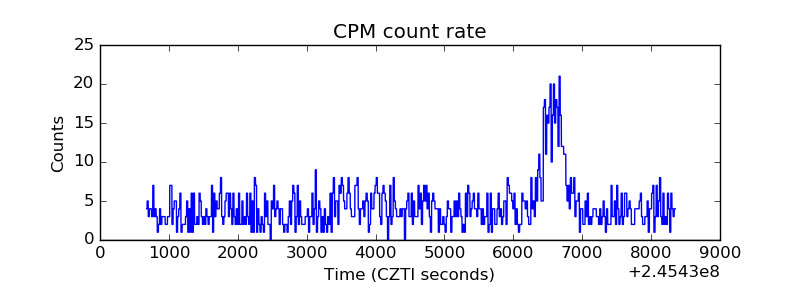 |
| CZT Counter |  |
| +2.5 Volts monitor |  |
| +5 Volts monitor |  |
| _ROLL_ROT | 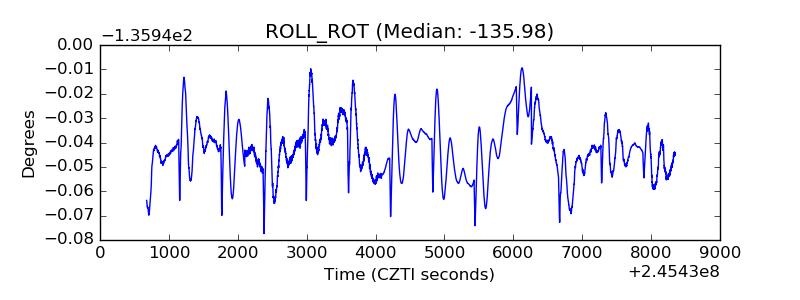 |
| _Roll_DEC | 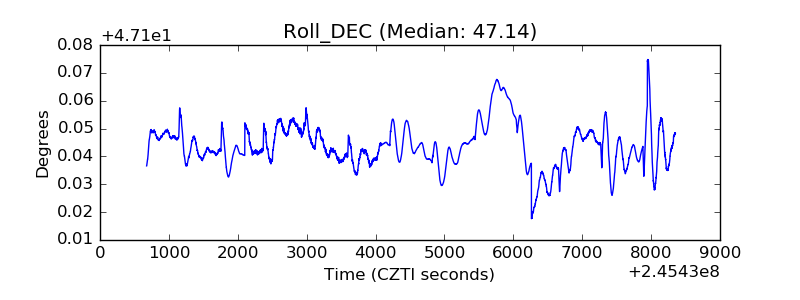 |
| _Roll_RA | 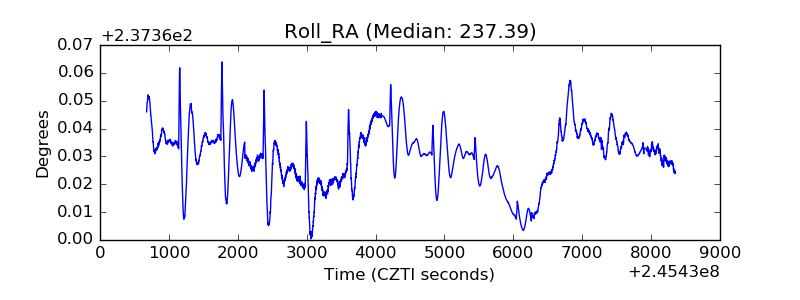 |
| Veto Counter | 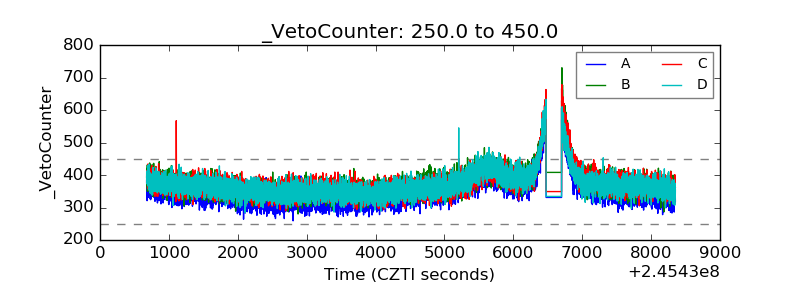 |