| Param | Original file | Final file |
|---|---|---|
| Filename | modeM0/AS1G08_046T09_9000001600_11022cztM0_level2.evt | modeM0/AS1G08_046T09_9000001600_11022cztM0_level2_quad_clean.evt |
| Size (bytes) | 441,066,240 | 66,816,000 |
| Size | 420.6 MB | 63.7 MB |
| Events in quadrant A | 3,017,172 | 415,468 |
| Events in quadrant B | 3,629,234 | 412,289 |
| Events in quadrant C | 2,420,176 | 417,900 |
| Events in quadrant D | 3,917,833 | 392,704 |
| Mode M0 | |||
|---|---|---|---|
| Quadrant | BADHDUFLAG | Total packets | Discarded packets |
| A | 0 | 12661 | 18 |
| B | 0 | 14529 | 15 |
| C | 0 | 11184 | 9 |
| D | 0 | 15569 | 6 |
| Mode SS | |||
|---|---|---|---|
| Quadrant | BADHDUFLAG | Total packets | Discarded packets |
| A | 0 | 110 | 0 |
| B | 0 | 110 | 0 |
| C | 0 | 110 | 0 |
| D | 0 | 110 | 0 |
| Quadrant | Total seconds | Saturated seconds | Saturation percentage |
|---|---|---|---|
| A | 5492 | 56 | 1.019665% |
| B | 5496 | 278 | 5.058224% |
| C | 5496 | 14 | 0.254731% |
| D | 5499 | 168 | 3.055101% |
Noise dominated data is calculated using 1-second bins in cleaned event files. If a bin has >2000 counts, and if more than 50% of those come from <1% of pixels, then it is considered to be noise-dominated and hence unusable.
| Quadrant | # 1 sec bins | Bins with >0 counts | Bins with >2000 counts | High rate bins dominated by noise | Noise dominated (total time) | Noise dominated (detector-on time) | Marked lightcurve |
|---|---|---|---|---|---|---|---|
| A | 5500 | 5500 | 38 | 38 | 0.69% | 0.69% |  |
| B | 5500 | 5500 | 184 | 184 | 3.35% | 3.35% |  |
| C | 5500 | 5500 | 10 | 10 | 0.18% | 0.18% | 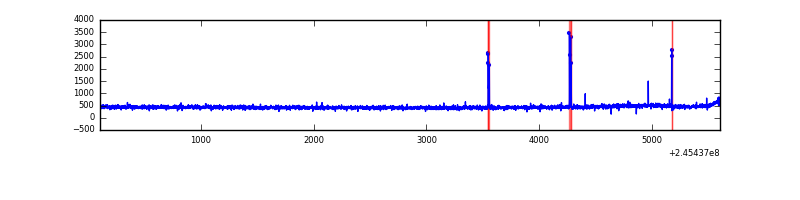 |
| D | 5500 | 5500 | 87 | 87 | 1.58% | 1.58% |  |
Top three noisy pixels from each quadrant. If the there are fewer than three noisy pixels in the level2.evt file, extra rows are filled as -1
| Pixel properties | Quadrant properties | ||||||
|---|---|---|---|---|---|---|---|
| Quadrant | DetID | PixID | Counts | Sigma | Mean | Median | Sigma |
| A | 8 | 5 | 546513 | 4266.62 | 621 | 606 | 127.9 |
| A | 14 | 238 | 71843 | 556.76 | 621 | 606 | 127.9 |
| A | 0 | 226 | 5730 | 40.05 | 621 | 606 | 127.9 |
| B | 4 | 239 | 1106198 | 9337.65 | 614 | 598 | 118.4 |
| B | 4 | 81 | 60346 | 504.62 | 614 | 598 | 118.4 |
| B | 0 | 187 | 20204 | 165.59 | 614 | 598 | 118.4 |
| C | 14 | 234 | 43106 | 299.23 | 607 | 609 | 142.0 |
| C | 13 | 61 | 4509 | 27.46 | 607 | 609 | 142.0 |
| C | 8 | 222 | 3603 | 21.08 | 607 | 609 | 142.0 |
| D | 1 | 52 | 757300 | 5214.66 | 600 | 581 | 145.1 |
| D | 8 | 195 | 477600 | 3287.2 | 600 | 581 | 145.1 |
| D | 10 | 253 | 136739 | 938.28 | 600 | 581 | 145.1 |
Histogram calculated using DETX and DETY for each event in the final _common_clean file
| Quadrant A | 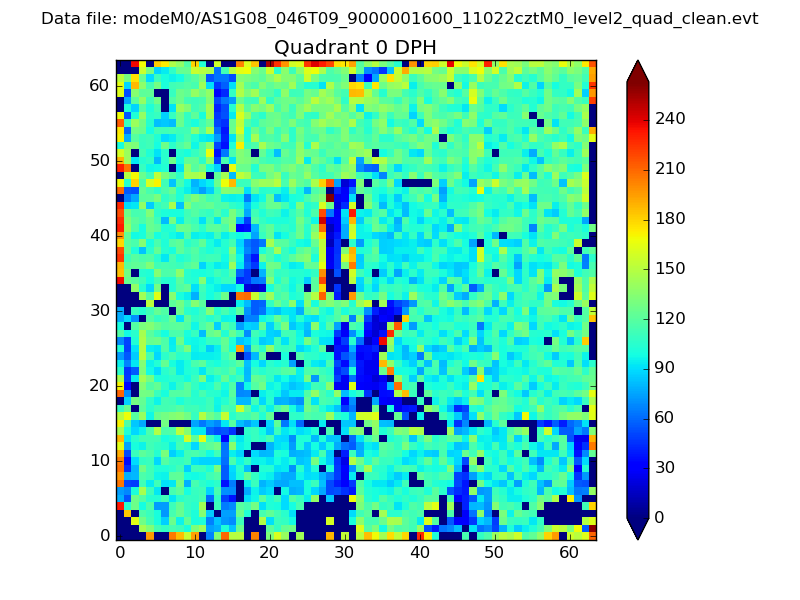 |
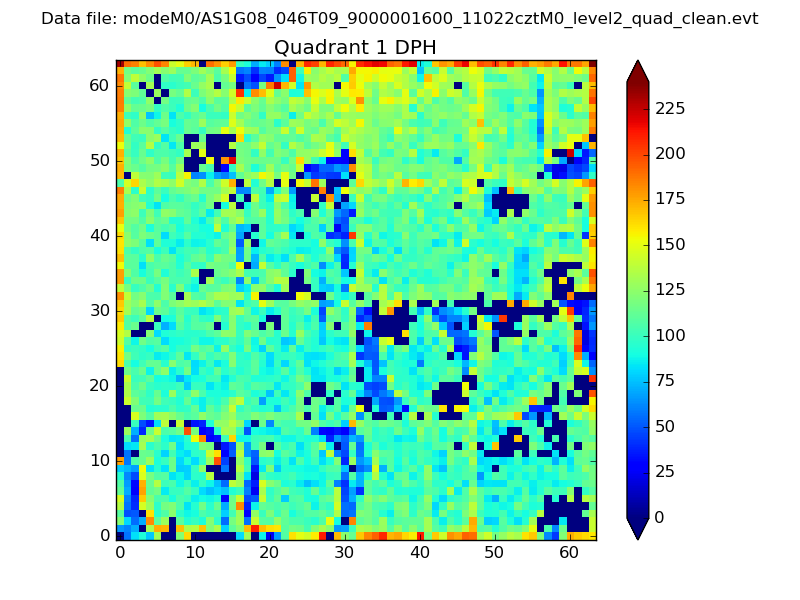 |
Quadrant B |
|---|---|---|---|
| Quadrant D | 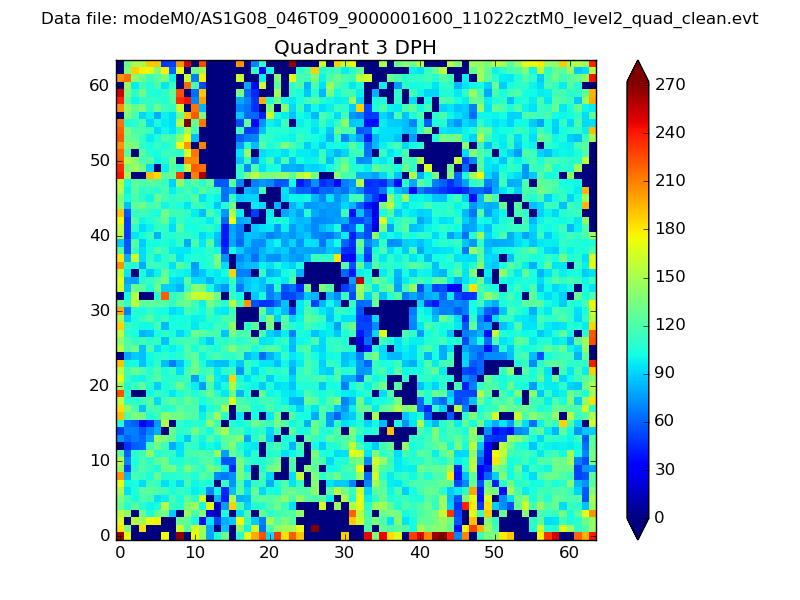 |
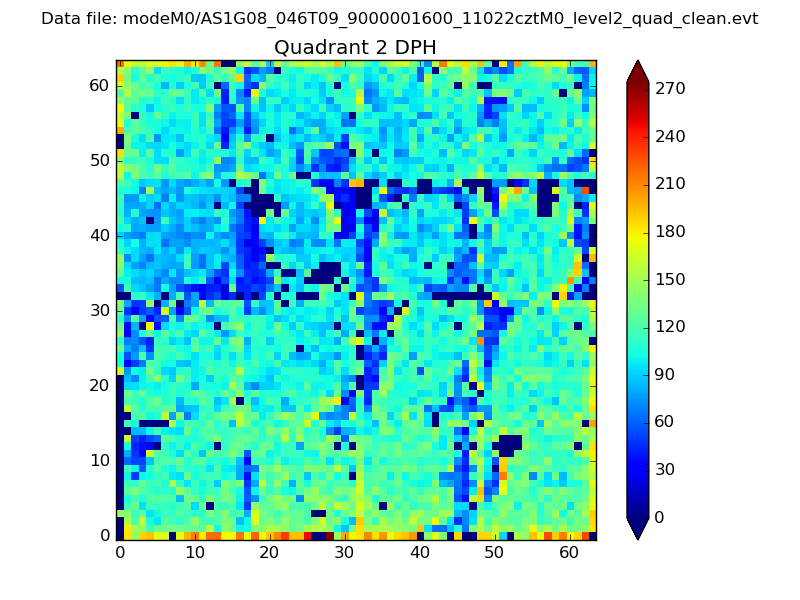 |
Quadrant C |
| Plot type | Count rate plots | Images |
|---|---|---|
| Comparison with Poisson distribution Blue bars denote a histogram of data divided into 1 sec bins. Red curve is a Poisson curve with rate = median count rate of data. |
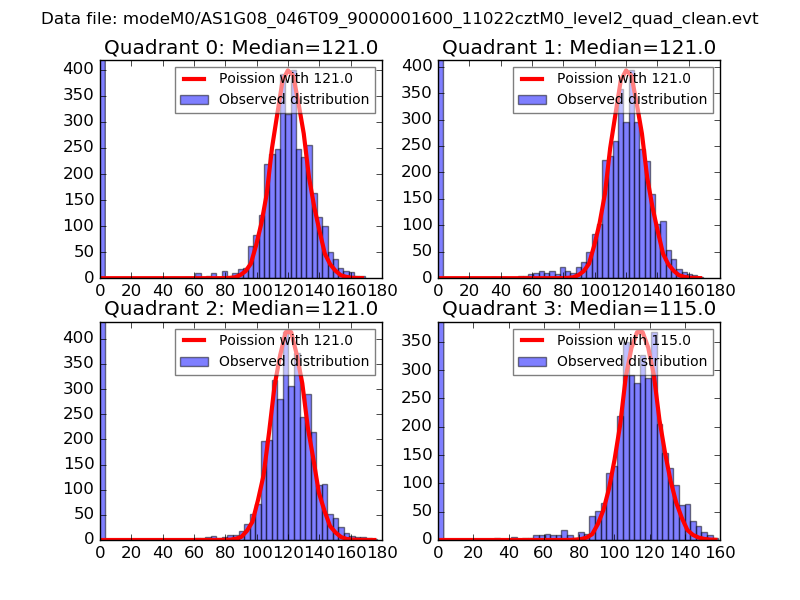 |
 |
| Quadrant-wise count rates Data is divided into 100 sec bins |
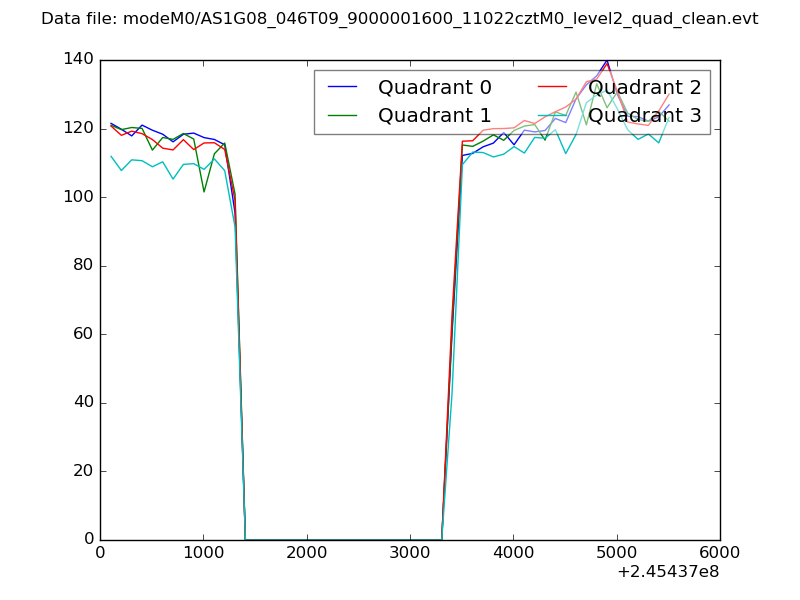 |
|
| Module-wise count rates for Quadrant A Data is divided into 100 sec bins |
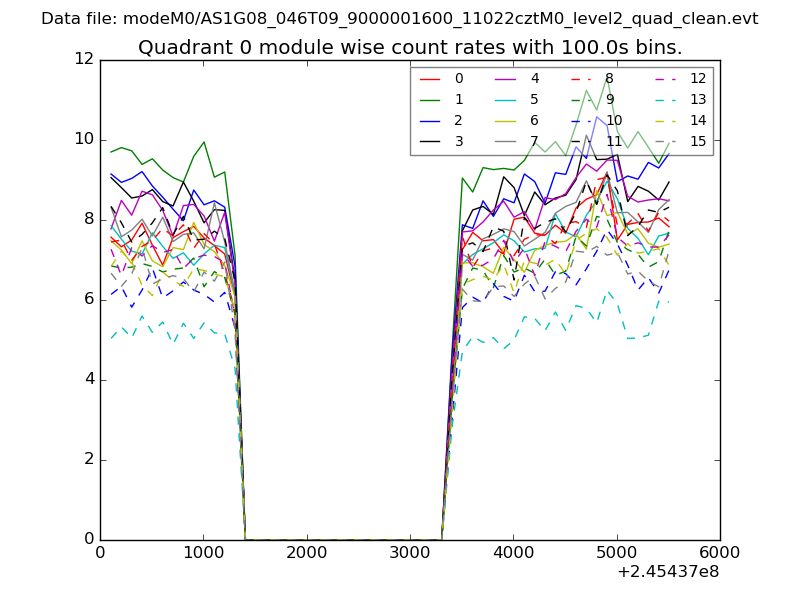 |
 |
| Module-wise count rates for Quadrant B Data is divided into 100 sec bins |
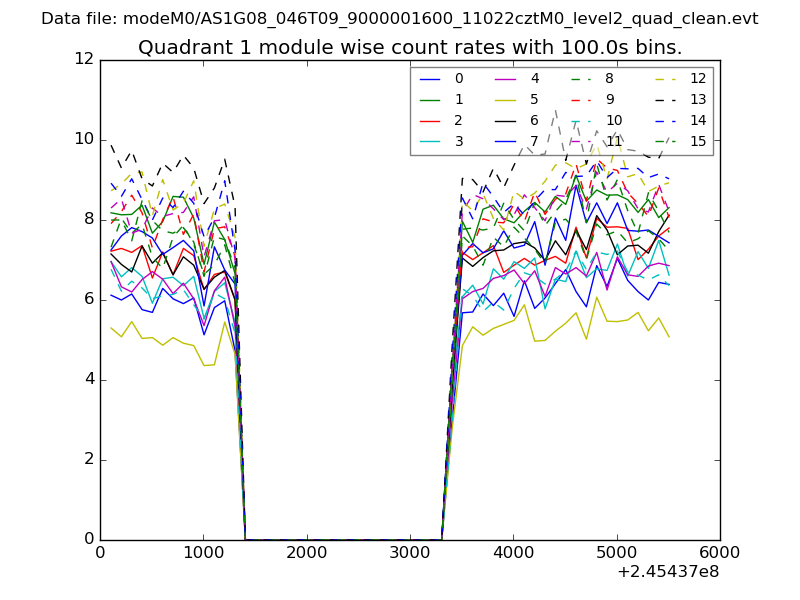 |
 |
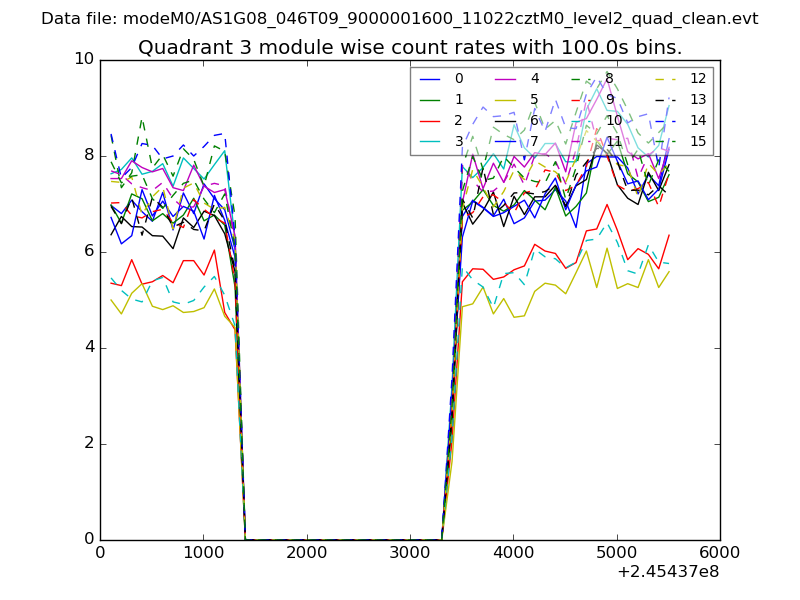
| Module-wise count rates for Quadrant C Data is divided into 100 sec bins |
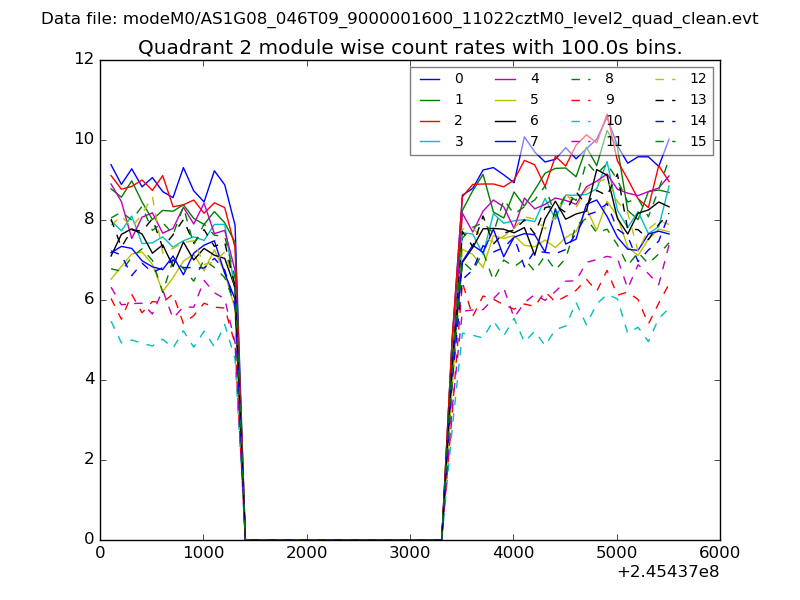 |
 |
| Module-wise count rates for Quadrant D Data is divided into 100 sec bins |
 |
 |
| Parameter | Plot |
|---|---|
| CZT HV Monitor | 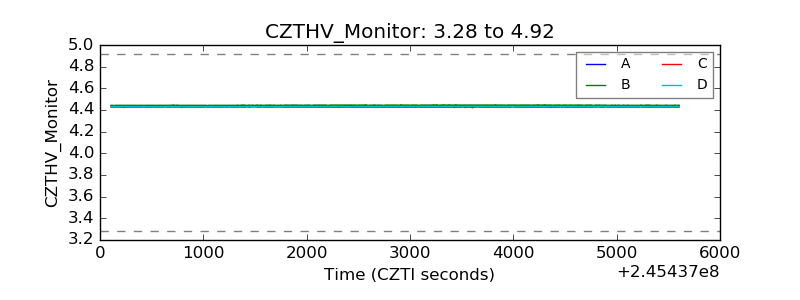 |
| D_VDD | 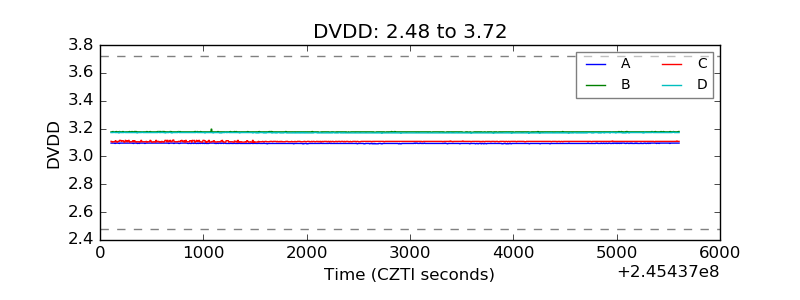 |
| Temperature 1 | 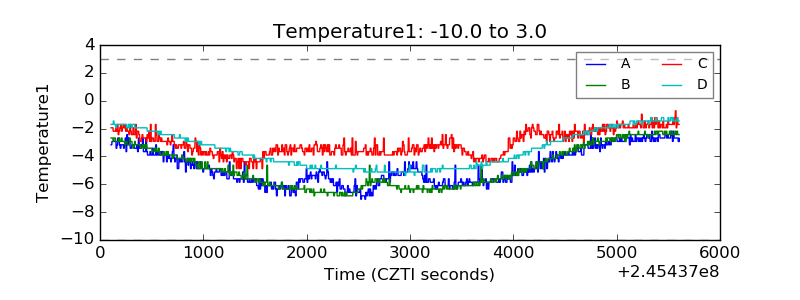 |
| Veto HV Monitor | 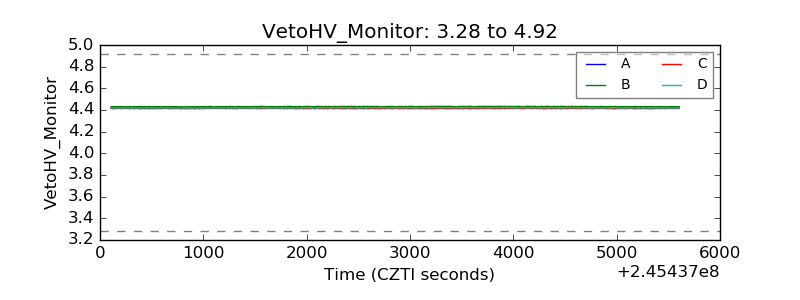 |
| Veto LLD | 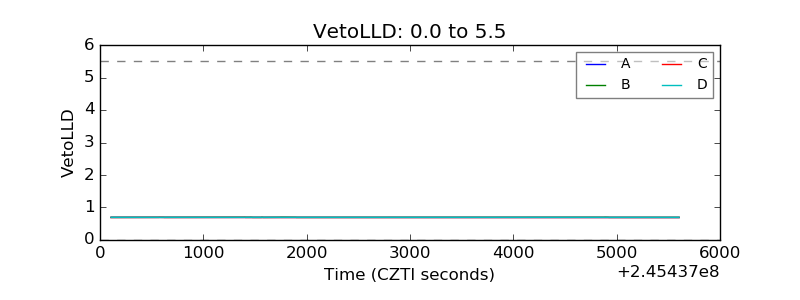 |
| Alpha Counter | 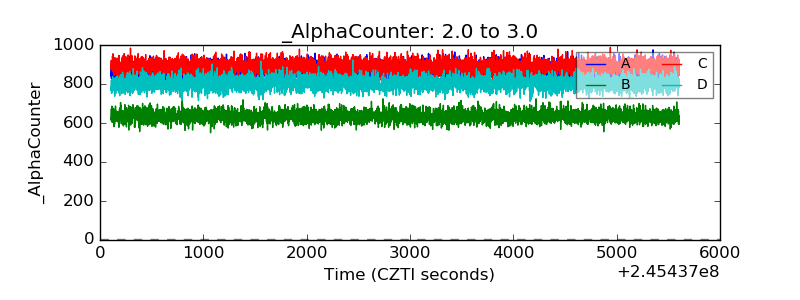 |
| _CPM_Rate | 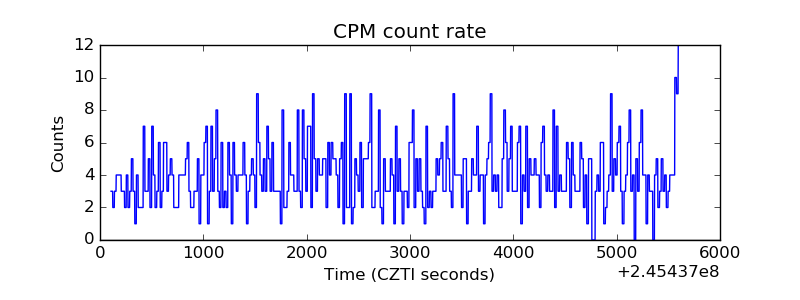 |
| CZT Counter | 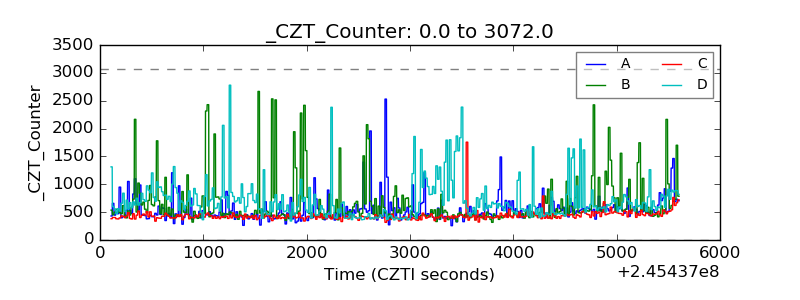 |
| +2.5 Volts monitor |  |
| +5 Volts monitor | 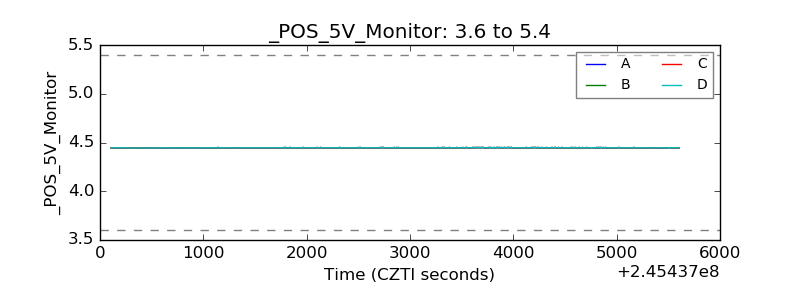 |
| _ROLL_ROT | 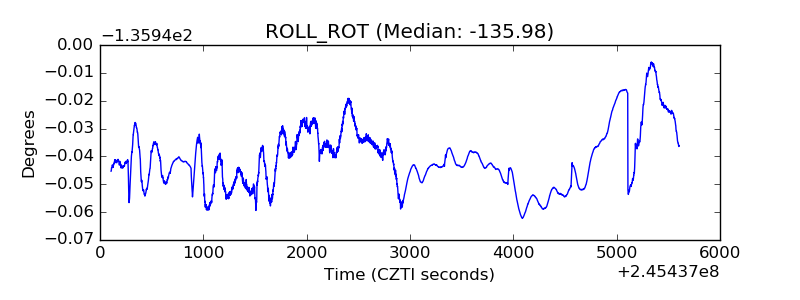 |
| _Roll_DEC | 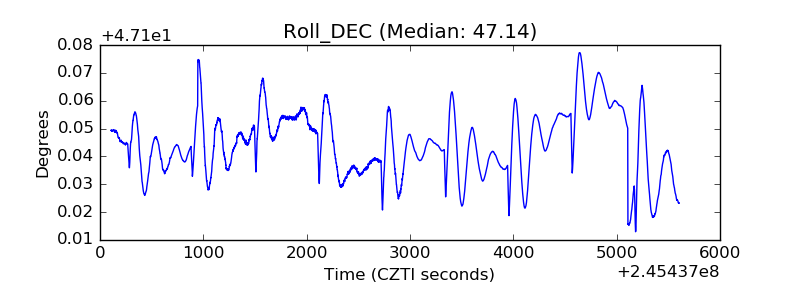 |
| _Roll_RA | 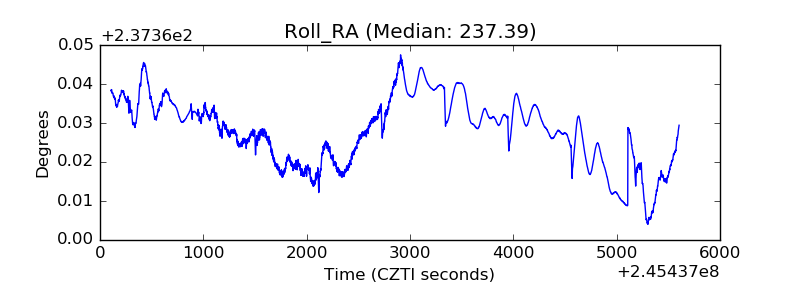 |
| Veto Counter | 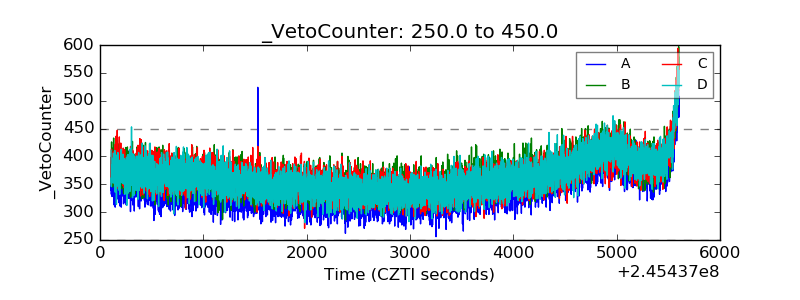 |