| Param | Original file | Final file |
|---|---|---|
| Filename | modeM0/AS1G08_046T09_9000001600_11023cztM0_level2.evt | modeM0/AS1G08_046T09_9000001600_11023cztM0_level2_quad_clean.evt |
| Size (bytes) | 1,167,140,160 | 152,870,400 |
| Size | 1.1 GB | 145.8 MB |
| Events in quadrant A | 10,348,738 | 925,698 |
| Events in quadrant B | 8,993,736 | 937,852 |
| Events in quadrant C | 5,863,080 | 955,779 |
| Events in quadrant D | 9,251,919 | 898,752 |
| Mode M0 | |||
|---|---|---|---|
| Quadrant | BADHDUFLAG | Total packets | Discarded packets |
| A | 0 | 39625 | 7 |
| B | 0 | 35733 | 3 |
| C | 0 | 26735 | 3 |
| D | 0 | 36460 | 3 |
| Mode M9 | |||
|---|---|---|---|
| Quadrant | BADHDUFLAG | Total packets | Discarded packets |
| A | 0 | 20 | 0 |
| B | 0 | 20 | 0 |
| C | 0 | 20 | 0 |
| D | 0 | 20 | 0 |
| Mode SS | |||
|---|---|---|---|
| Quadrant | BADHDUFLAG | Total packets | Discarded packets |
| A | 0 | 270 | 0 |
| B | 0 | 270 | 0 |
| C | 0 | 270 | 0 |
| D | 0 | 270 | 0 |
| Quadrant | Total seconds | Saturated seconds | Saturation percentage |
|---|---|---|---|
| A | 13185 | 912 | 6.916951% |
| B | 13186 | 882 | 6.688912% |
| C | 13186 | 38 | 0.288184% |
| D | 13186 | 435 | 3.298953% |
Noise dominated data is calculated using 1-second bins in cleaned event files. If a bin has >2000 counts, and if more than 50% of those come from <1% of pixels, then it is considered to be noise-dominated and hence unusable.
| Quadrant | # 1 sec bins | Bins with >0 counts | Bins with >2000 counts | High rate bins dominated by noise | Noise dominated (total time) | Noise dominated (detector-on time) | Marked lightcurve |
|---|---|---|---|---|---|---|---|
| A | 15166 | 13189 | 655 | 655 | 4.32% | 4.97% | 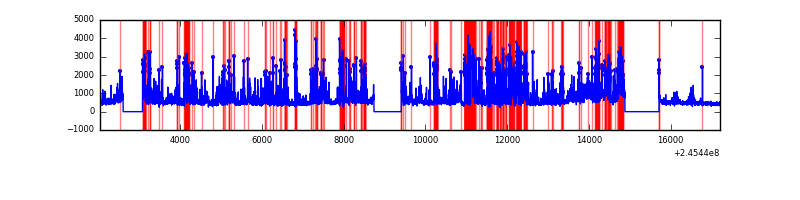 |
| B | 15166 | 13188 | 504 | 504 | 3.32% | 3.82% | 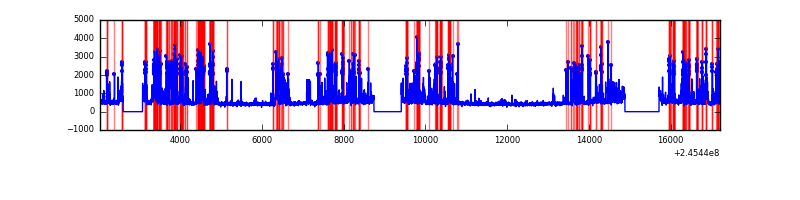 |
| C | 15166 | 13189 | 6 | 6 | 0.04% | 0.05% | 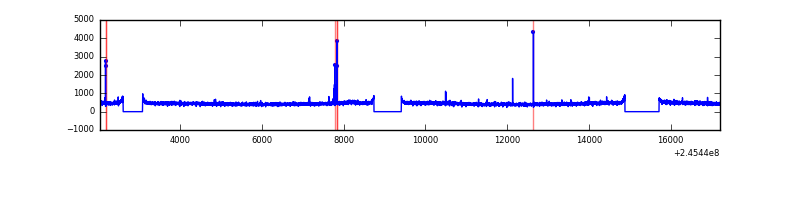 |
| D | 15166 | 13189 | 332 | 332 | 2.19% | 2.52% | 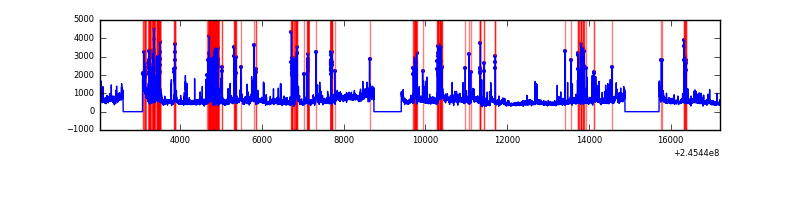 |
Top three noisy pixels from each quadrant. If the there are fewer than three noisy pixels in the level2.evt file, extra rows are filled as -1
| Pixel properties | Quadrant properties | ||||||
|---|---|---|---|---|---|---|---|
| Quadrant | DetID | PixID | Counts | Sigma | Mean | Median | Sigma |
| A | 8 | 5 | 4311491 | 14167.88 | 1493 | 1454 | 304.2 |
| A | 8 | 15 | 142170 | 462.56 | 1493 | 1454 | 304.2 |
| A | 14 | 238 | 103964 | 336.97 | 1493 | 1454 | 304.2 |
| B | 4 | 239 | 2895713 | 10104.13 | 1500 | 1461 | 286.4 |
| B | 4 | 81 | 67280 | 229.78 | 1500 | 1461 | 286.4 |
| B | 0 | 214 | 49598 | 168.05 | 1500 | 1461 | 286.4 |
| C | 14 | 234 | 35590 | 98.38 | 1494 | 1500 | 346.5 |
| C | 13 | 61 | 10916 | 27.17 | 1494 | 1500 | 346.5 |
| C | 8 | 222 | 4794 | 9.51 | 1494 | 1500 | 346.5 |
| D | 11 | 129 | 1242770 | 3471.34 | 1475 | 1434 | 357.6 |
| D | 1 | 52 | 834521 | 2329.69 | 1475 | 1434 | 357.6 |
| D | 8 | 195 | 514553 | 1434.91 | 1475 | 1434 | 357.6 |
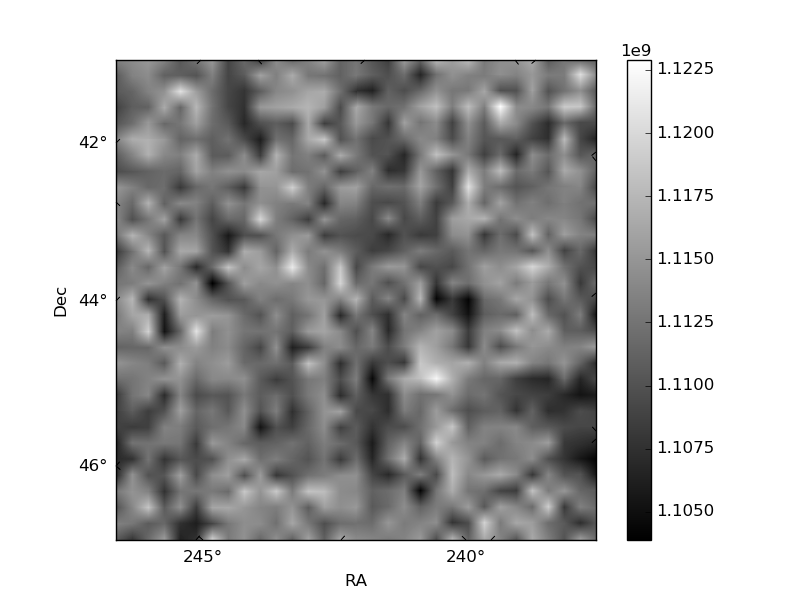
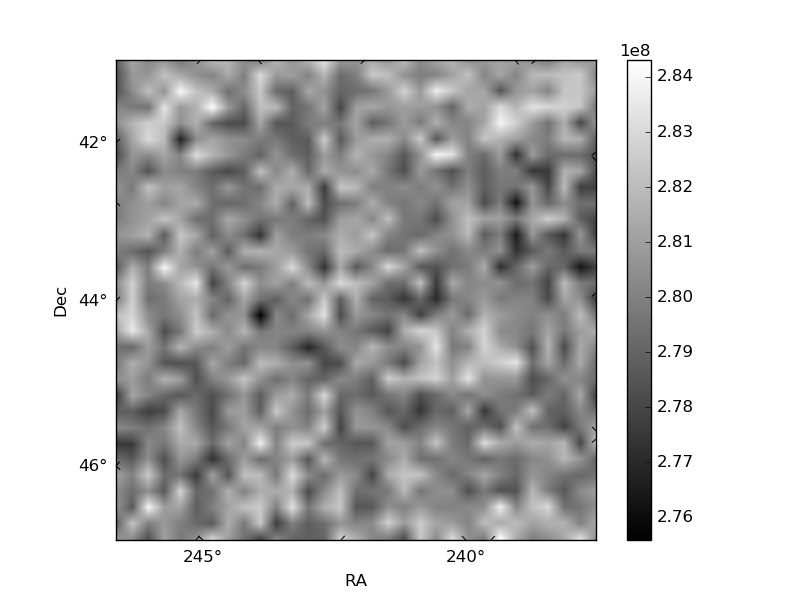
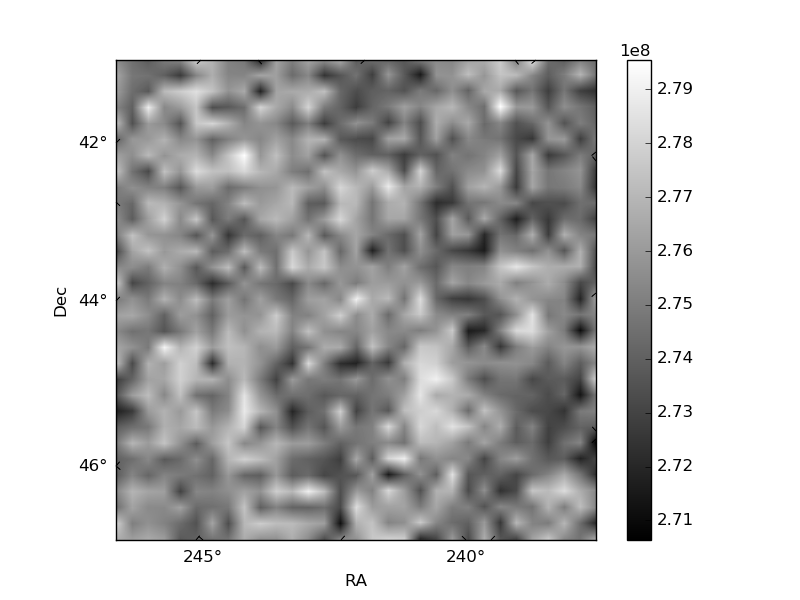
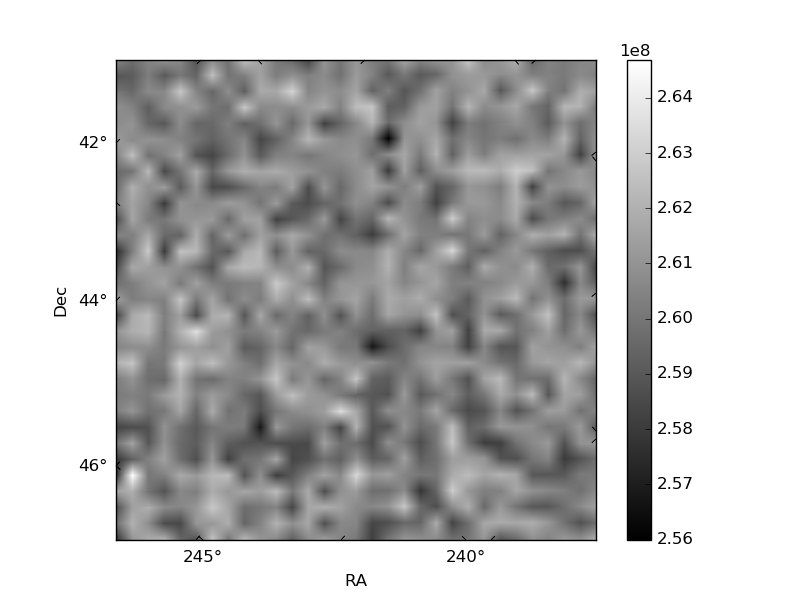
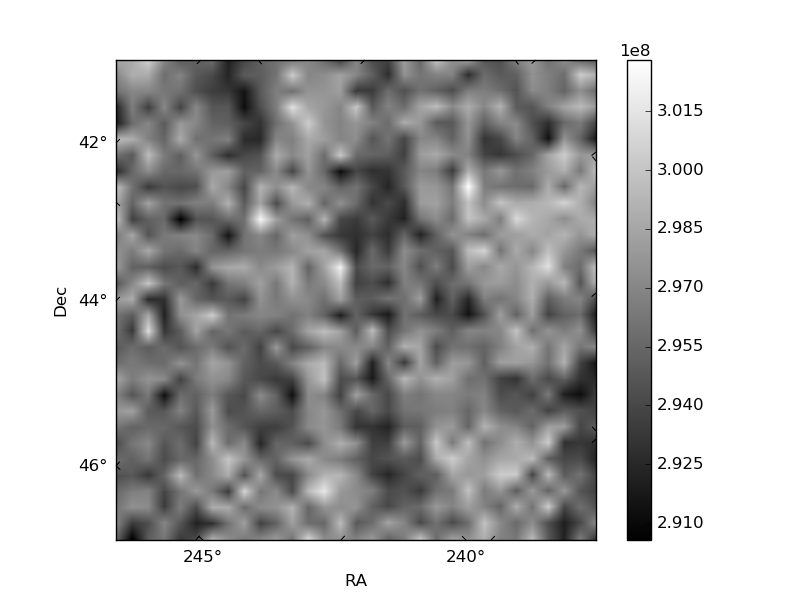
Histogram calculated using DETX and DETY for each event in the final _common_clean file
| Quadrant A | 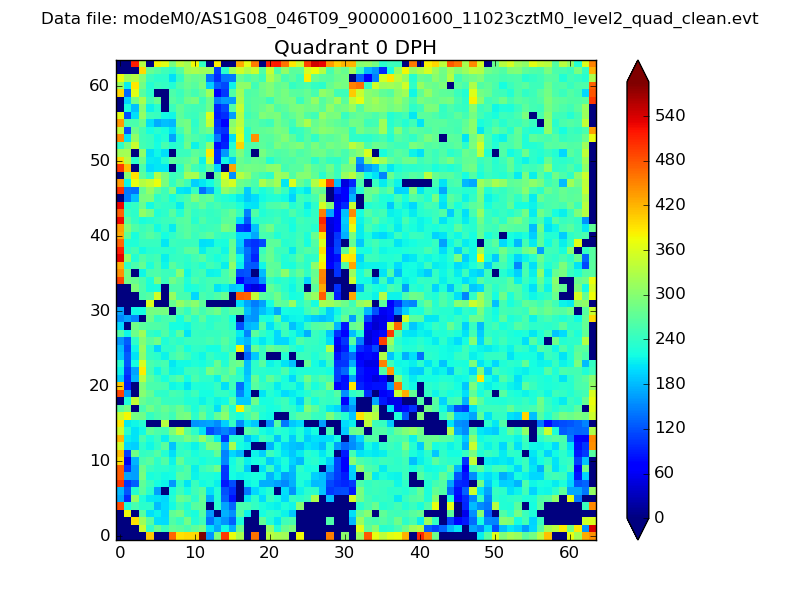 |
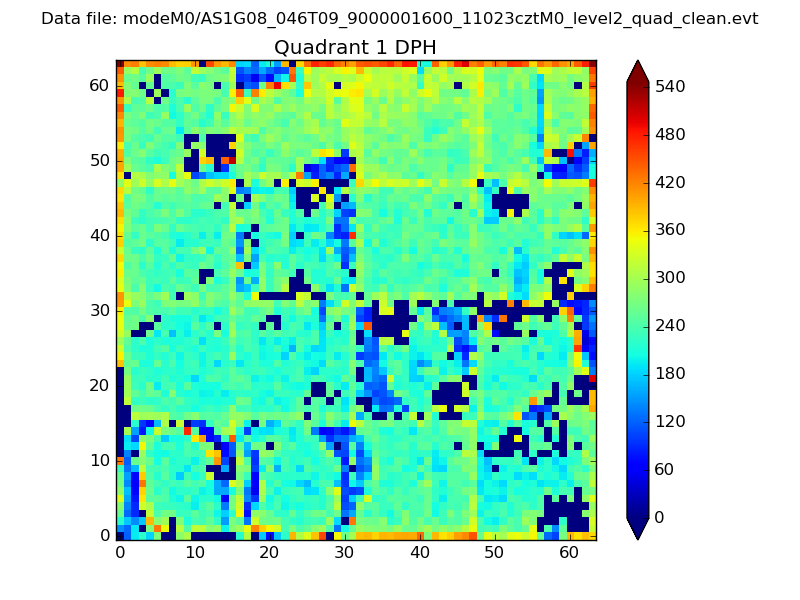 |
Quadrant B |
|---|---|---|---|
| Quadrant D | 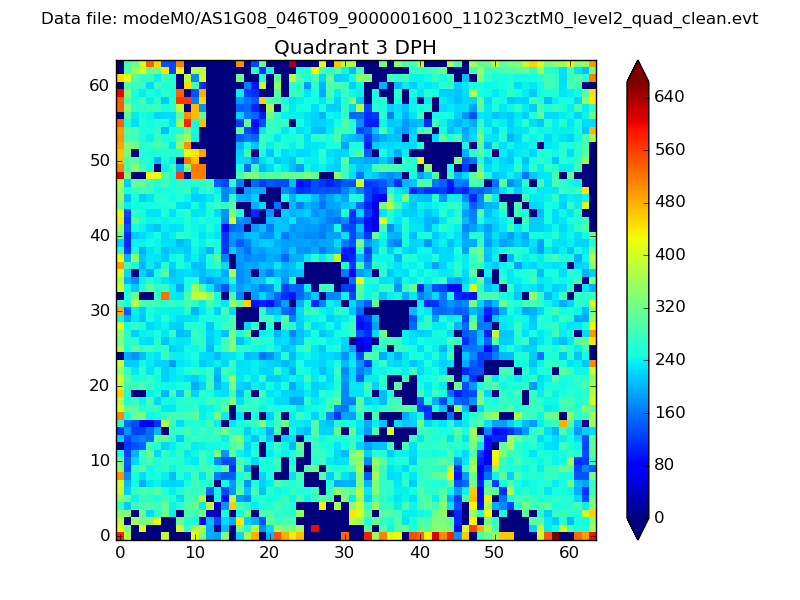 |
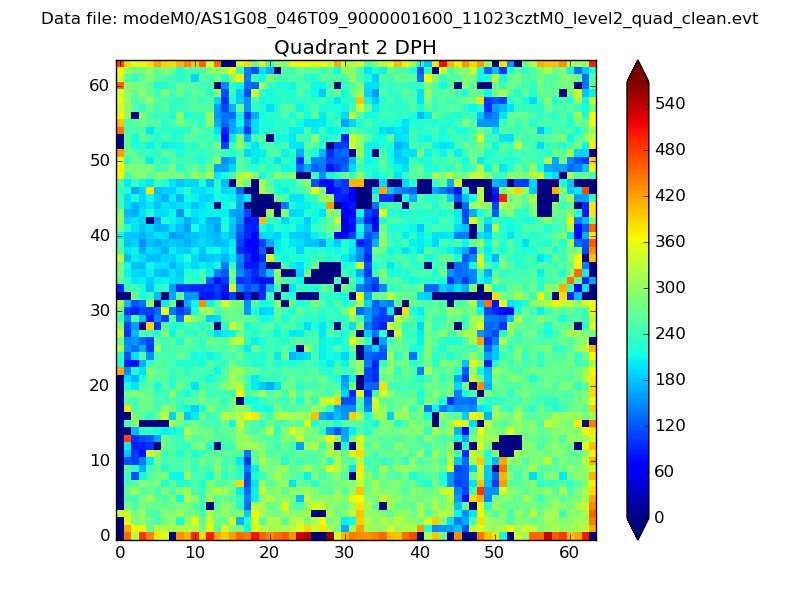 |
Quadrant C |
| Plot type | Count rate plots | Images |
|---|---|---|
| Comparison with Poisson distribution Blue bars denote a histogram of data divided into 1 sec bins. Red curve is a Poisson curve with rate = median count rate of data. |
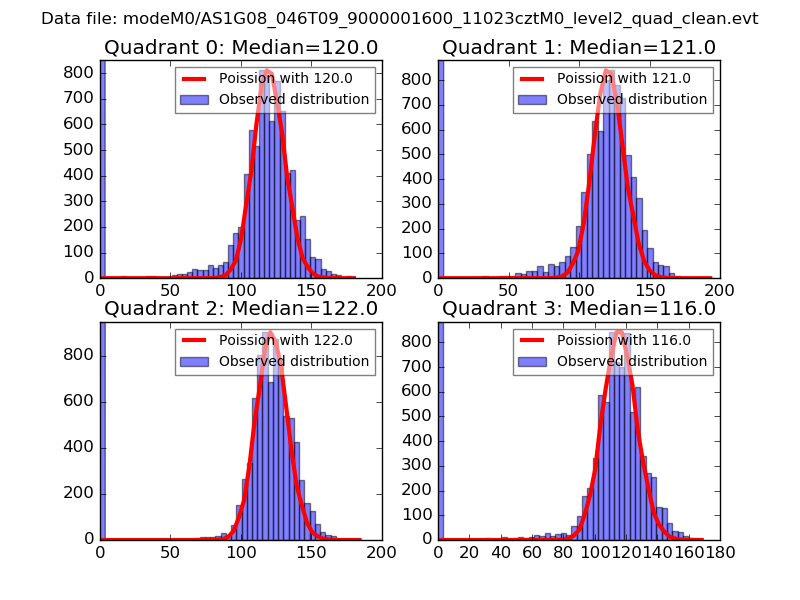 |
 |
| Quadrant-wise count rates Data is divided into 100 sec bins |
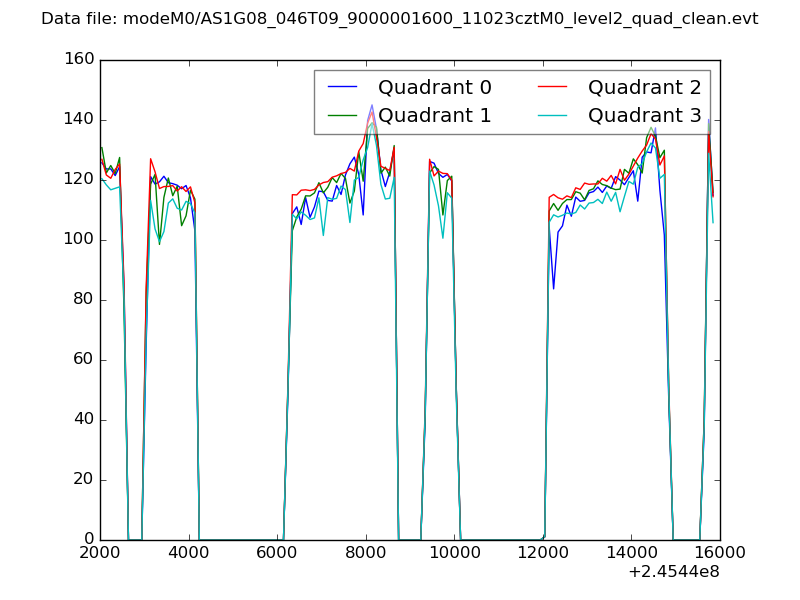 |
|
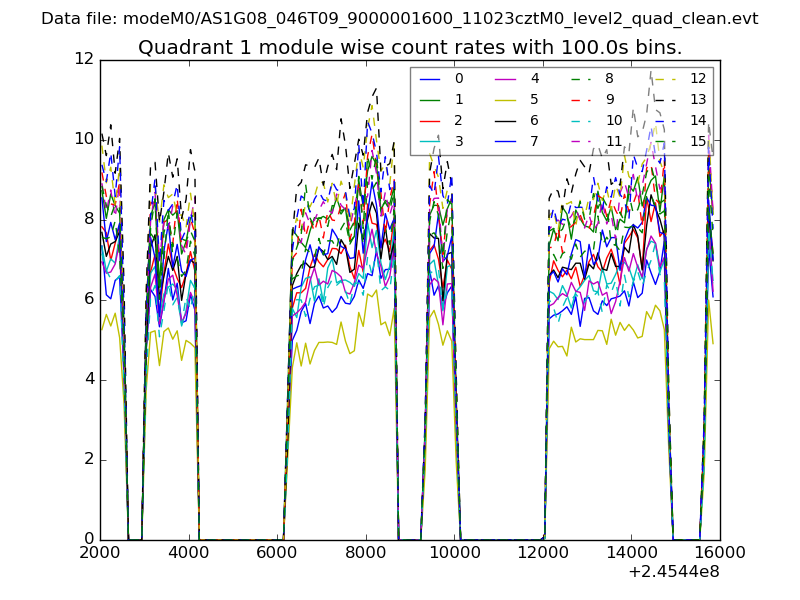
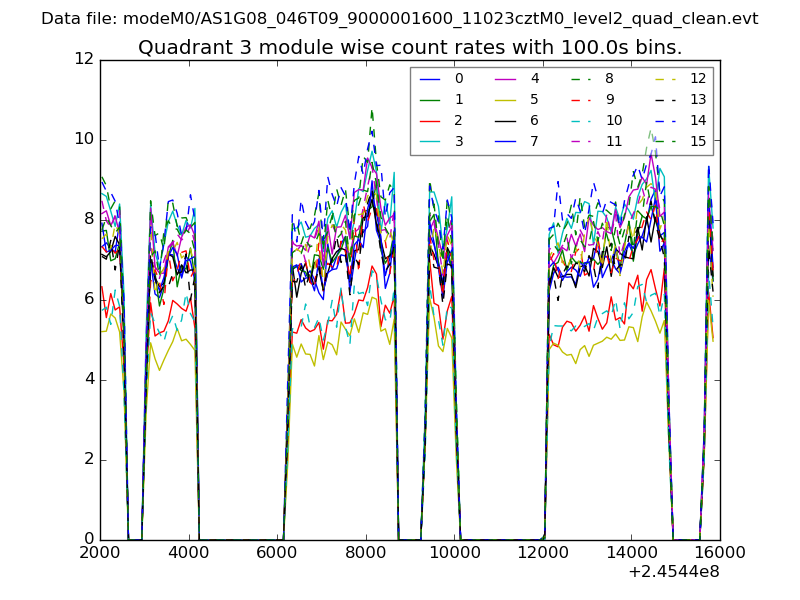
| Module-wise count rates for Quadrant A Data is divided into 100 sec bins |
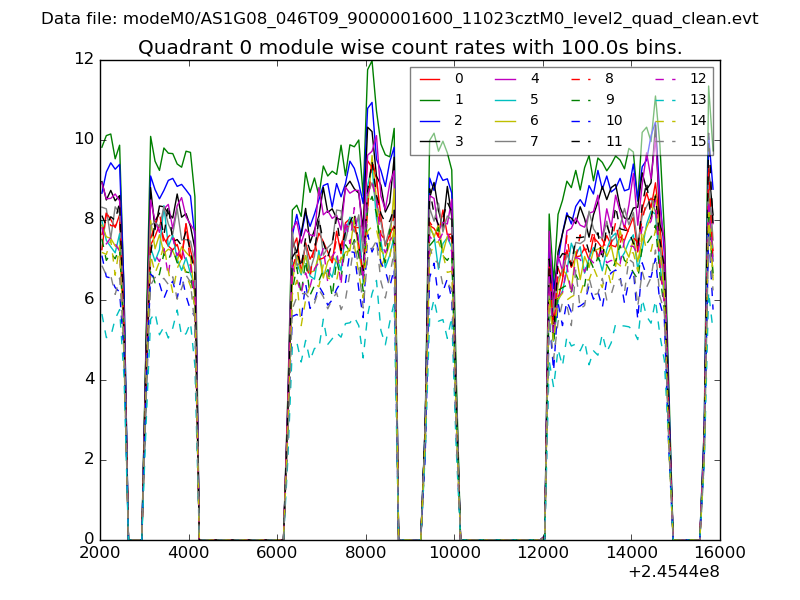 |
 |
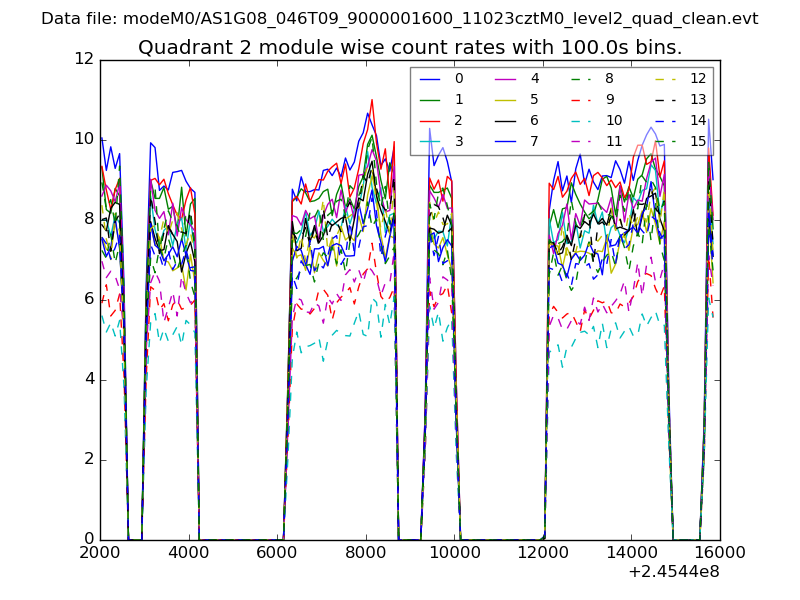
| Module-wise count rates for Quadrant B Data is divided into 100 sec bins |
 |
 |
| Module-wise count rates for Quadrant C Data is divided into 100 sec bins |
 |
 |
| Module-wise count rates for Quadrant D Data is divided into 100 sec bins |
 |
 |
| Parameter | Plot |
|---|---|
| CZT HV Monitor | 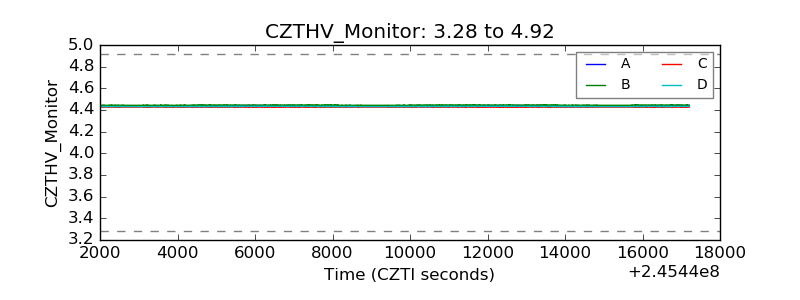 |
| D_VDD | 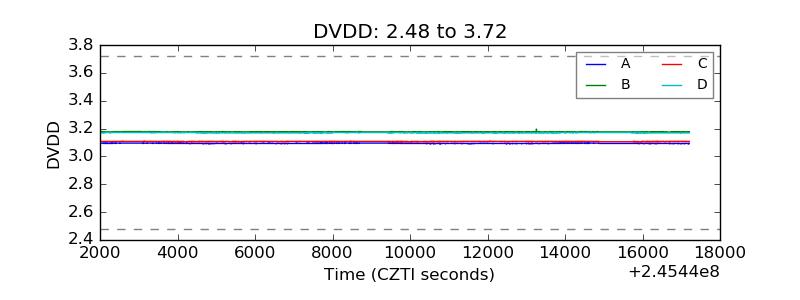 |
| Temperature 1 | 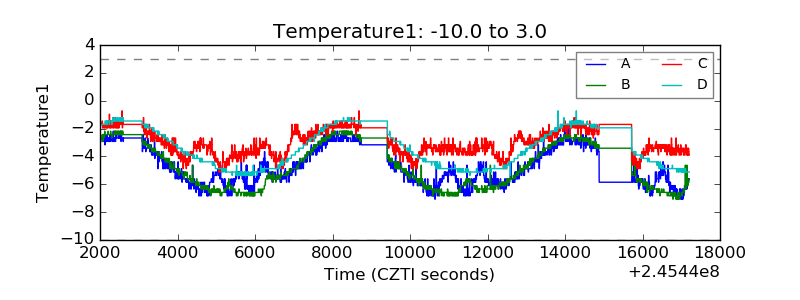 |
| Veto HV Monitor | 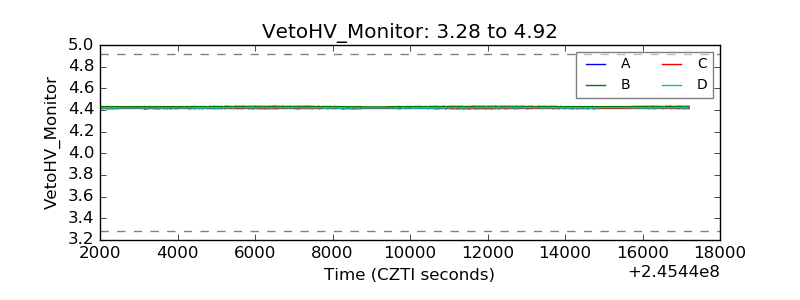 |
| Veto LLD | 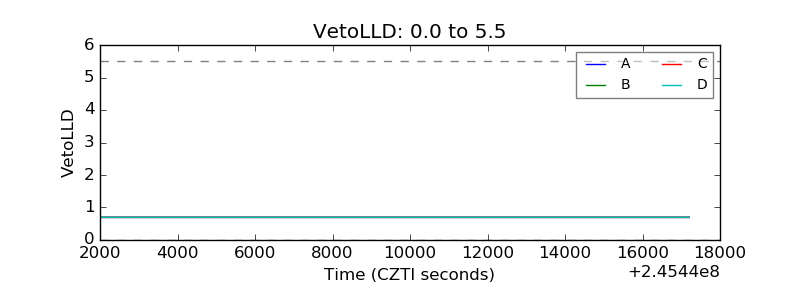 |
| Alpha Counter | 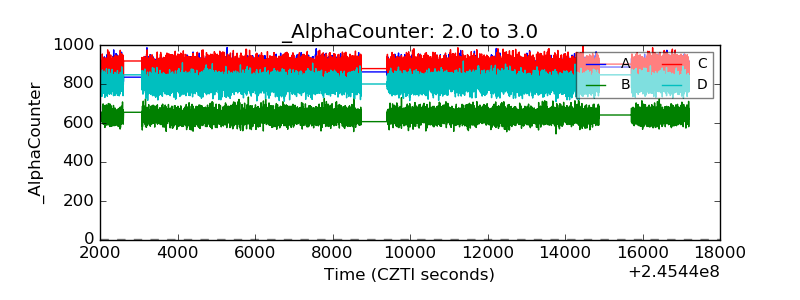 |
| _CPM_Rate | 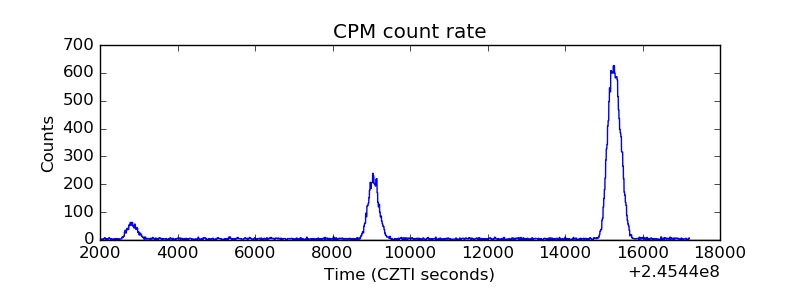 |
| CZT Counter | 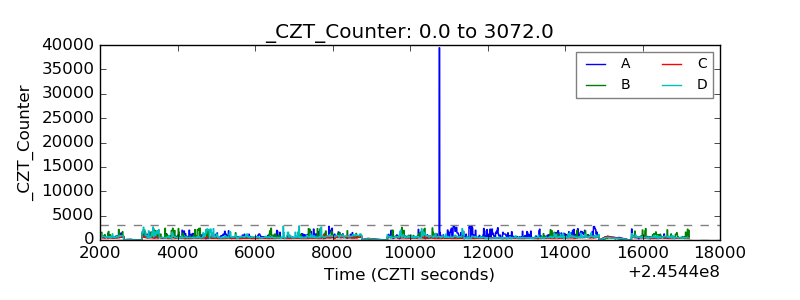 |
| +2.5 Volts monitor |  |
| +5 Volts monitor |  |
| _ROLL_ROT | 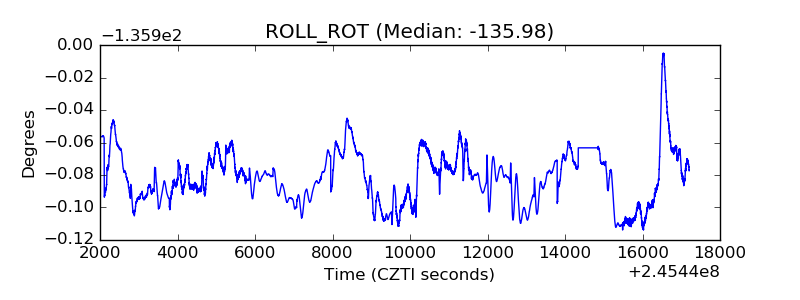 |
| _Roll_DEC | 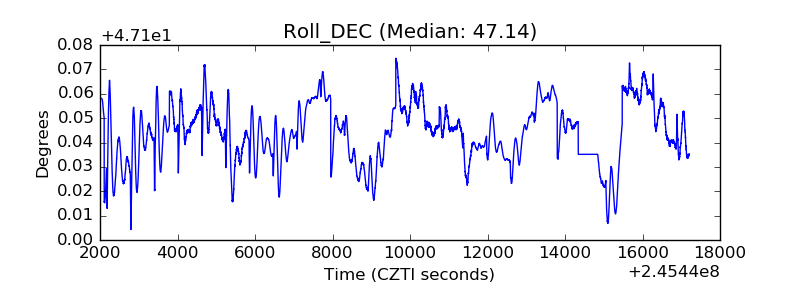 |
| _Roll_RA | 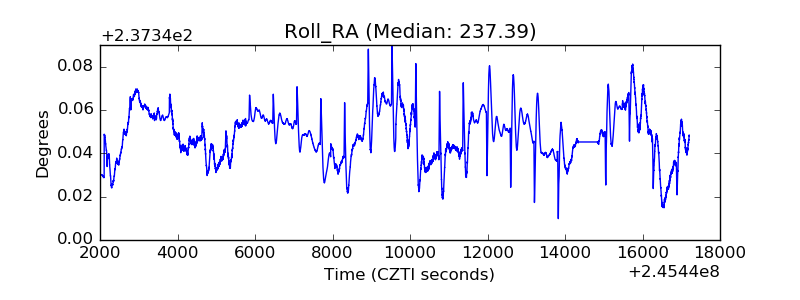 |
| Veto Counter | 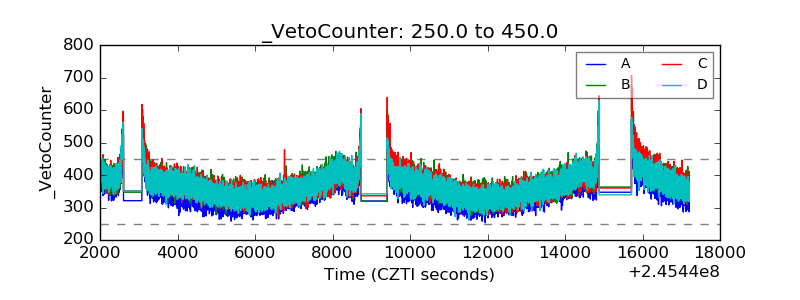 |