| Param | Original file | Final file |
|---|---|---|
| Filename | modeM0/AS1G08_046T09_9000001600_11024cztM0_level2.evt | modeM0/AS1G08_046T09_9000001600_11024cztM0_level2_quad_clean.evt |
| Size (bytes) | 573,514,560 | 68,437,440 |
| Size | 546.9 MB | 65.3 MB |
| Events in quadrant A | 4,694,161 | 398,185 |
| Events in quadrant B | 4,934,338 | 409,555 |
| Events in quadrant C | 3,016,085 | 407,801 |
| Events in quadrant D | 4,272,772 | 391,817 |
| Mode M0 | |||
|---|---|---|---|
| Quadrant | BADHDUFLAG | Total packets | Discarded packets |
| A | 0 | 18496 | 3 |
| B | 0 | 19122 | 2 |
| C | 0 | 13593 | 2 |
| D | 0 | 17157 | 2 |
| Mode M9 | |||
|---|---|---|---|
| Quadrant | BADHDUFLAG | Total packets | Discarded packets |
| A | 0 | 16 | 0 |
| B | 0 | 16 | 0 |
| C | 0 | 16 | 0 |
| D | 0 | 17 | 0 |
| Mode SS | |||
|---|---|---|---|
| Quadrant | BADHDUFLAG | Total packets | Discarded packets |
| A | 0 | 134 | 0 |
| B | 0 | 134 | 0 |
| C | 0 | 134 | 0 |
| D | 0 | 134 | 0 |
| Quadrant | Total seconds | Saturated seconds | Saturation percentage |
|---|---|---|---|
| A | 6669 | 448 | 6.717649% |
| B | 6669 | 457 | 6.852602% |
| C | 6669 | 18 | 0.269906% |
| D | 6669 | 227 | 3.403809% |
Noise dominated data is calculated using 1-second bins in cleaned event files. If a bin has >2000 counts, and if more than 50% of those come from <1% of pixels, then it is considered to be noise-dominated and hence unusable.
| Quadrant | # 1 sec bins | Bins with >0 counts | Bins with >2000 counts | High rate bins dominated by noise | Noise dominated (total time) | Noise dominated (detector-on time) | Marked lightcurve |
|---|---|---|---|---|---|---|---|
| A | 7674 | 6669 | 349 | 349 | 4.55% | 5.23% | 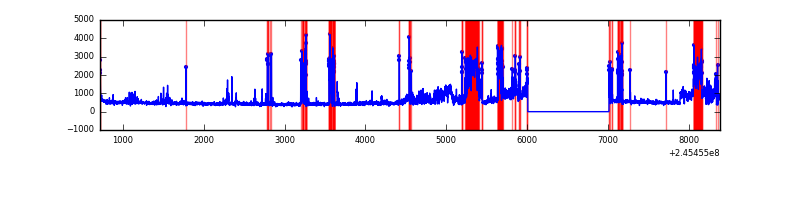 |
| B | 7674 | 6670 | 297 | 297 | 3.87% | 4.45% | 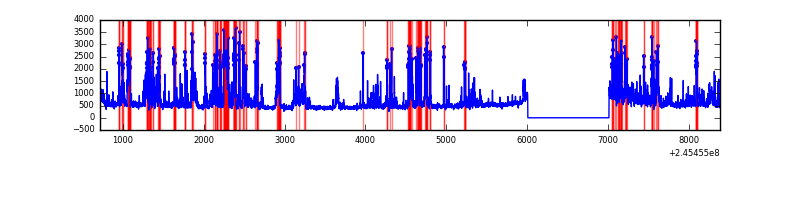 |
| C | 7674 | 6670 | 0 | 0 | 0.00% | 0.00% | 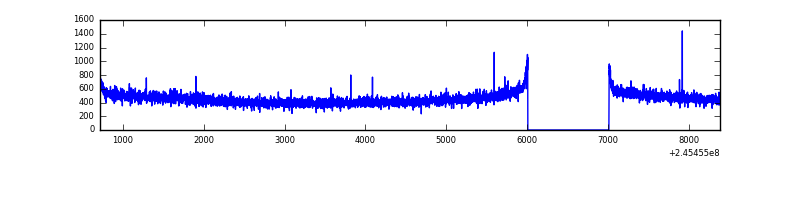 |
| D | 7674 | 6670 | 151 | 151 | 1.97% | 2.26% | 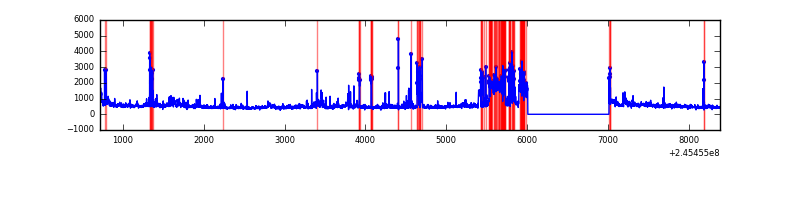 |
Top three noisy pixels from each quadrant. If the there are fewer than three noisy pixels in the level2.evt file, extra rows are filled as -1
| Pixel properties | Quadrant properties | ||||||
|---|---|---|---|---|---|---|---|
| Quadrant | DetID | PixID | Counts | Sigma | Mean | Median | Sigma |
| A | 8 | 5 | 1407615 | 8909.07 | 772 | 757 | 157.9 |
| A | 15 | 174 | 259760 | 1640.16 | 772 | 757 | 157.9 |
| A | 14 | 238 | 25677 | 157.81 | 772 | 757 | 157.9 |
| B | 4 | 239 | 1558694 | 10496.76 | 776 | 758 | 148.4 |
| B | 10 | 244 | 242141 | 1626.34 | 776 | 758 | 148.4 |
| B | 0 | 214 | 39960 | 264.13 | 776 | 758 | 148.4 |
| C | 13 | 61 | 5646 | 27.18 | 772 | 776 | 179.2 |
| C | 14 | 238 | 3490 | 15.15 | 772 | 776 | 179.2 |
| C | 12 | 4 | 2633 | 10.36 | 772 | 776 | 179.2 |
| D | 1 | 52 | 725718 | 3916.77 | 761 | 740 | 185.1 |
| D | 11 | 129 | 386641 | 2084.87 | 761 | 740 | 185.1 |
| D | 8 | 195 | 118099 | 634.04 | 761 | 740 | 185.1 |
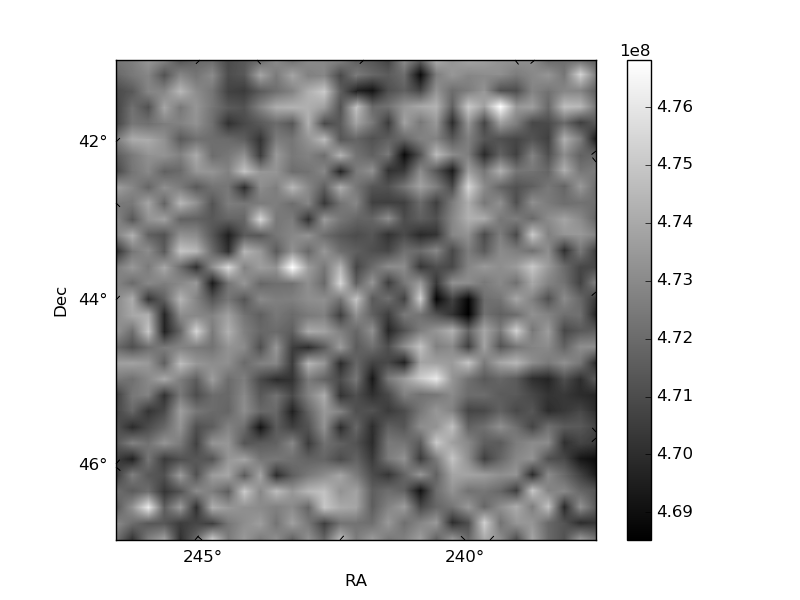
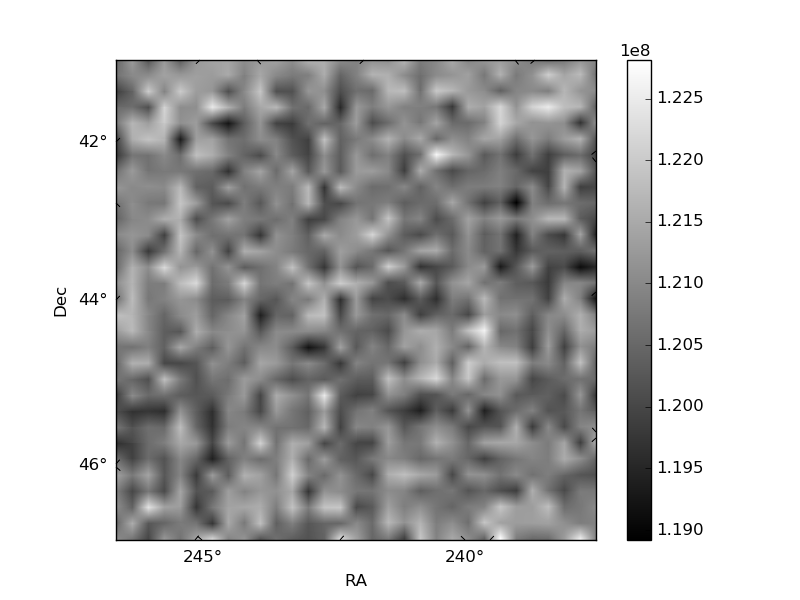
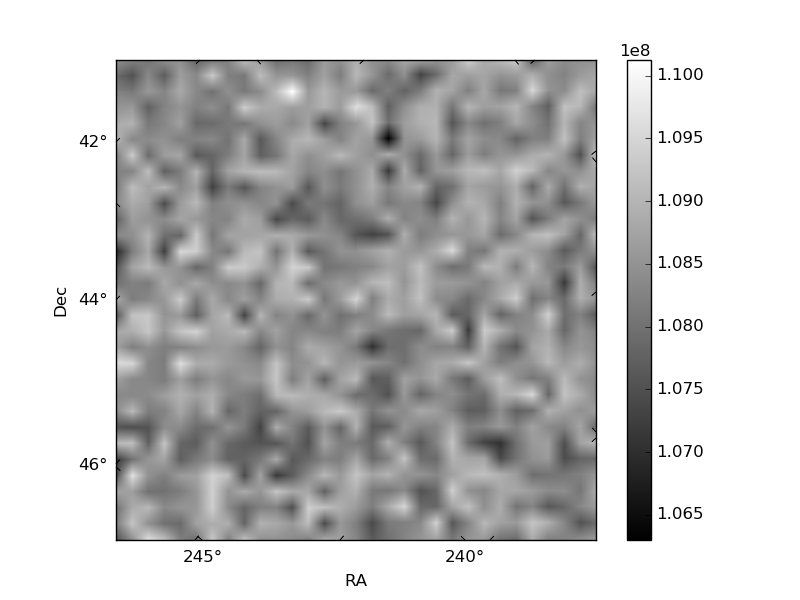
Histogram calculated using DETX and DETY for each event in the final _common_clean file
| Quadrant A | 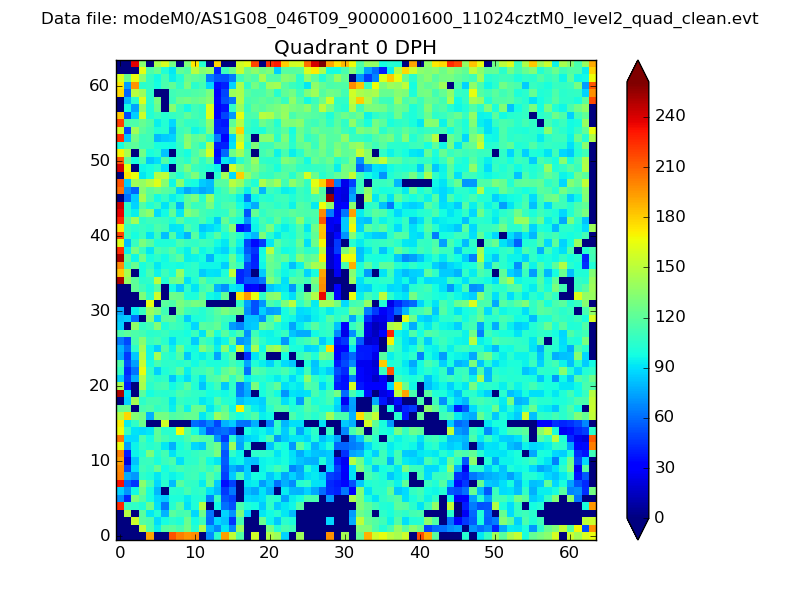 |
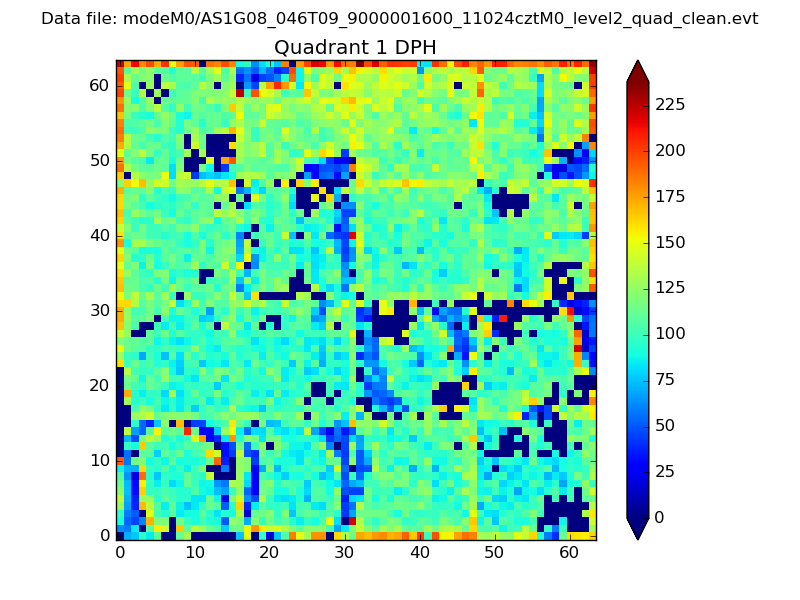 |
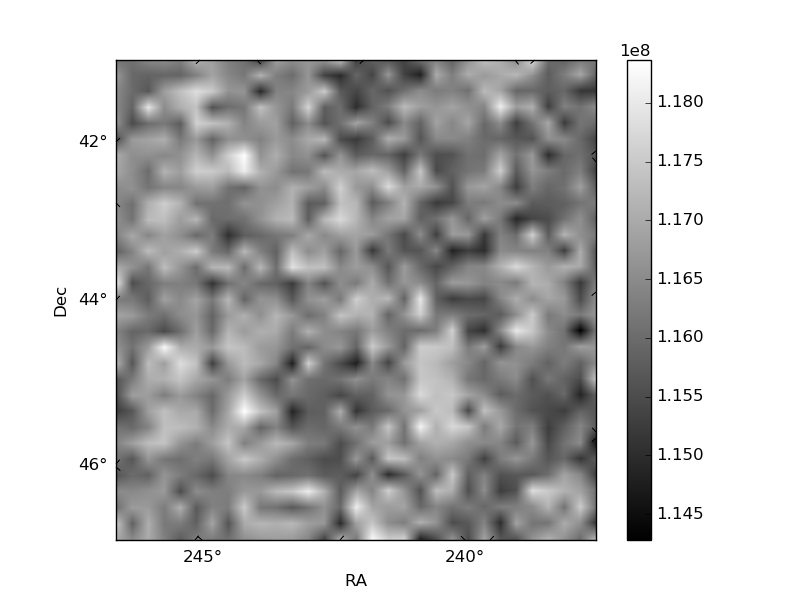
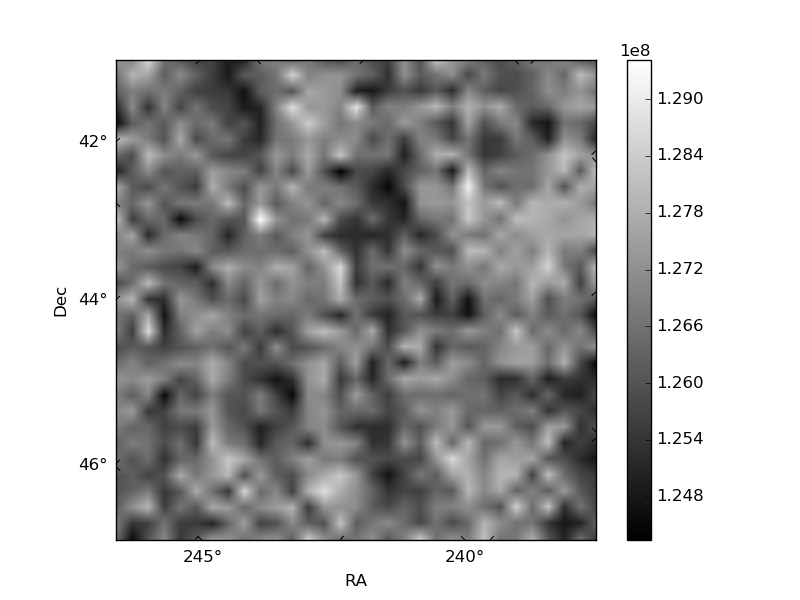
Quadrant B |
|---|---|---|---|
| Quadrant D | 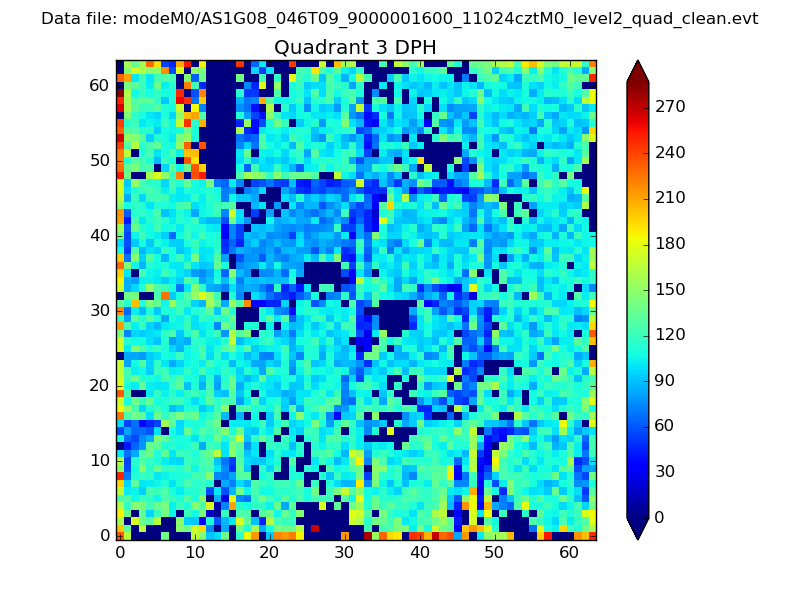 |
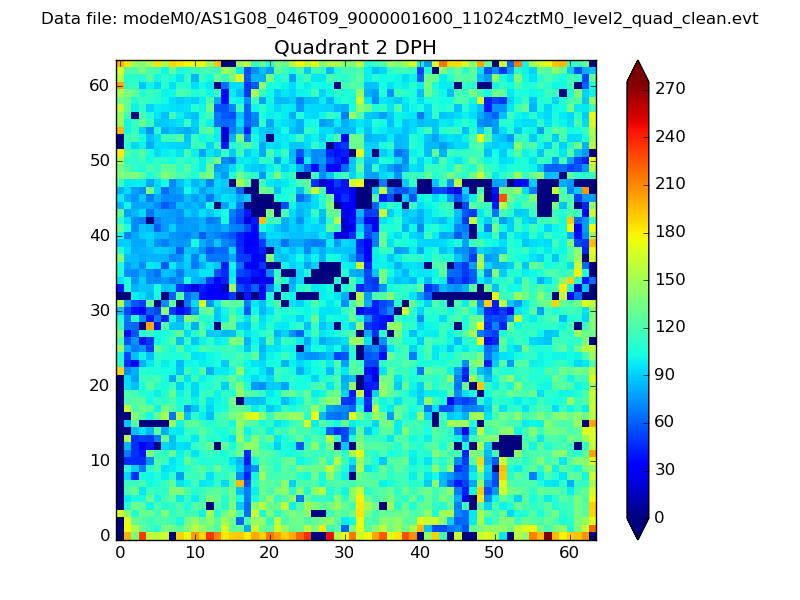 |
Quadrant C |
| Plot type | Count rate plots | Images |
|---|---|---|
| Comparison with Poisson distribution Blue bars denote a histogram of data divided into 1 sec bins. Red curve is a Poisson curve with rate = median count rate of data. |
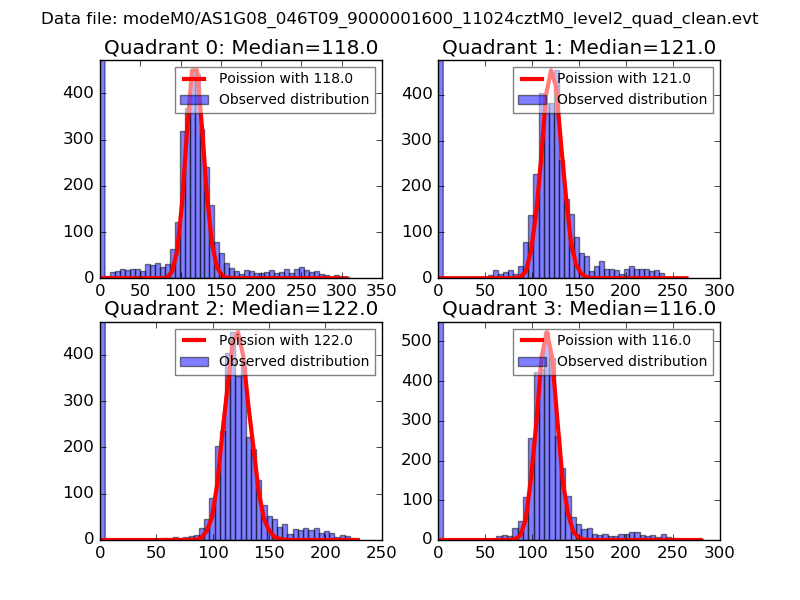 |
 |
| Quadrant-wise count rates Data is divided into 100 sec bins |
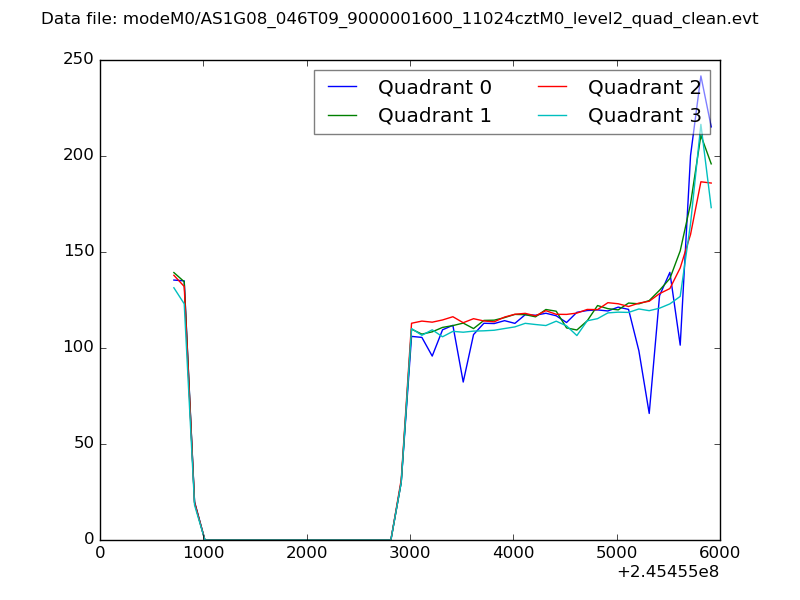 |
|
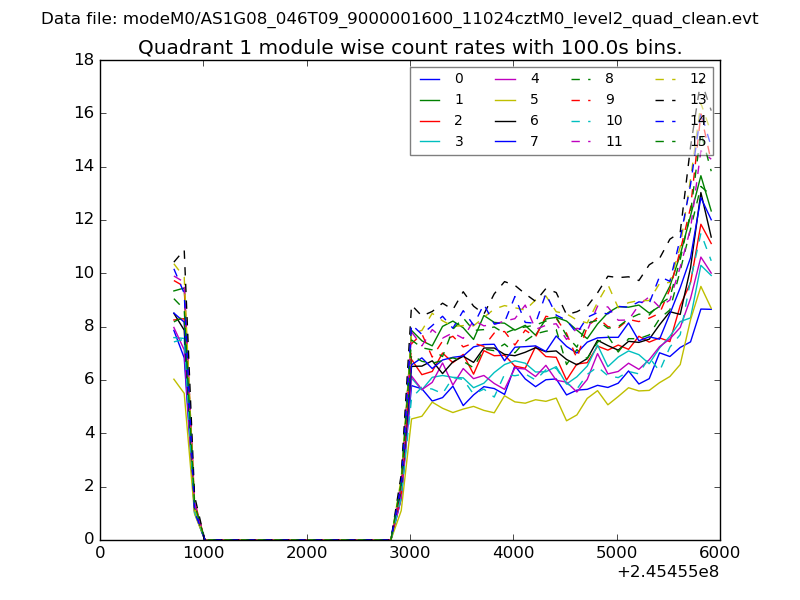
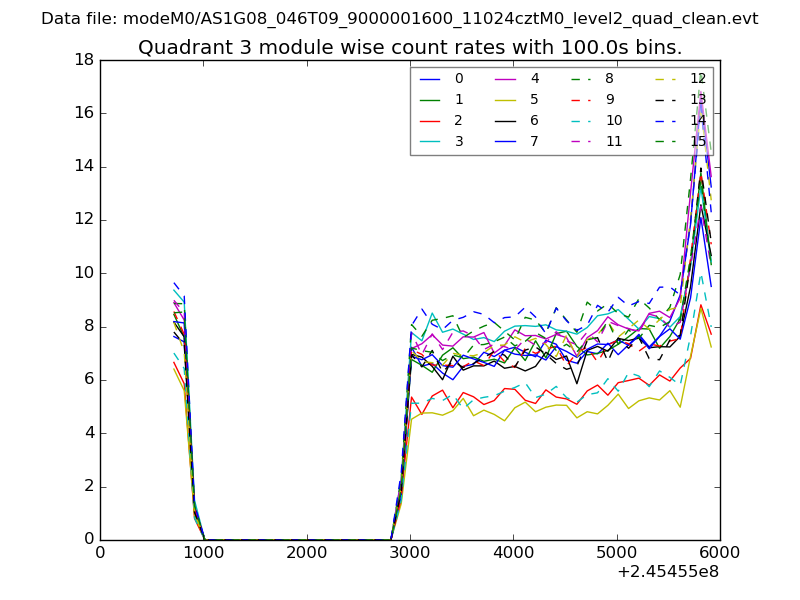
| Module-wise count rates for Quadrant A Data is divided into 100 sec bins |
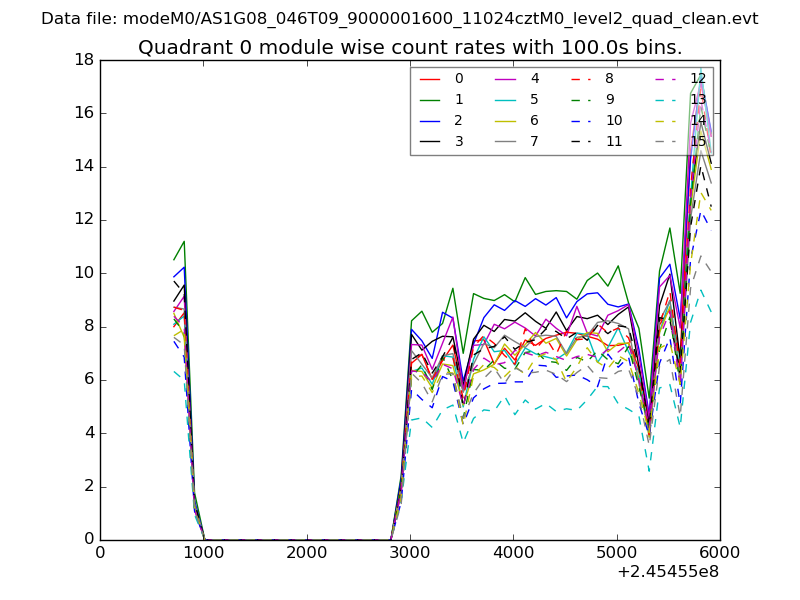 |
 |
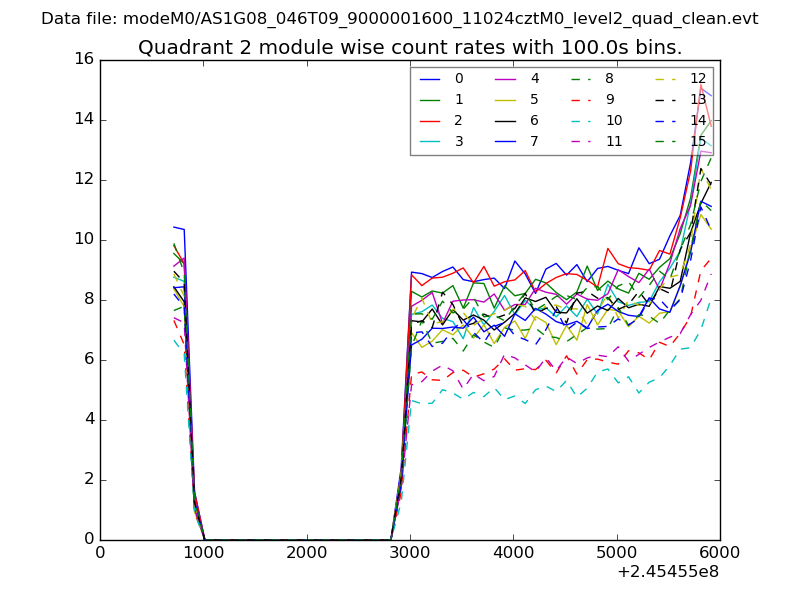
| Module-wise count rates for Quadrant B Data is divided into 100 sec bins |
 |
 |
| Module-wise count rates for Quadrant C Data is divided into 100 sec bins |
 |
 |
| Module-wise count rates for Quadrant D Data is divided into 100 sec bins |
 |
 |
| Parameter | Plot |
|---|---|
| CZT HV Monitor | 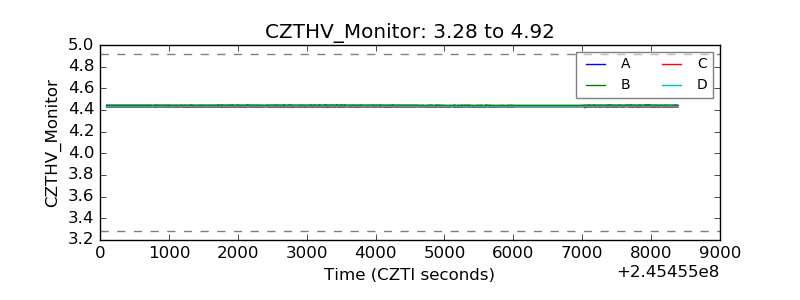 |
| D_VDD | 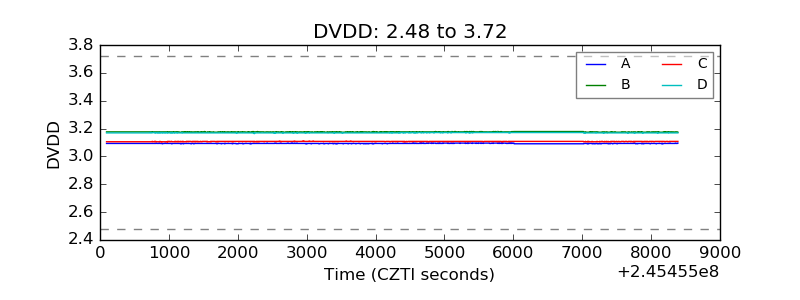 |
| Temperature 1 |  |
| Veto HV Monitor | 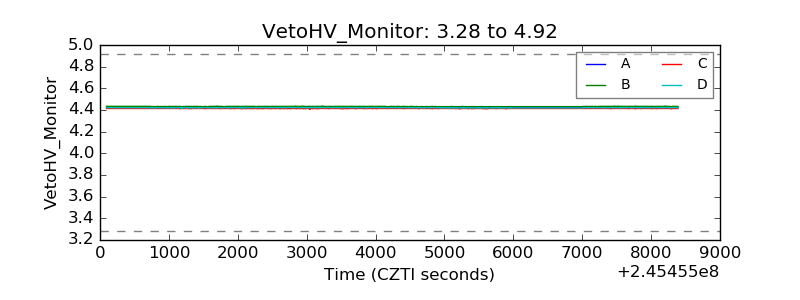 |
| Veto LLD | 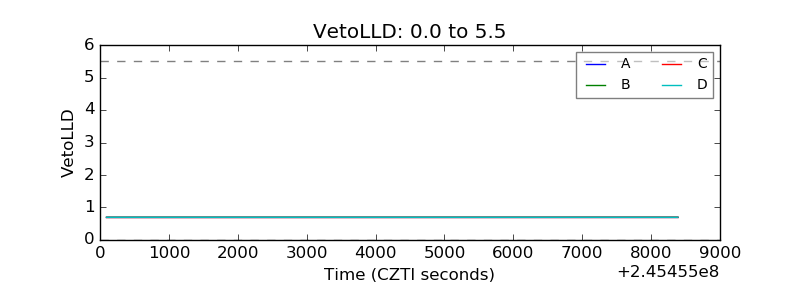 |
| Alpha Counter | 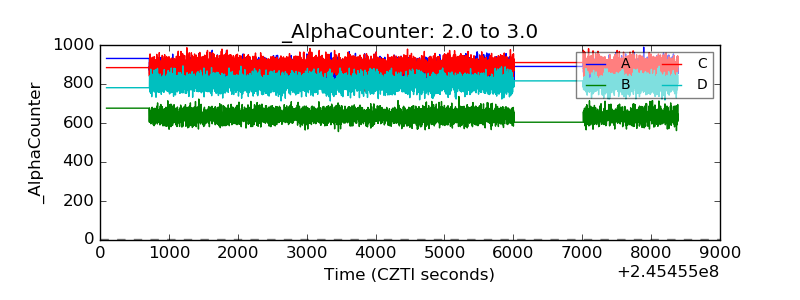 |
| _CPM_Rate |  |
| CZT Counter | 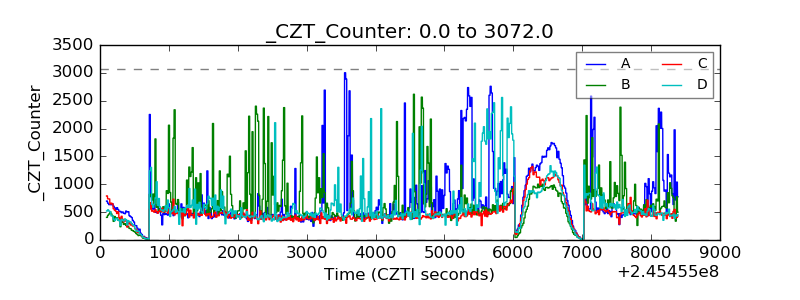 |
| +2.5 Volts monitor |  |
| +5 Volts monitor |  |
| _ROLL_ROT | 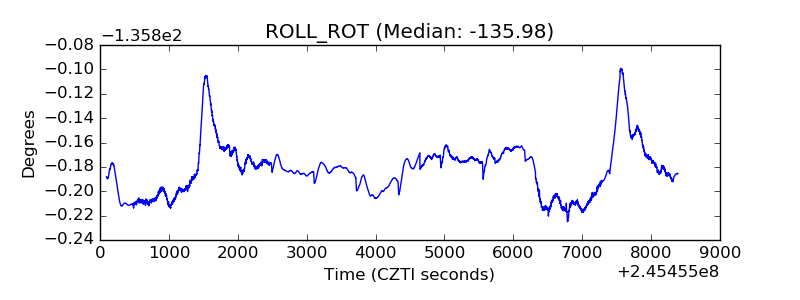 |
| _Roll_DEC |  |
| _Roll_RA | 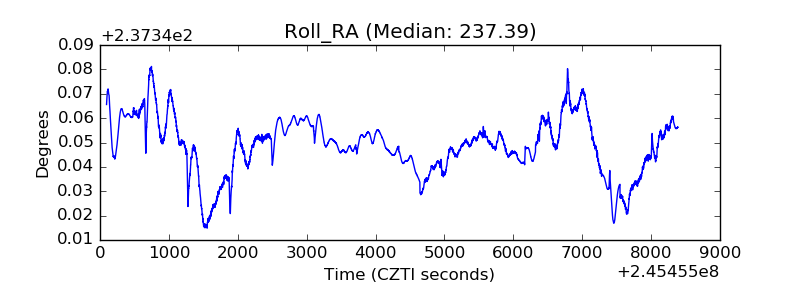 |
| Veto Counter | 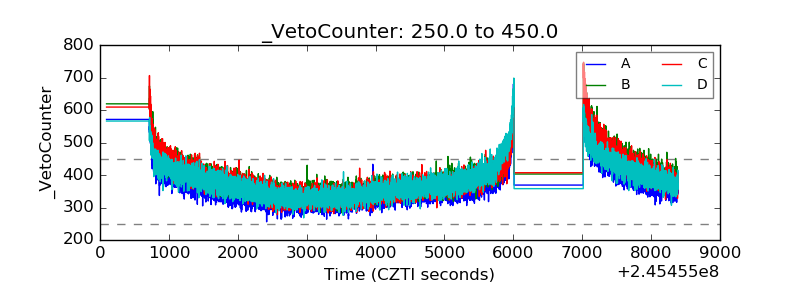 |