| Param | Original file | Final file |
|---|---|---|
| Filename | modeM0/AS1G08_046T09_9000001600_11026cztM0_level2.evt | modeM0/AS1G08_046T09_9000001600_11026cztM0_level2_quad_clean.evt |
| Size (bytes) | 585,325,440 | 71,461,440 |
| Size | 558.2 MB | 68.2 MB |
| Events in quadrant A | 5,505,089 | 418,968 |
| Events in quadrant B | 4,867,570 | 429,449 |
| Events in quadrant C | 3,055,271 | 434,191 |
| Events in quadrant D | 3,851,735 | 420,741 |
| Mode M0 | |||
|---|---|---|---|
| Quadrant | BADHDUFLAG | Total packets | Discarded packets |
| A | 0 | 20919 | 3 |
| B | 0 | 18821 | 2 |
| C | 0 | 13581 | 2 |
| D | 0 | 15887 | 2 |
| Mode M9 | |||
|---|---|---|---|
| Quadrant | BADHDUFLAG | Total packets | Discarded packets |
| A | 0 | 22 | 0 |
| B | 0 | 22 | 0 |
| C | 0 | 22 | 0 |
| D | 0 | 22 | 0 |
| Mode SS | |||
|---|---|---|---|
| Quadrant | BADHDUFLAG | Total packets | Discarded packets |
| A | 0 | 136 | 0 |
| B | 0 | 136 | 0 |
| C | 0 | 136 | 0 |
| D | 0 | 136 | 0 |
| Quadrant | Total seconds | Saturated seconds | Saturation percentage |
|---|---|---|---|
| A | 6599 | 474 | 7.182907% |
| B | 6599 | 453 | 6.864676% |
| C | 6599 | 24 | 0.363691% |
| D | 6599 | 158 | 2.394302% |
Noise dominated data is calculated using 1-second bins in cleaned event files. If a bin has >2000 counts, and if more than 50% of those come from <1% of pixels, then it is considered to be noise-dominated and hence unusable.
| Quadrant | # 1 sec bins | Bins with >0 counts | Bins with >2000 counts | High rate bins dominated by noise | Noise dominated (total time) | Noise dominated (detector-on time) | Marked lightcurve |
|---|---|---|---|---|---|---|---|
| A | 8760 | 6600 | 333 | 333 | 3.80% | 5.05% |  |
| B | 8760 | 6601 | 256 | 256 | 2.92% | 3.88% | 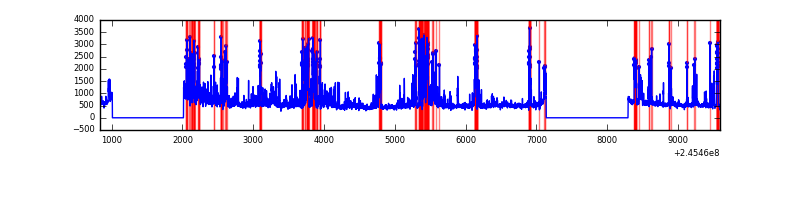 |
| C | 8760 | 6601 | 0 | 0 | 0.00% | 0.00% | 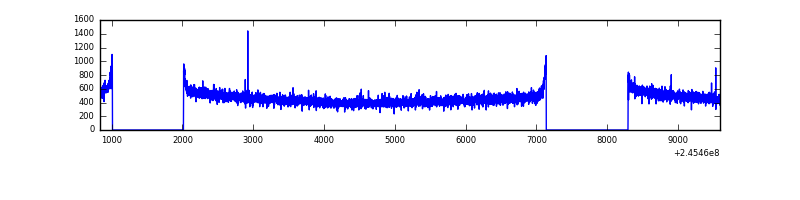 |
| D | 8760 | 6601 | 83 | 83 | 0.95% | 1.26% |  |
Top three noisy pixels from each quadrant. If the there are fewer than three noisy pixels in the level2.evt file, extra rows are filled as -1
| Pixel properties | Quadrant properties | ||||||
|---|---|---|---|---|---|---|---|
| Quadrant | DetID | PixID | Counts | Sigma | Mean | Median | Sigma |
| A | 8 | 5 | 1426939 | 8912.96 | 787 | 772 | 160.0 |
| A | 15 | 174 | 969566 | 6054.56 | 787 | 772 | 160.0 |
| A | 14 | 238 | 30738 | 187.28 | 787 | 772 | 160.0 |
| B | 4 | 239 | 1218409 | 8049.44 | 790 | 772 | 151.3 |
| B | 10 | 244 | 504384 | 3329.23 | 790 | 772 | 151.3 |
| B | 4 | 81 | 34880 | 225.48 | 790 | 772 | 151.3 |
| C | 13 | 61 | 5614 | 26.76 | 782 | 787 | 180.4 |
| C | 12 | 175 | 4323 | 19.6 | 782 | 787 | 180.4 |
| C | 14 | 238 | 3544 | 15.28 | 782 | 787 | 180.4 |
| D | 11 | 129 | 310692 | 1677.25 | 772 | 750 | 184.8 |
| D | 1 | 52 | 199033 | 1073.01 | 772 | 750 | 184.8 |
| D | 2 | 14 | 172403 | 928.9 | 772 | 750 | 184.8 |
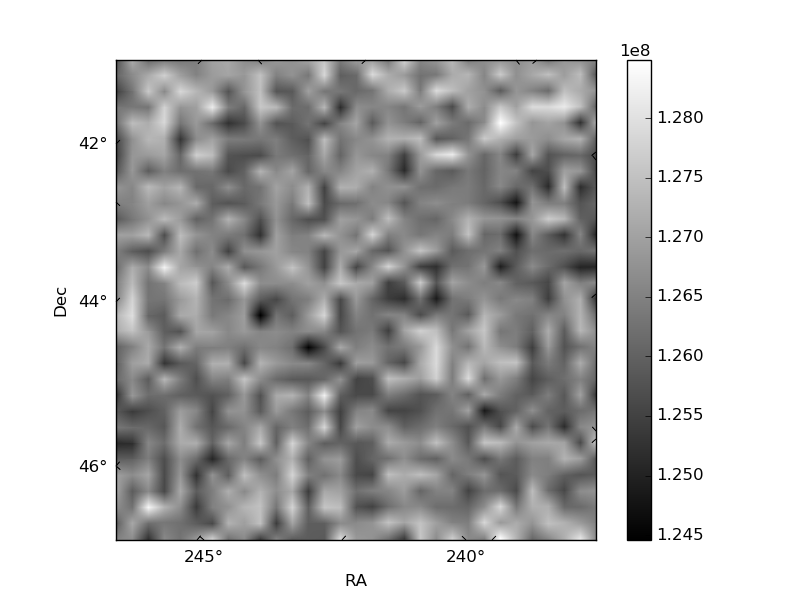
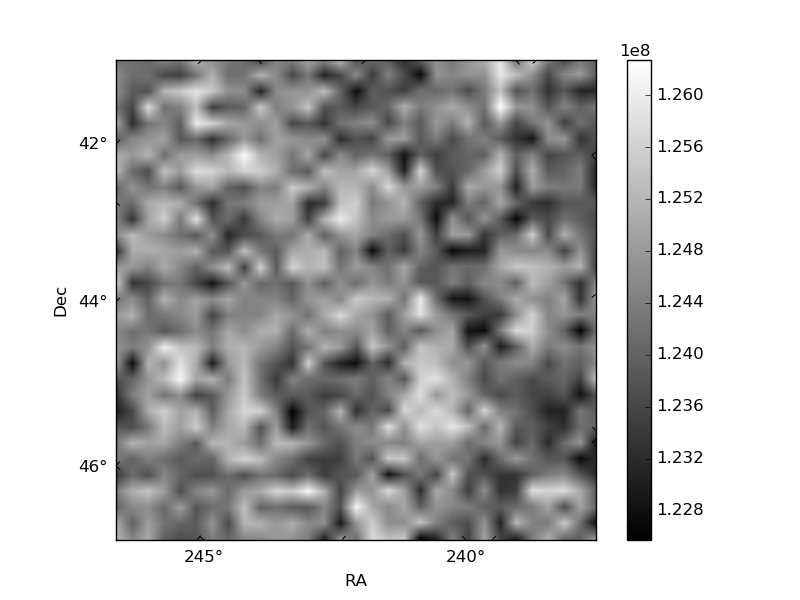
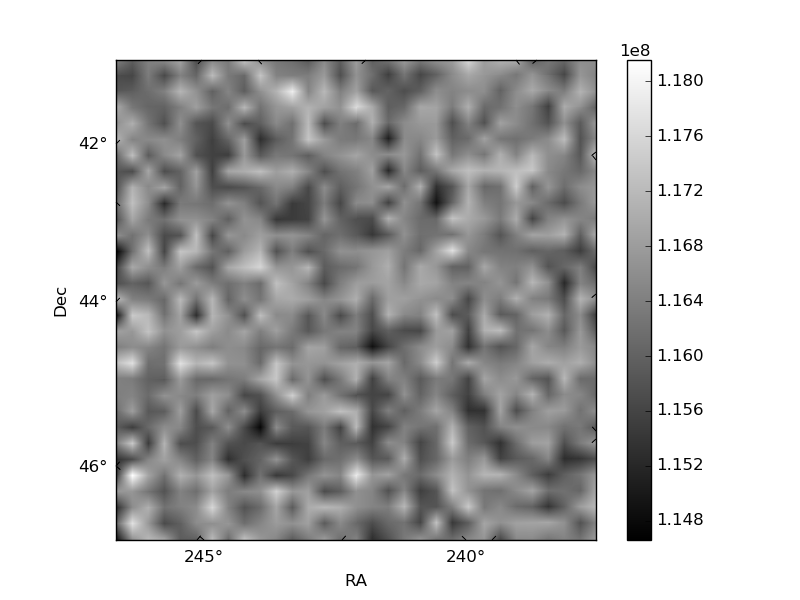
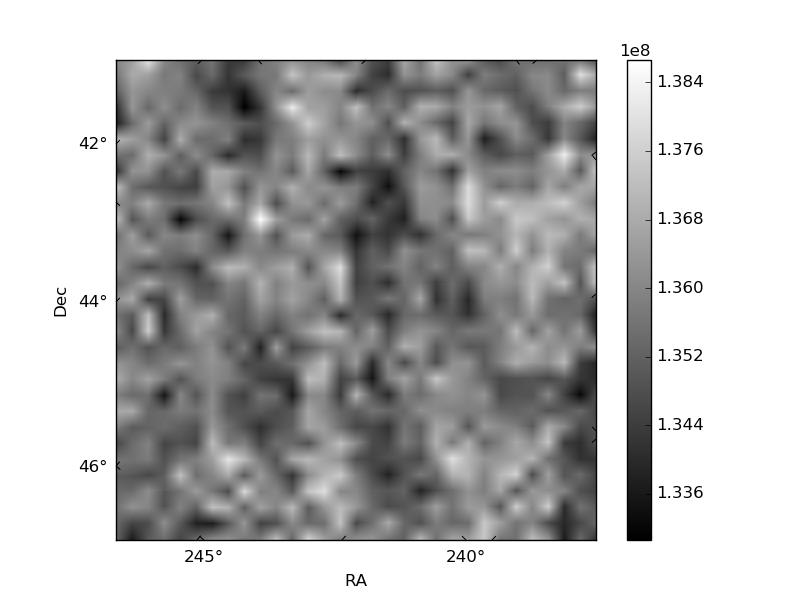
Histogram calculated using DETX and DETY for each event in the final _common_clean file
| Quadrant A | 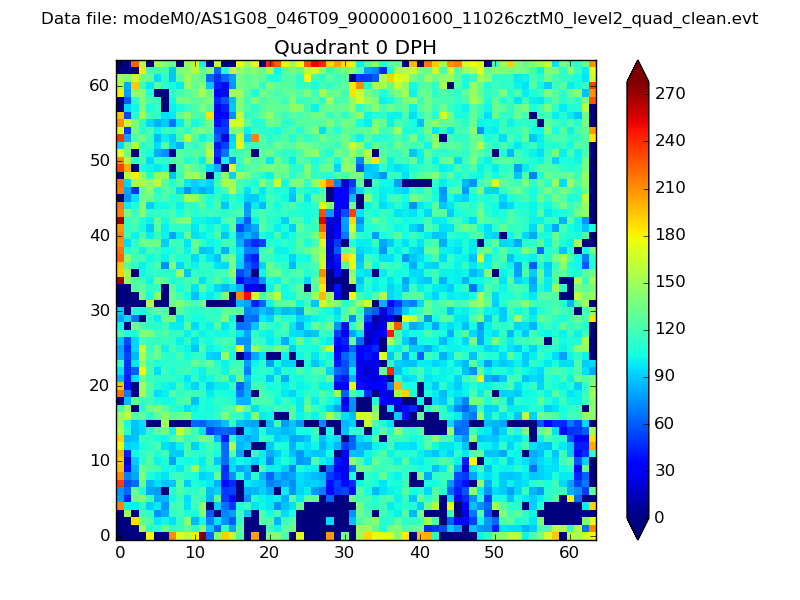 |
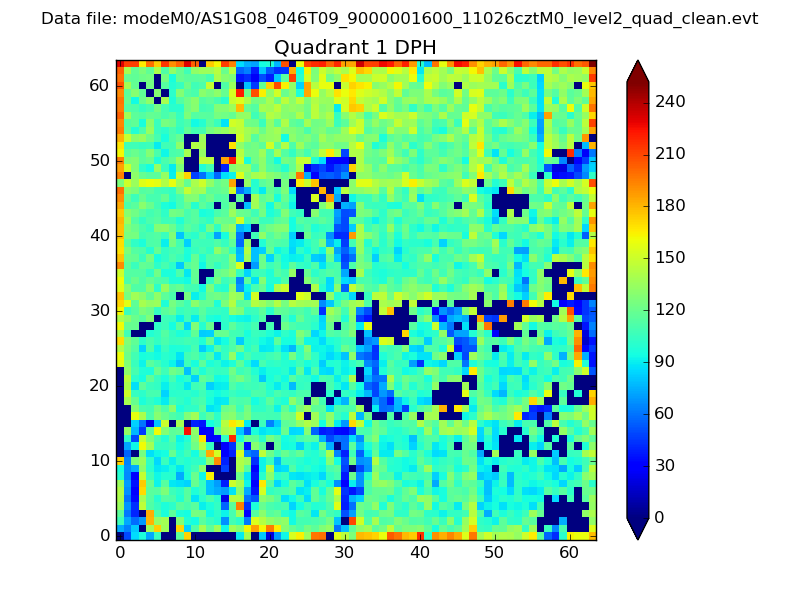 |
Quadrant B |
|---|---|---|---|
| Quadrant D |  |
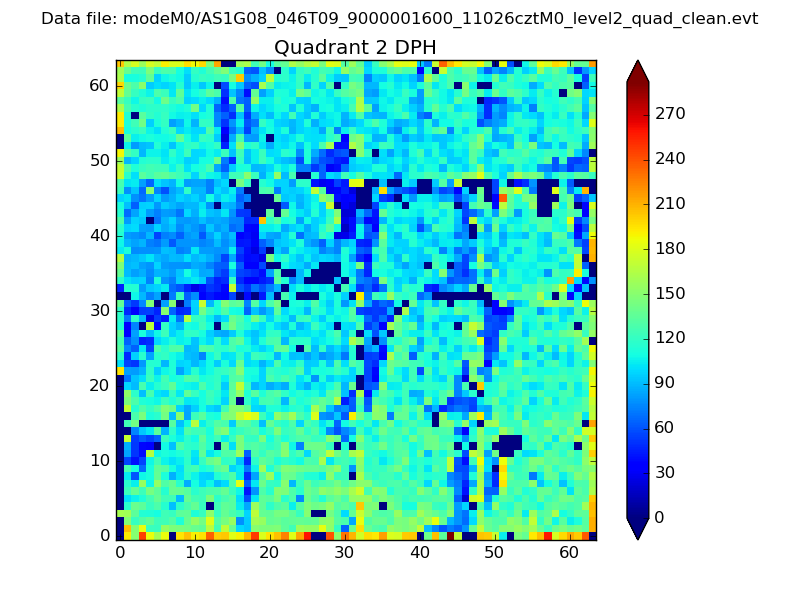 |
Quadrant C |
| Plot type | Count rate plots | Images |
|---|---|---|
| Comparison with Poisson distribution Blue bars denote a histogram of data divided into 1 sec bins. Red curve is a Poisson curve with rate = median count rate of data. |
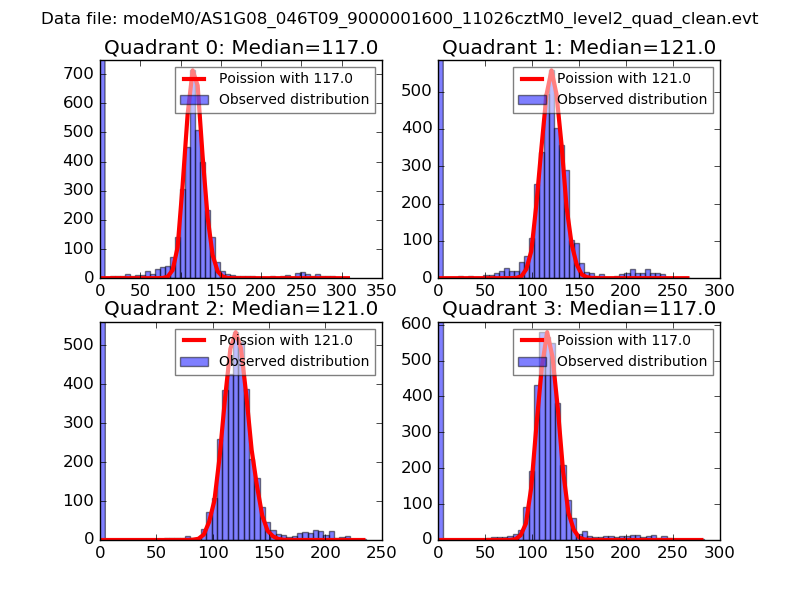 |
 |
| Quadrant-wise count rates Data is divided into 100 sec bins |
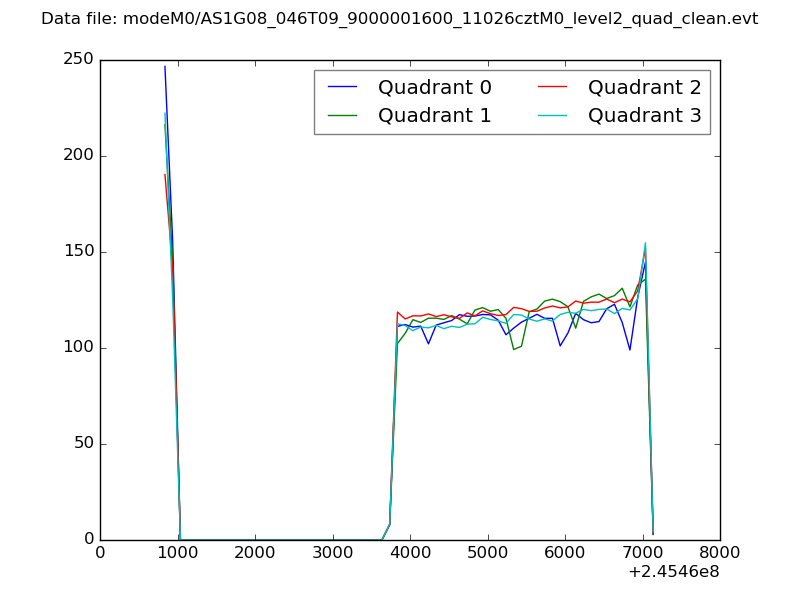 |
|
| Module-wise count rates for Quadrant A Data is divided into 100 sec bins |
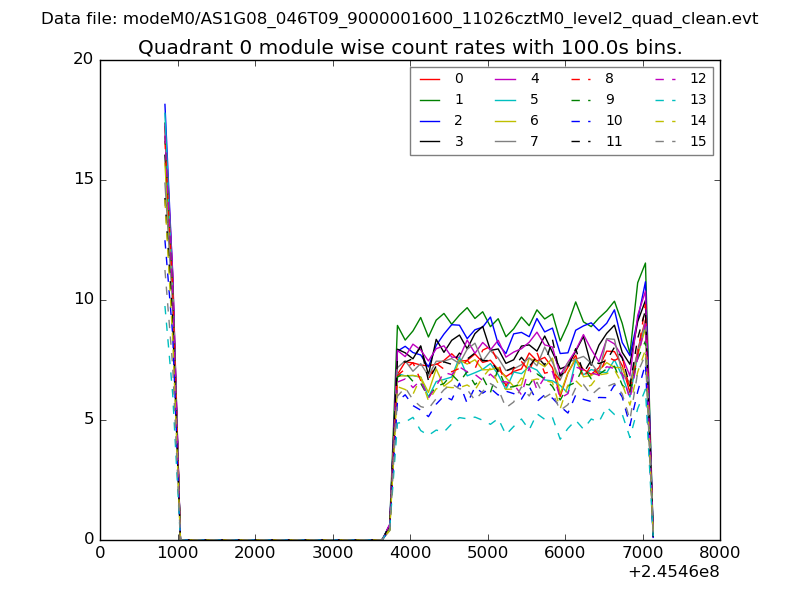 |
 |
| Module-wise count rates for Quadrant B Data is divided into 100 sec bins |
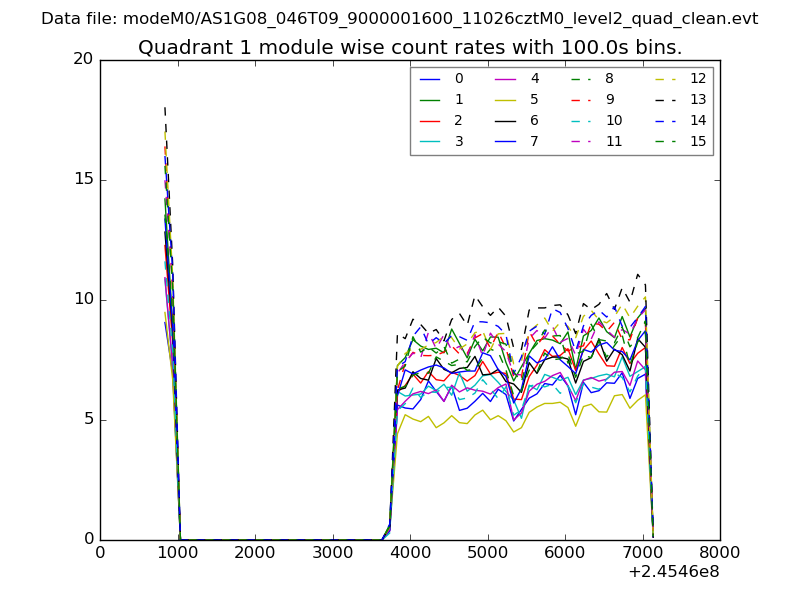 |
 |
| Module-wise count rates for Quadrant C Data is divided into 100 sec bins |
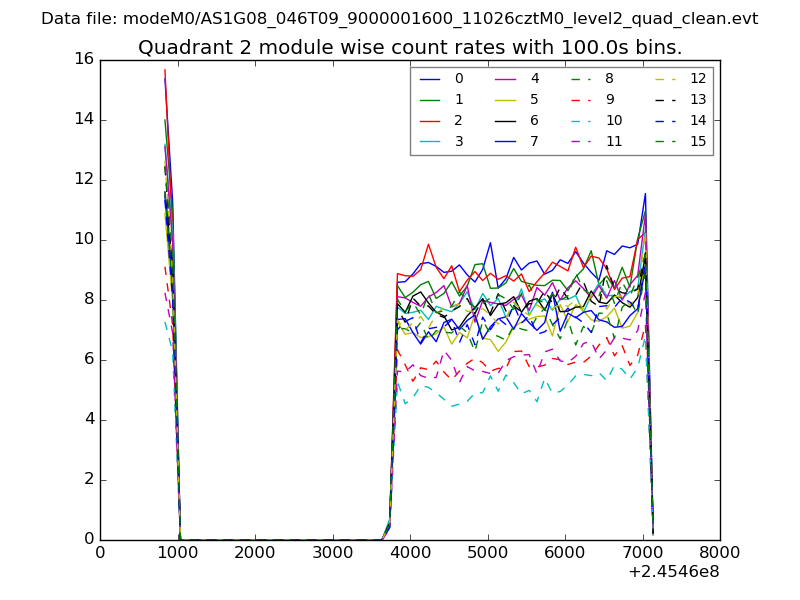 |
 |
| Module-wise count rates for Quadrant D Data is divided into 100 sec bins |
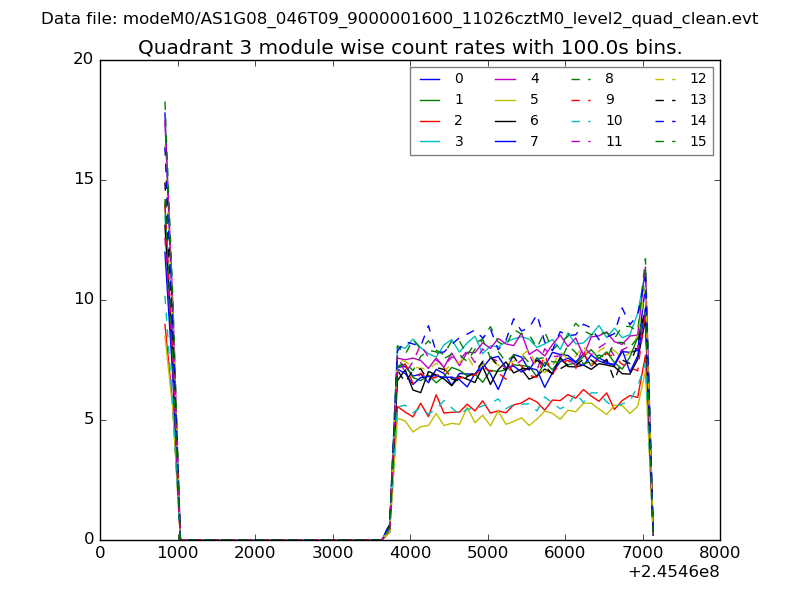 |
 |
| Parameter | Plot |
|---|---|
| CZT HV Monitor | 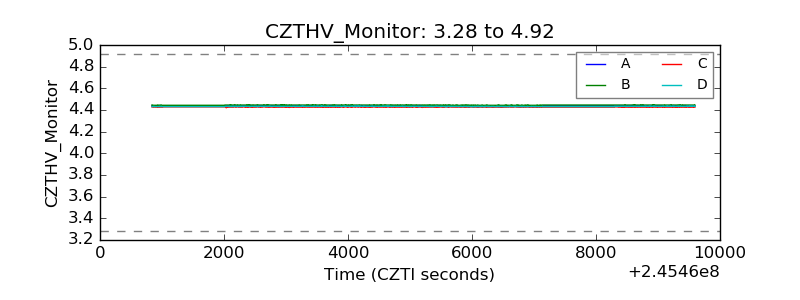 |
| D_VDD | 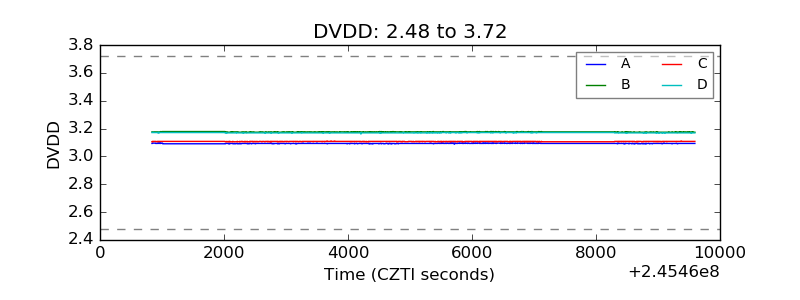 |
| Temperature 1 | 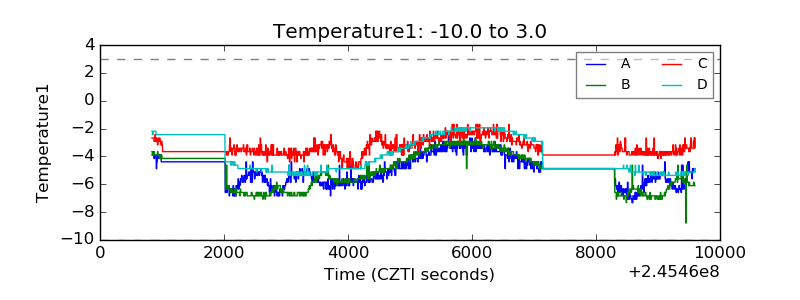 |
| Veto HV Monitor | 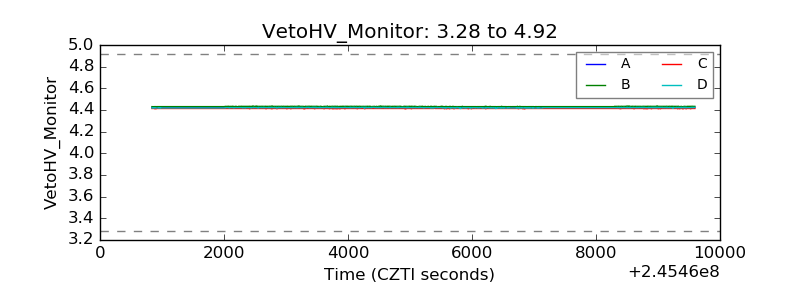 |
| Veto LLD |  |
| Alpha Counter | 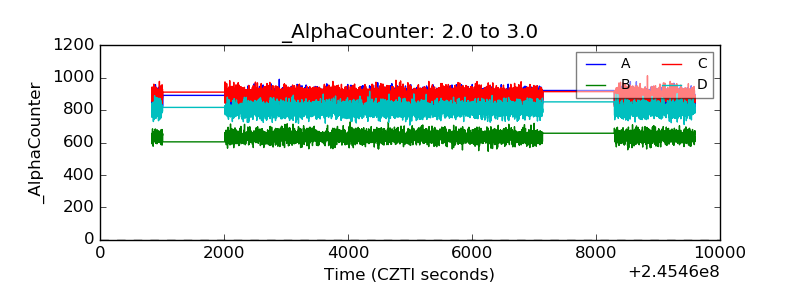 |
| _CPM_Rate | 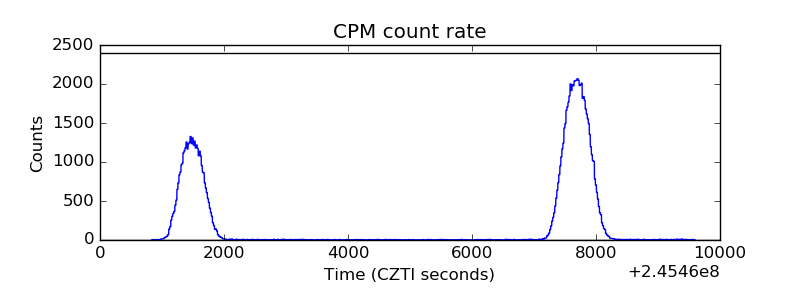 |
| CZT Counter | 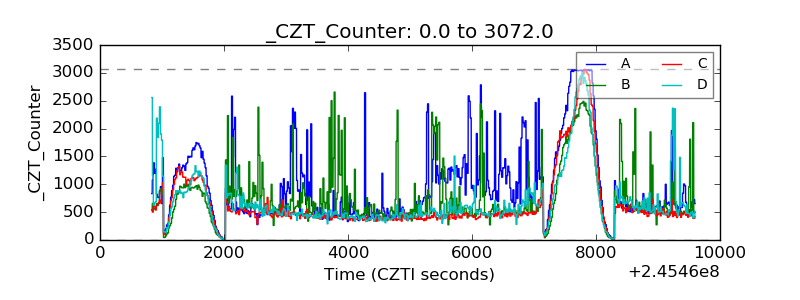 |
| +2.5 Volts monitor |  |
| +5 Volts monitor |  |
| _ROLL_ROT | 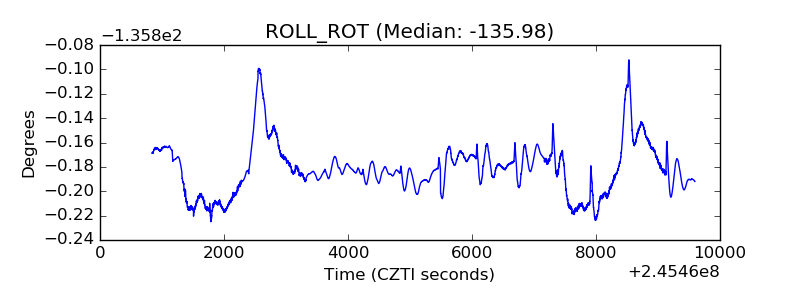 |
| _Roll_DEC | 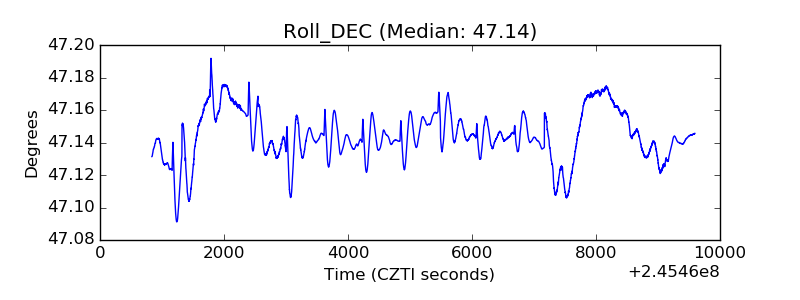 |
| _Roll_RA | 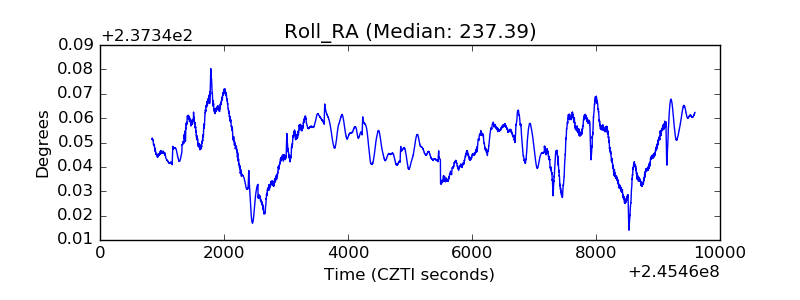 |
| Veto Counter | 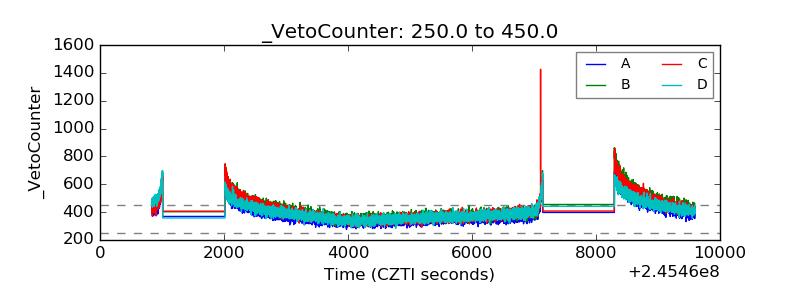 |