| Param | Original file | Final file |
|---|---|---|
| Filename | modeM0/AS1G08_046T09_9000001600_11027cztM0_level2.evt | modeM0/AS1G08_046T09_9000001600_11027cztM0_level2_quad_clean.evt |
| Size (bytes) | 568,434,240 | 76,821,120 |
| Size | 542.1 MB | 73.3 MB |
| Events in quadrant A | 5,273,778 | 463,438 |
| Events in quadrant B | 4,120,769 | 489,146 |
| Events in quadrant C | 3,152,161 | 484,878 |
| Events in quadrant D | 4,245,870 | 452,691 |
| Mode M0 | |||
|---|---|---|---|
| Quadrant | BADHDUFLAG | Total packets | Discarded packets |
| A | 0 | 19999 | 3 |
| B | 0 | 16318 | 2 |
| C | 0 | 13596 | 2 |
| D | 0 | 16767 | 2 |
| Mode M9 | |||
|---|---|---|---|
| Quadrant | BADHDUFLAG | Total packets | Discarded packets |
| A | 0 | 18 | 0 |
| B | 0 | 18 | 0 |
| C | 0 | 18 | 0 |
| D | 0 | 19 | 0 |
| Mode SS | |||
|---|---|---|---|
| Quadrant | BADHDUFLAG | Total packets | Discarded packets |
| A | 0 | 126 | 0 |
| B | 0 | 126 | 0 |
| C | 0 | 126 | 0 |
| D | 0 | 126 | 0 |
| Quadrant | Total seconds | Saturated seconds | Saturation percentage |
|---|---|---|---|
| A | 6246 | 253 | 4.050592% |
| B | 6246 | 349 | 5.587576% |
| C | 6246 | 100 | 1.601025% |
| D | 6246 | 227 | 3.634326% |
Noise dominated data is calculated using 1-second bins in cleaned event files. If a bin has >2000 counts, and if more than 50% of those come from <1% of pixels, then it is considered to be noise-dominated and hence unusable.
| Quadrant | # 1 sec bins | Bins with >0 counts | Bins with >2000 counts | High rate bins dominated by noise | Noise dominated (total time) | Noise dominated (detector-on time) | Marked lightcurve |
|---|---|---|---|---|---|---|---|
| A | 7486 | 6246 | 194 | 194 | 2.59% | 3.11% | 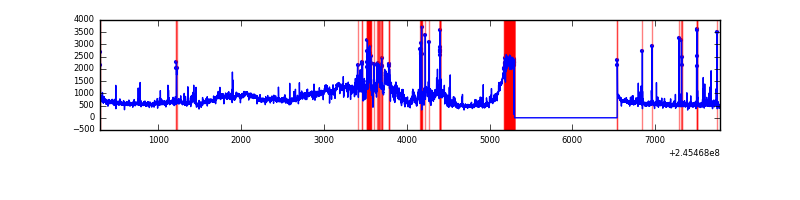 |
| B | 7486 | 6246 | 211 | 211 | 2.82% | 3.38% |  |
| C | 7486 | 6246 | 49 | 49 | 0.65% | 0.78% |  |
| D | 7486 | 6246 | 199 | 199 | 2.66% | 3.19% | 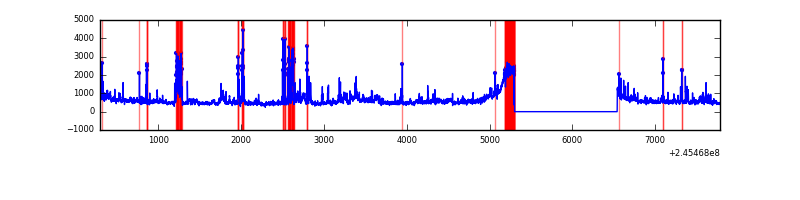 |
Top three noisy pixels from each quadrant. If the there are fewer than three noisy pixels in the level2.evt file, extra rows are filled as -1
| Pixel properties | Quadrant properties | ||||||
|---|---|---|---|---|---|---|---|
| Quadrant | DetID | PixID | Counts | Sigma | Mean | Median | Sigma |
| A | 15 | 174 | 1546419 | 8893.73 | 846 | 832 | 173.8 |
| A | 8 | 5 | 446945 | 2567.05 | 846 | 832 | 173.8 |
| A | 0 | 12 | 13519 | 73.0 | 846 | 832 | 173.8 |
| B | 4 | 239 | 836978 | 5320.22 | 823 | 808 | 157.2 |
| B | 4 | 81 | 28912 | 178.81 | 823 | 808 | 157.2 |
| B | 0 | 214 | 20989 | 128.4 | 823 | 808 | 157.2 |
| C | 12 | 4 | 15302 | 77.91 | 802 | 811 | 186.0 |
| C | 14 | 234 | 8708 | 42.46 | 802 | 811 | 186.0 |
| C | 13 | 61 | 5577 | 25.62 | 802 | 811 | 186.0 |
| D | 11 | 129 | 350890 | 1773.58 | 814 | 796 | 197.4 |
| D | 8 | 195 | 240587 | 1214.78 | 814 | 796 | 197.4 |
| D | 2 | 14 | 198024 | 999.16 | 814 | 796 | 197.4 |
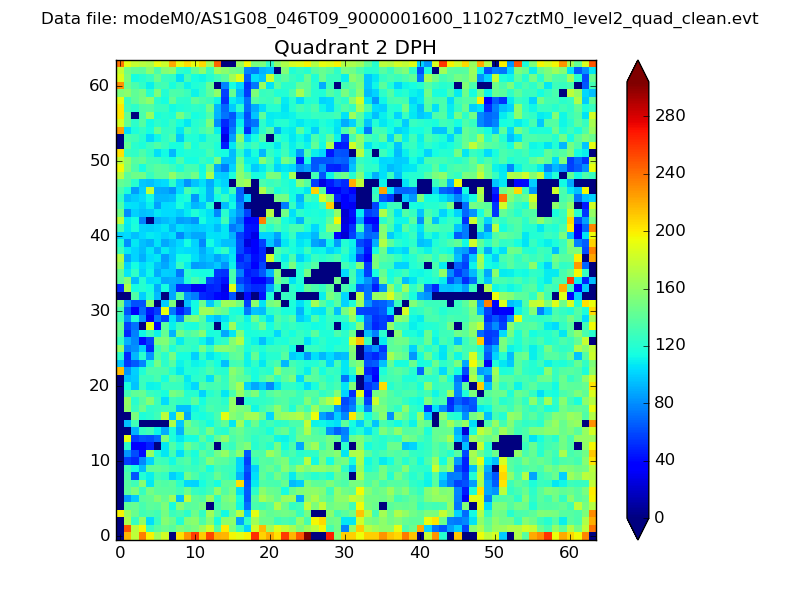
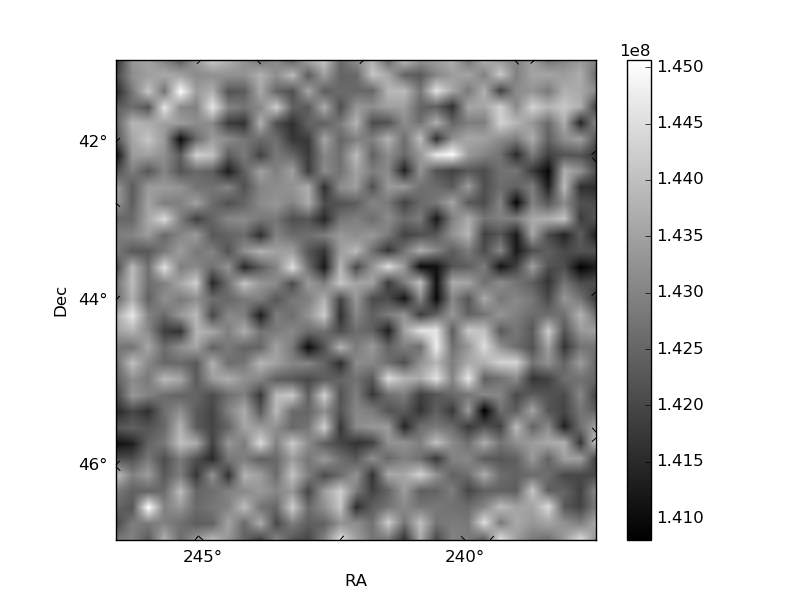
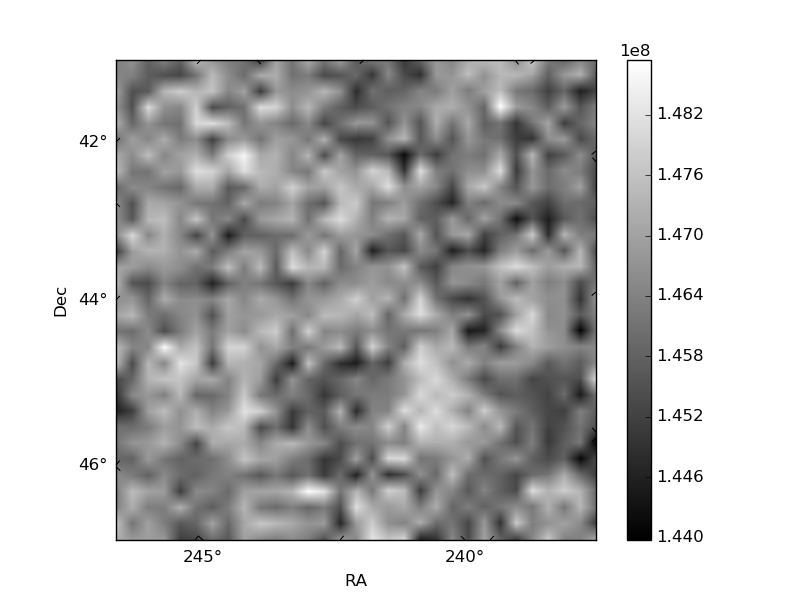
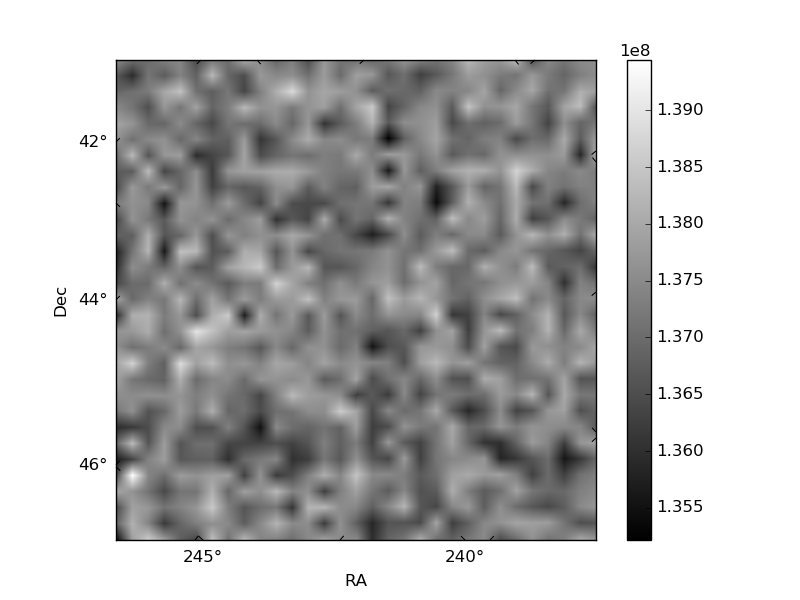
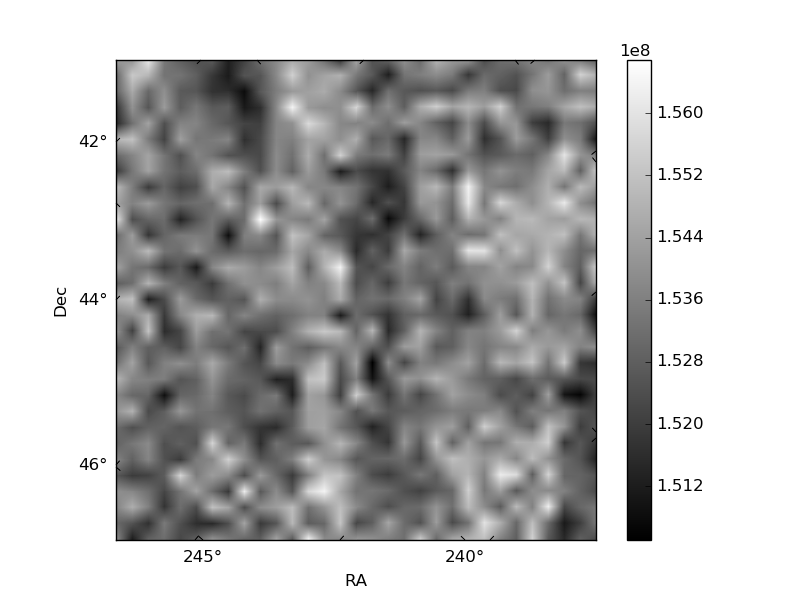
Histogram calculated using DETX and DETY for each event in the final _common_clean file
| Quadrant A | 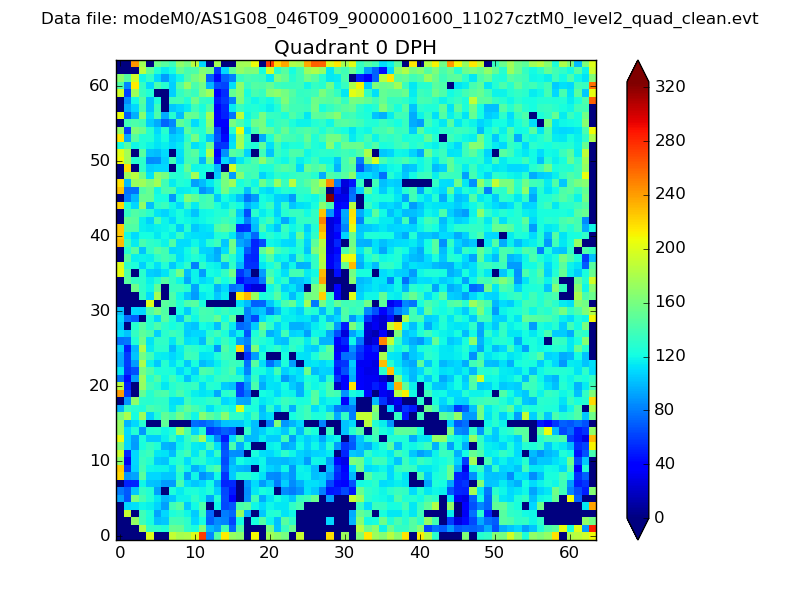 |
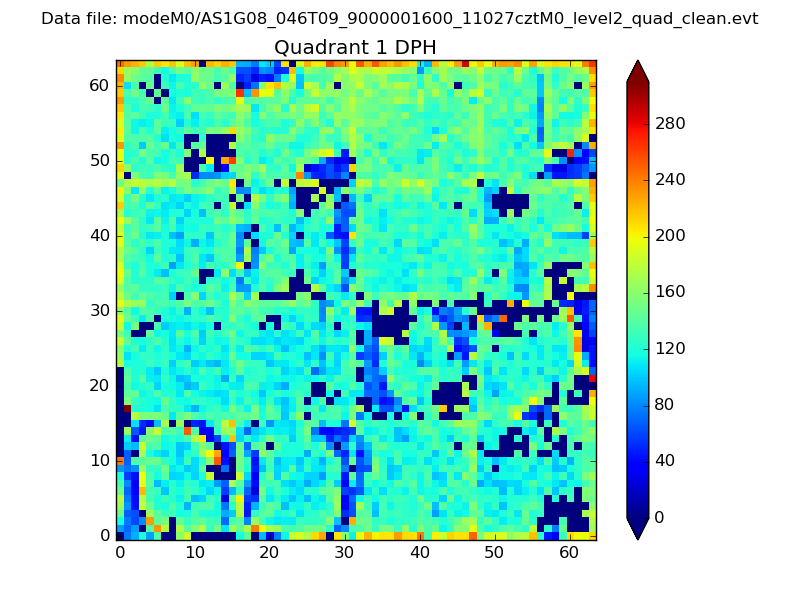 |
Quadrant B |
|---|---|---|---|
| Quadrant D | 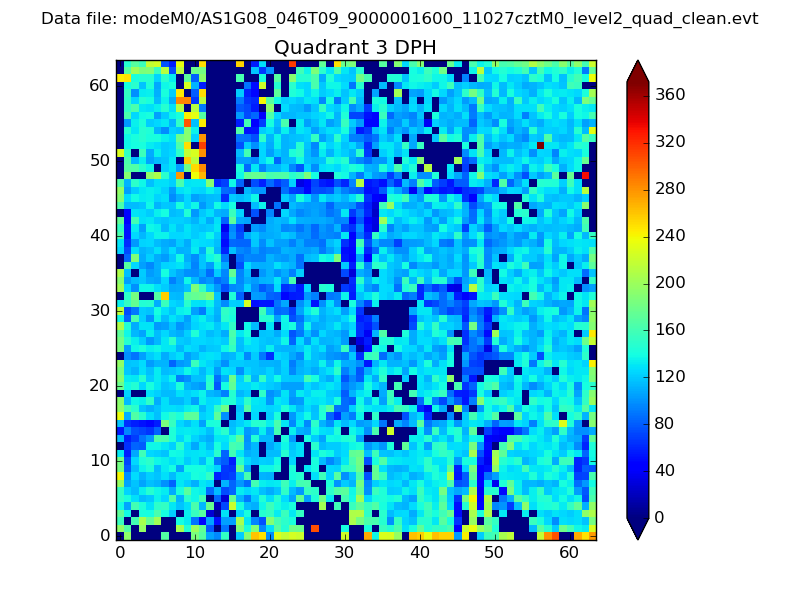 |
 |
Quadrant C |
| Plot type | Count rate plots | Images |
|---|---|---|
| Comparison with Poisson distribution Blue bars denote a histogram of data divided into 1 sec bins. Red curve is a Poisson curve with rate = median count rate of data. |
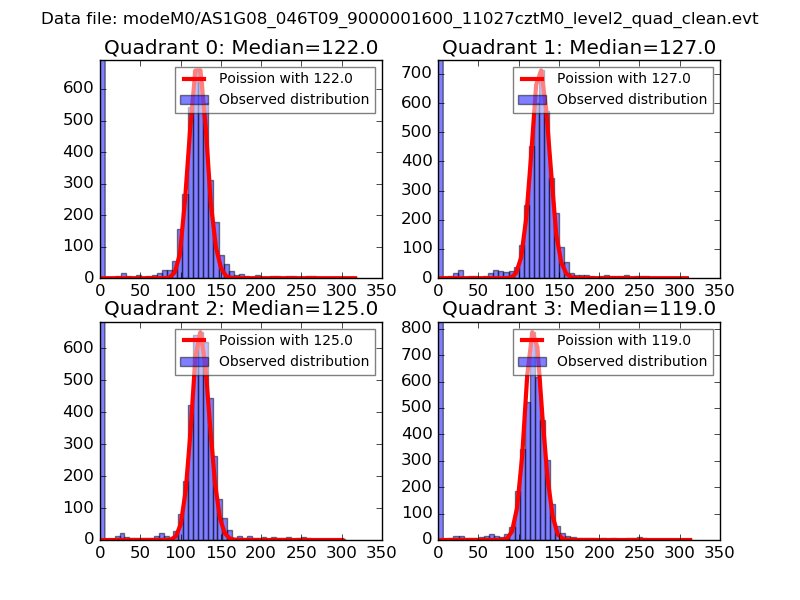 |
 |
| Quadrant-wise count rates Data is divided into 100 sec bins |
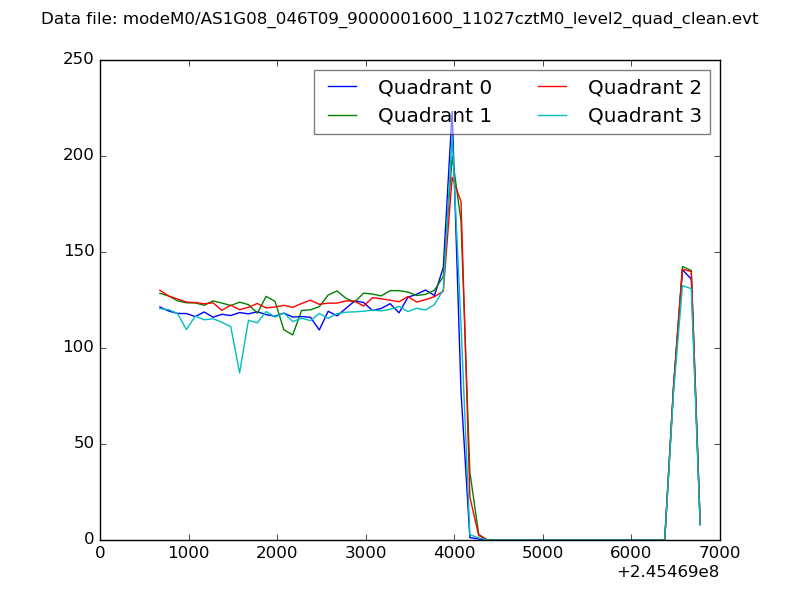 |
|
| Module-wise count rates for Quadrant A Data is divided into 100 sec bins |
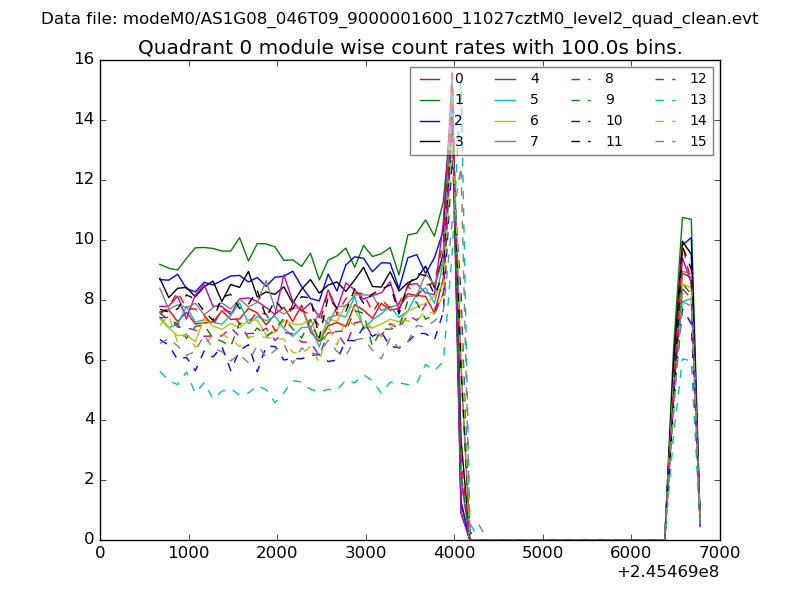 |
 |
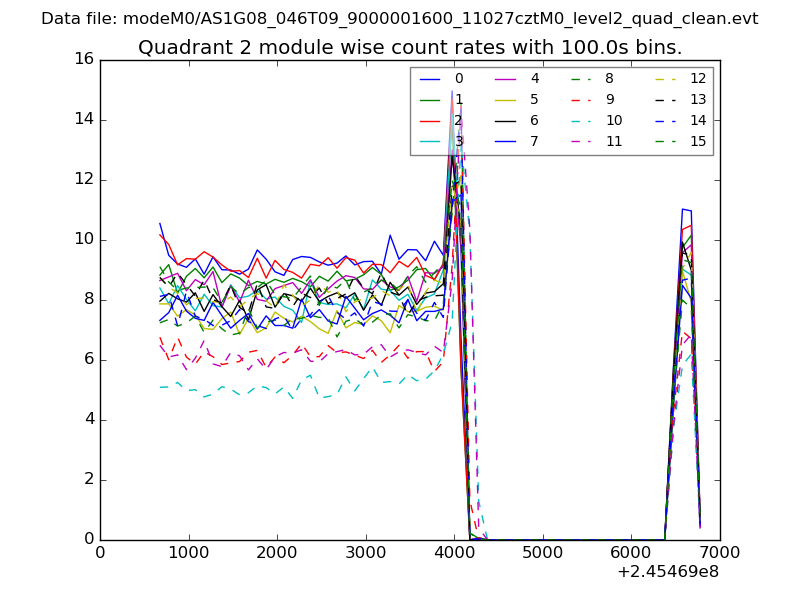
| Module-wise count rates for Quadrant B Data is divided into 100 sec bins |
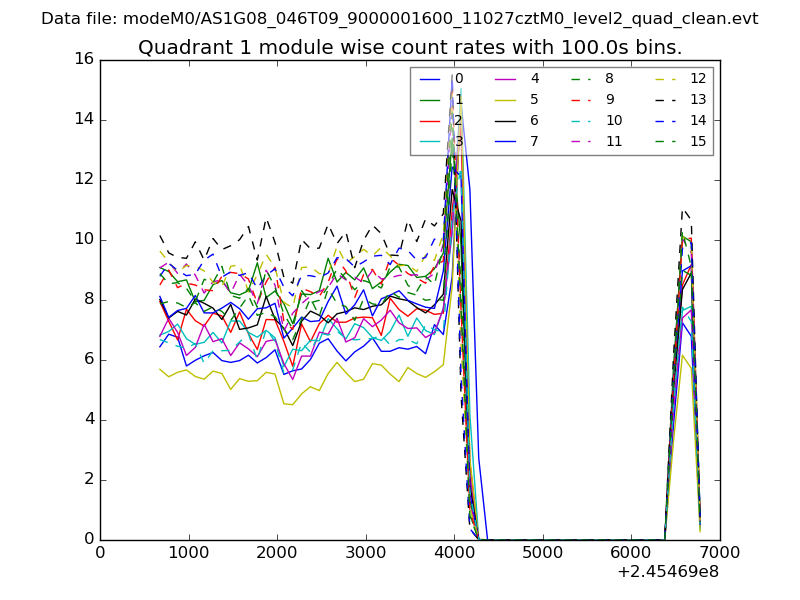 |
 |
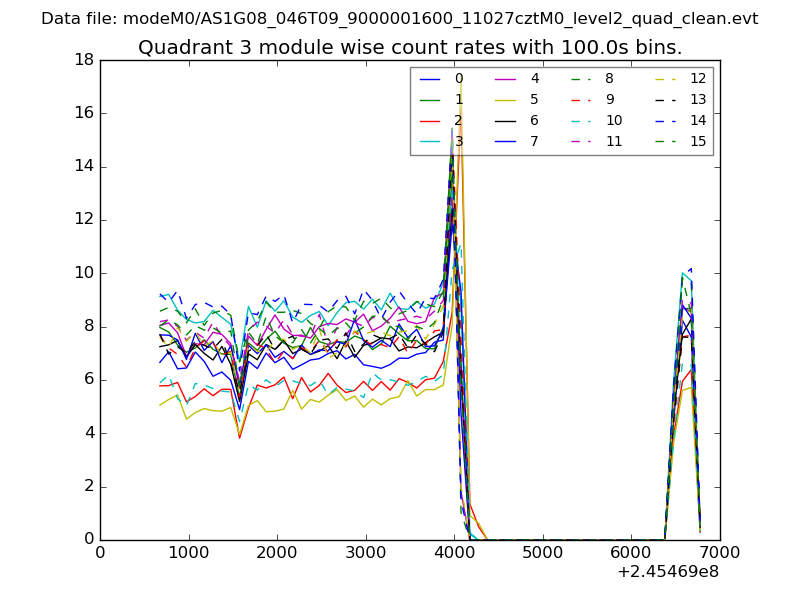
| Module-wise count rates for Quadrant C Data is divided into 100 sec bins |
 |
 |
| Module-wise count rates for Quadrant D Data is divided into 100 sec bins |
 |
 |
| Parameter | Plot |
|---|---|
| CZT HV Monitor | 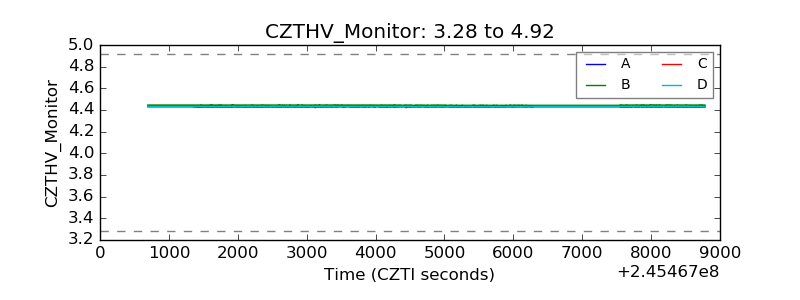 |
| D_VDD | 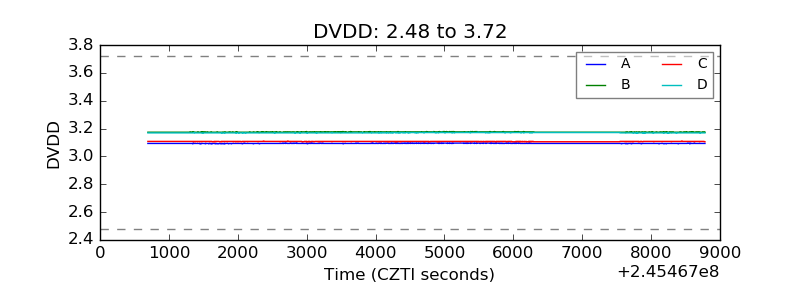 |
| Temperature 1 | 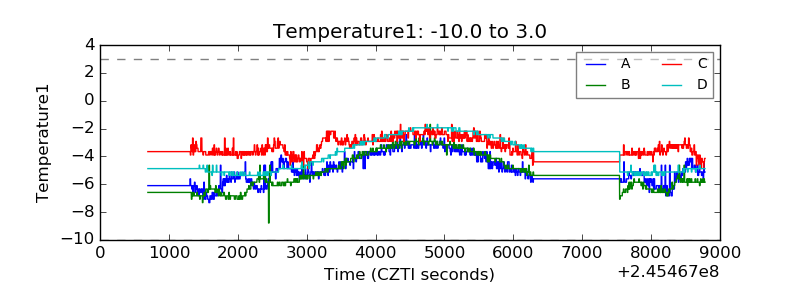 |
| Veto HV Monitor | 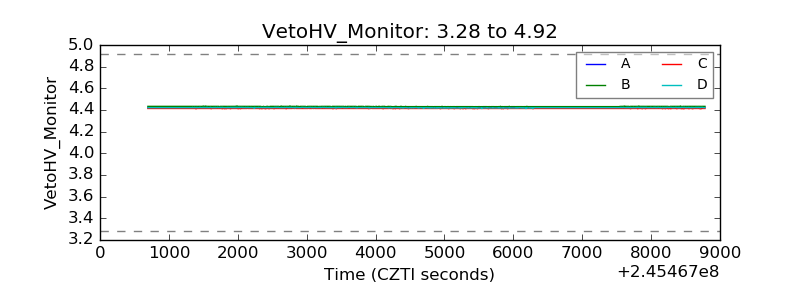 |
| Veto LLD |  |
| Alpha Counter | 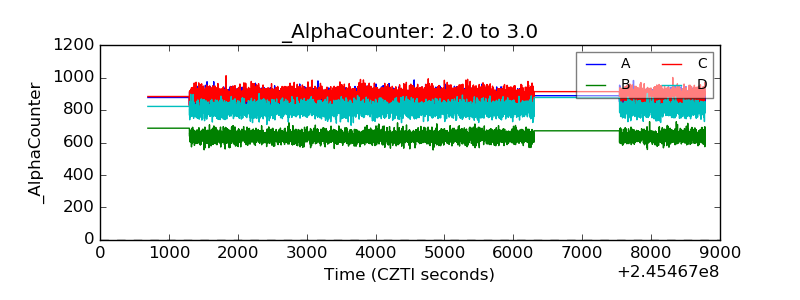 |
| _CPM_Rate | 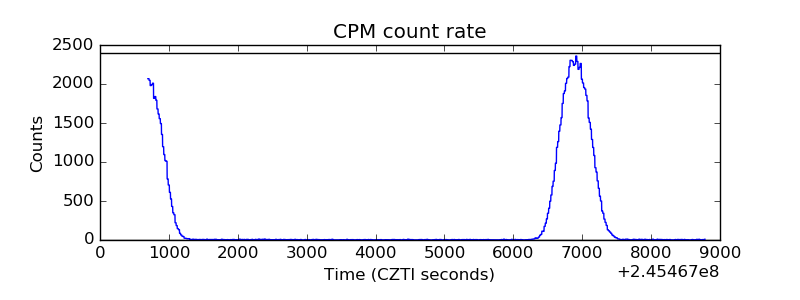 |
| CZT Counter | 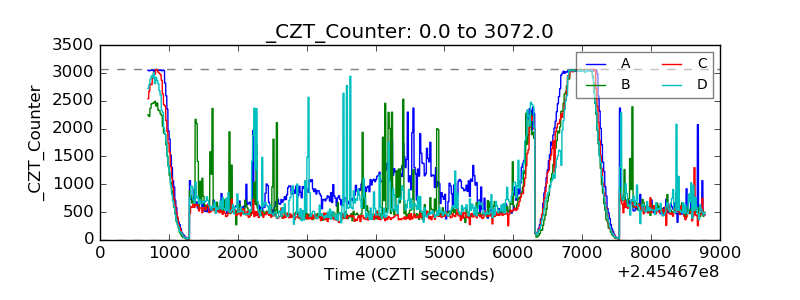 |
| +2.5 Volts monitor |  |
| +5 Volts monitor |  |
| _ROLL_ROT | 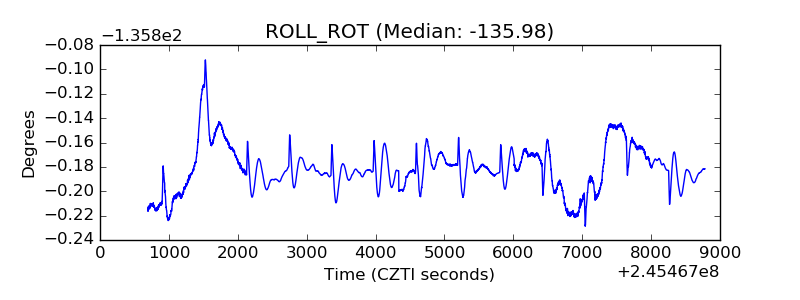 |
| _Roll_DEC | 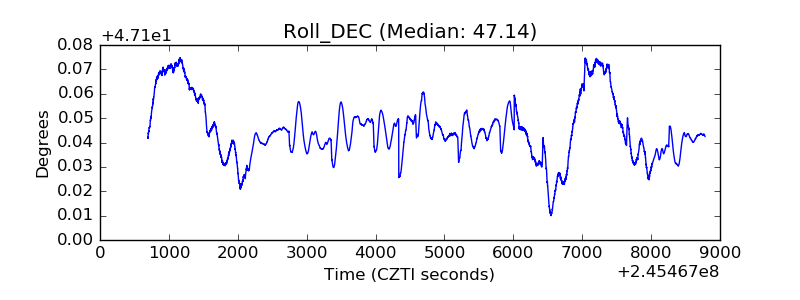 |
| _Roll_RA | 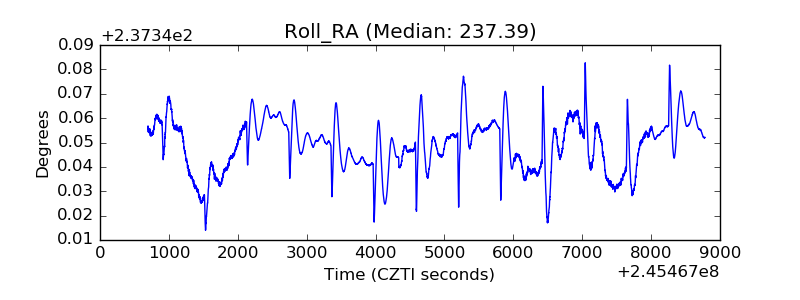 |
| Veto Counter | 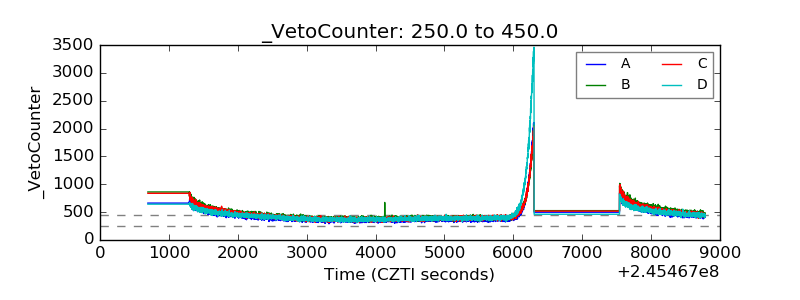 |