| Param | Original file | Final file |
|---|---|---|
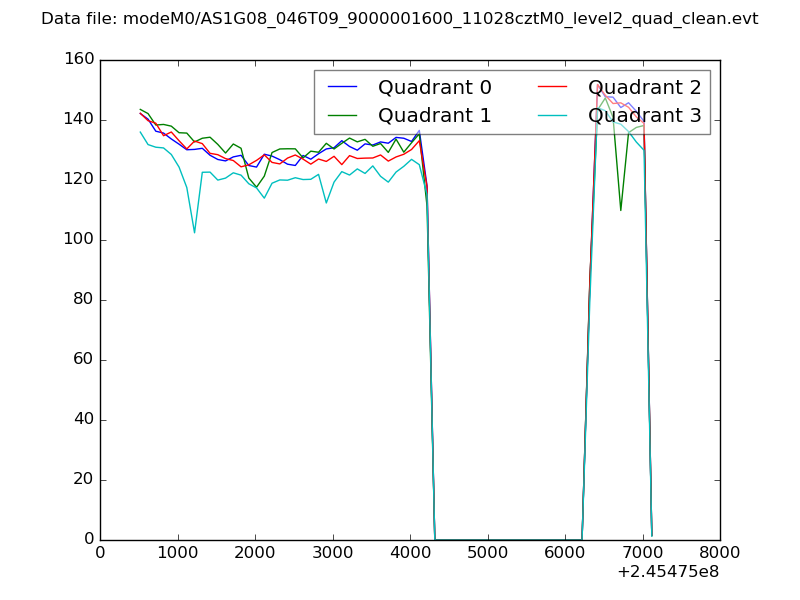
| Filename | modeM0/AS1G08_046T09_9000001600_11028cztM0_level2.evt | modeM0/AS1G08_046T09_9000001600_11028cztM0_level2_quad_clean.evt |
| Size (bytes) | 510,289,920 | 92,917,440 |
| Size | 486.7 MB | 88.6 MB |
| Events in quadrant A | 3,771,919 | 605,994 |
| Events in quadrant B | 4,406,630 | 603,234 |
| Events in quadrant C | 3,019,545 | 600,523 |
| Events in quadrant D | 3,831,339 | 567,003 |
| Mode M0 | |||
|---|---|---|---|
| Quadrant | BADHDUFLAG | Total packets | Discarded packets |
| A | 0 | 15129 | 3 |
| B | 0 | 17201 | 2 |
| C | 0 | 13103 | 2 |
| D | 0 | 15435 | 2 |
| Mode M9 | |||
|---|---|---|---|
| Quadrant | BADHDUFLAG | Total packets | Discarded packets |
| A | 0 | 15 | 0 |
| B | 0 | 15 | 0 |
| C | 0 | 15 | 0 |
| D | 0 | 16 | 0 |
| Mode SS | |||
|---|---|---|---|
| Quadrant | BADHDUFLAG | Total packets | Discarded packets |
| A | 0 | 128 | 0 |
| B | 0 | 128 | 0 |
| C | 0 | 128 | 0 |
| D | 0 | 128 | 0 |
| Quadrant | Total seconds | Saturated seconds | Saturation percentage |
|---|---|---|---|
| A | 6260 | 75 | 1.198083% |
| B | 6260 | 370 | 5.910543% |
| C | 6260 | 32 | 0.511182% |
| D | 6260 | 131 | 2.092652% |
Noise dominated data is calculated using 1-second bins in cleaned event files. If a bin has >2000 counts, and if more than 50% of those come from <1% of pixels, then it is considered to be noise-dominated and hence unusable.
| Quadrant | # 1 sec bins | Bins with >0 counts | Bins with >2000 counts | High rate bins dominated by noise | Noise dominated (total time) | Noise dominated (detector-on time) | Marked lightcurve |
|---|---|---|---|---|---|---|---|
| A | 7580 | 6261 | 28 | 28 | 0.37% | 0.45% | 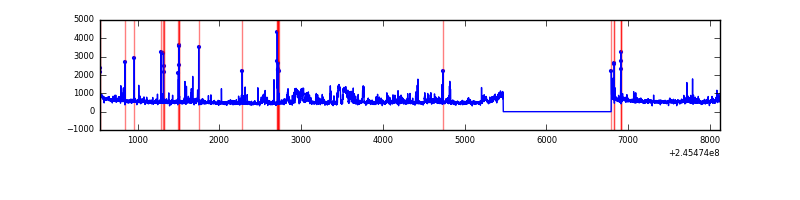 |
| B | 7580 | 6260 | 209 | 209 | 2.76% | 3.34% | 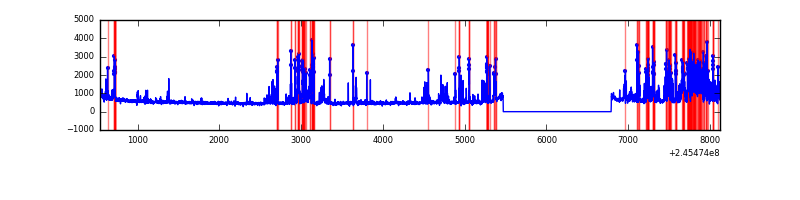 |
| C | 7580 | 6261 | 2 | 2 | 0.03% | 0.03% |  |
| D | 7580 | 6261 | 103 | 103 | 1.36% | 1.65% | 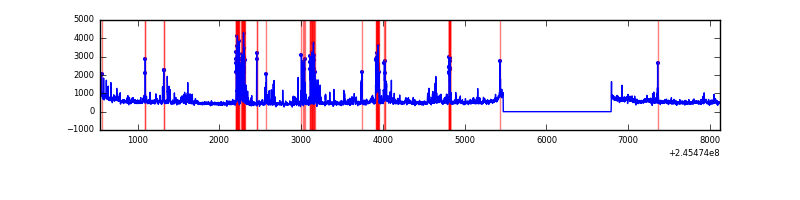 |
Top three noisy pixels from each quadrant. If the there are fewer than three noisy pixels in the level2.evt file, extra rows are filled as -1
| Pixel properties | Quadrant properties | ||||||
|---|---|---|---|---|---|---|---|
| Quadrant | DetID | PixID | Counts | Sigma | Mean | Median | Sigma |
| A | 8 | 5 | 347705 | 2172.63 | 804 | 789 | 159.7 |
| A | 15 | 174 | 310072 | 1936.95 | 804 | 789 | 159.7 |
| A | 0 | 12 | 12580 | 73.84 | 804 | 789 | 159.7 |
| B | 4 | 239 | 1177344 | 7971.99 | 792 | 776 | 147.6 |
| B | 4 | 81 | 75291 | 504.89 | 792 | 776 | 147.6 |
| B | 0 | 214 | 30208 | 199.42 | 792 | 776 | 147.6 |
| C | 12 | 4 | 15220 | 82.52 | 768 | 772 | 175.1 |
| C | 13 | 61 | 5640 | 27.8 | 768 | 772 | 175.1 |
| C | 5 | 207 | 4117 | 19.1 | 768 | 772 | 175.1 |
| D | 11 | 129 | 207613 | 1140.83 | 762 | 743 | 181.3 |
| D | 14 | 34 | 169853 | 932.59 | 762 | 743 | 181.3 |
| D | 10 | 253 | 145179 | 796.52 | 762 | 743 | 181.3 |
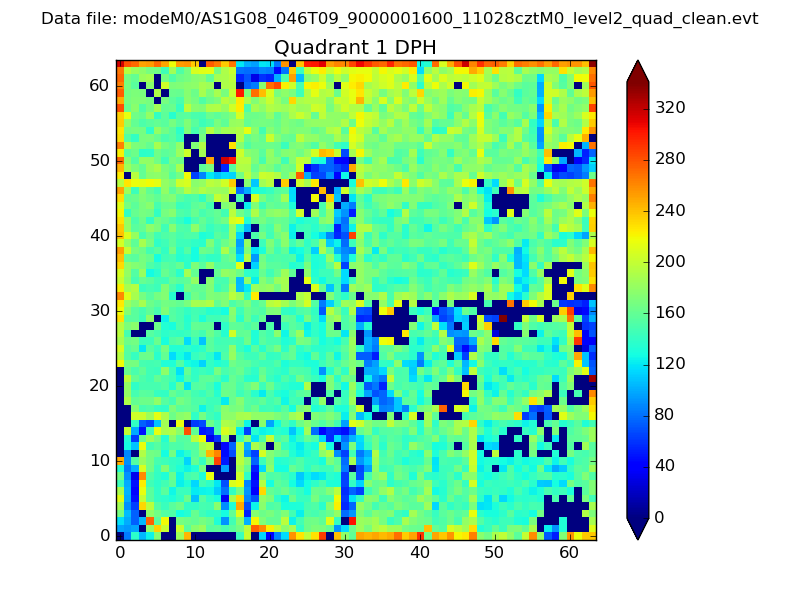
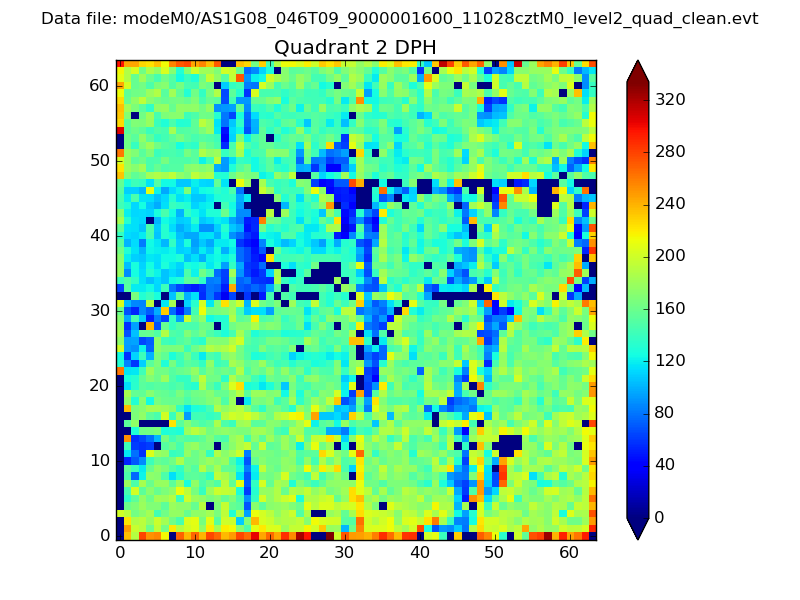
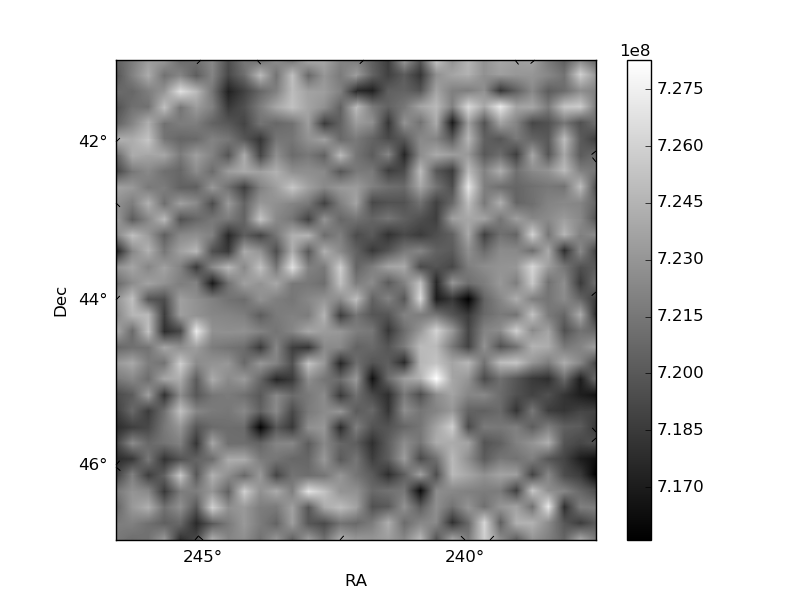
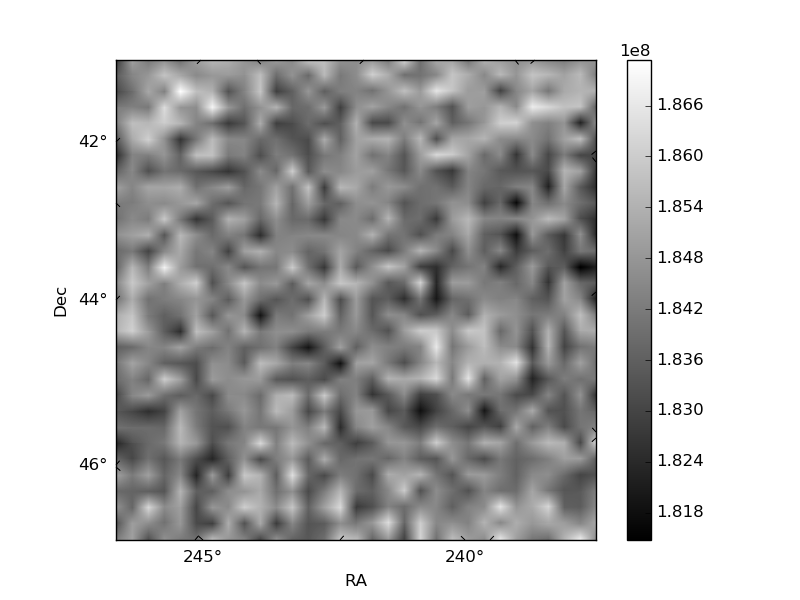
Histogram calculated using DETX and DETY for each event in the final _common_clean file
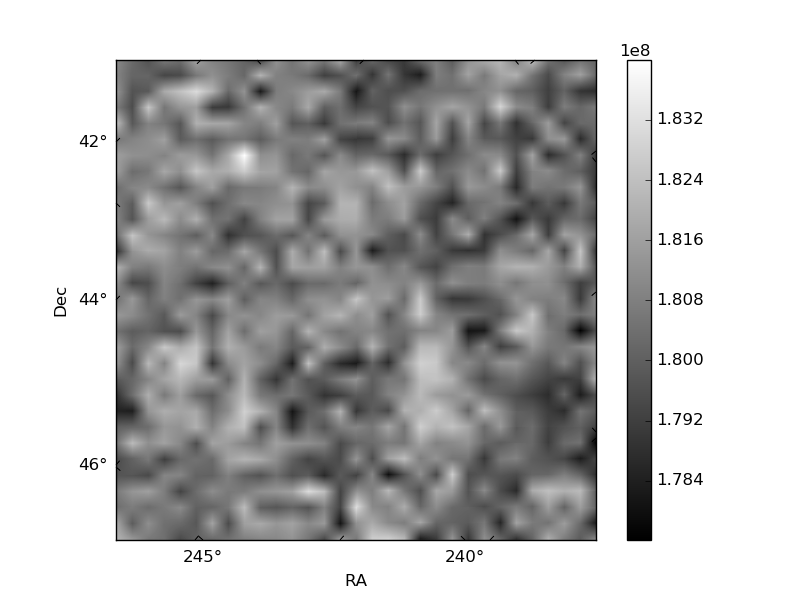
| Quadrant A | 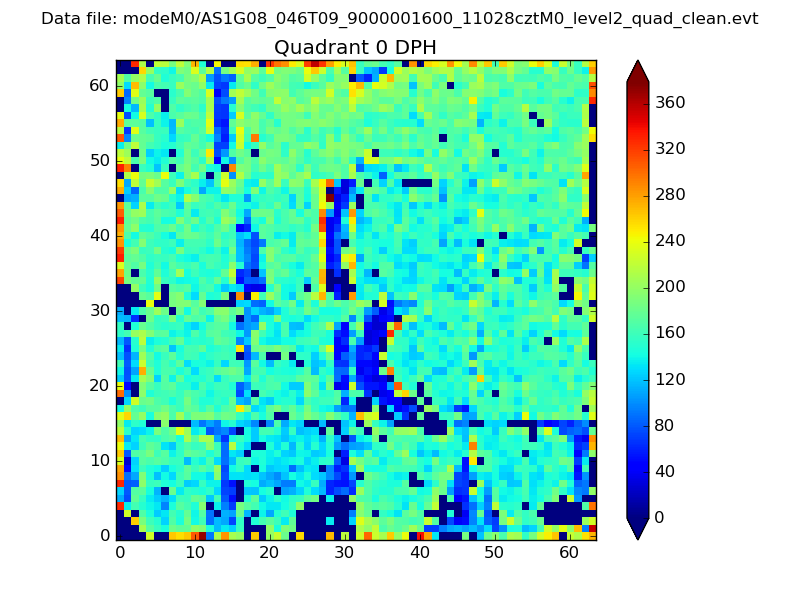 |
 |
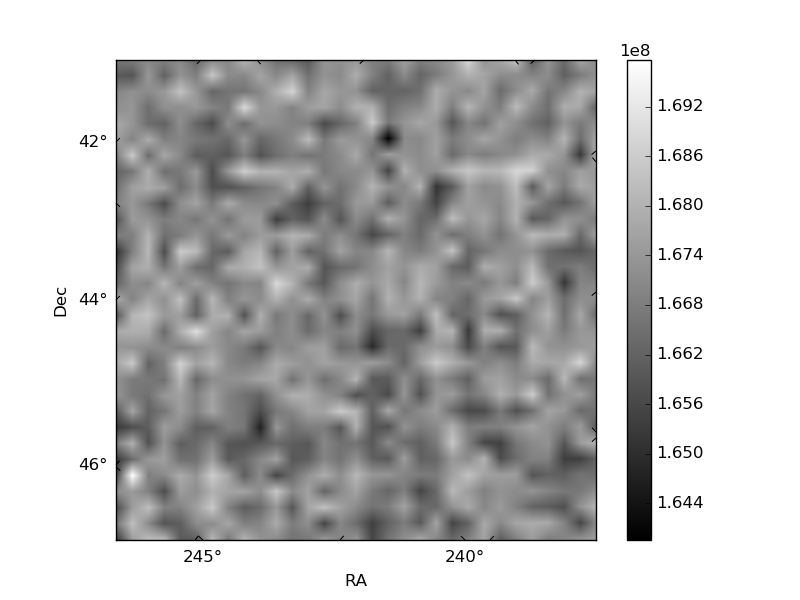
Quadrant B |
|---|---|---|---|
| Quadrant D | 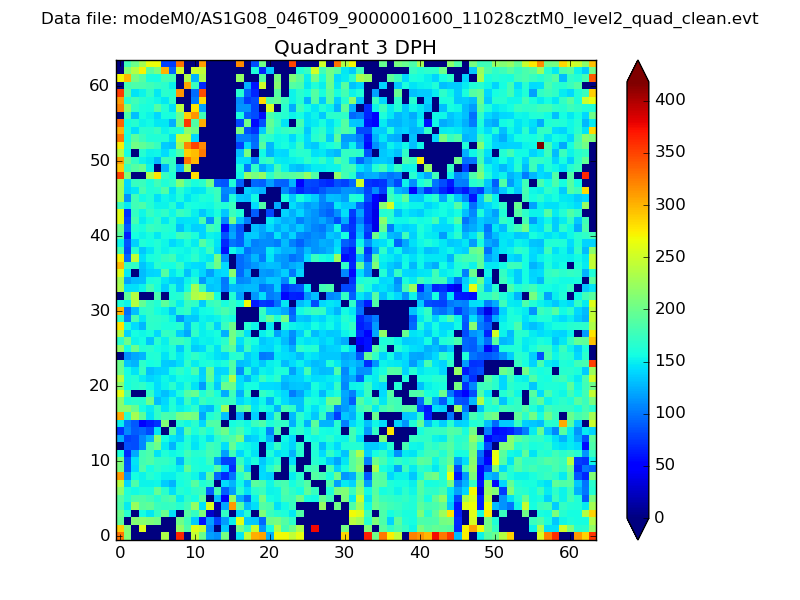 |
 |
Quadrant C |
| Plot type | Count rate plots | Images |
|---|---|---|
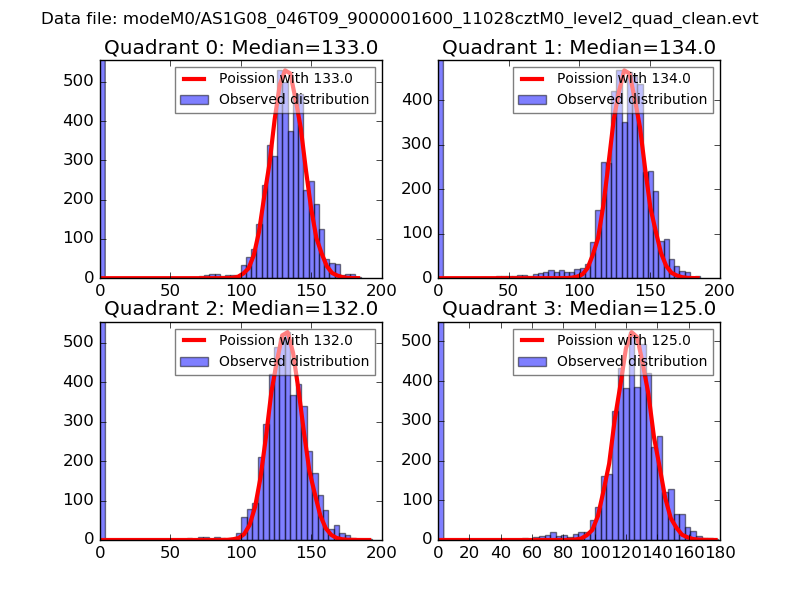
| Comparison with Poisson distribution Blue bars denote a histogram of data divided into 1 sec bins. Red curve is a Poisson curve with rate = median count rate of data. |
 |
 |
| Quadrant-wise count rates Data is divided into 100 sec bins |
 |
|
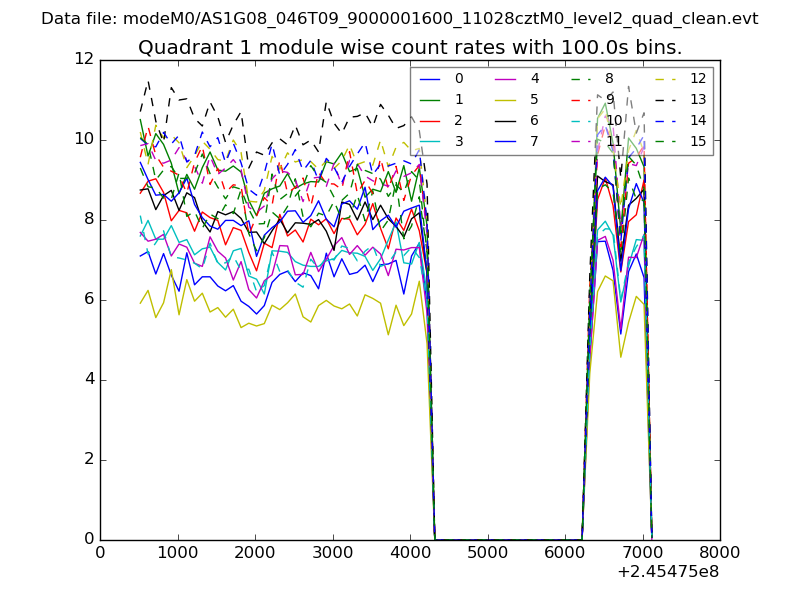
| Module-wise count rates for Quadrant A Data is divided into 100 sec bins |
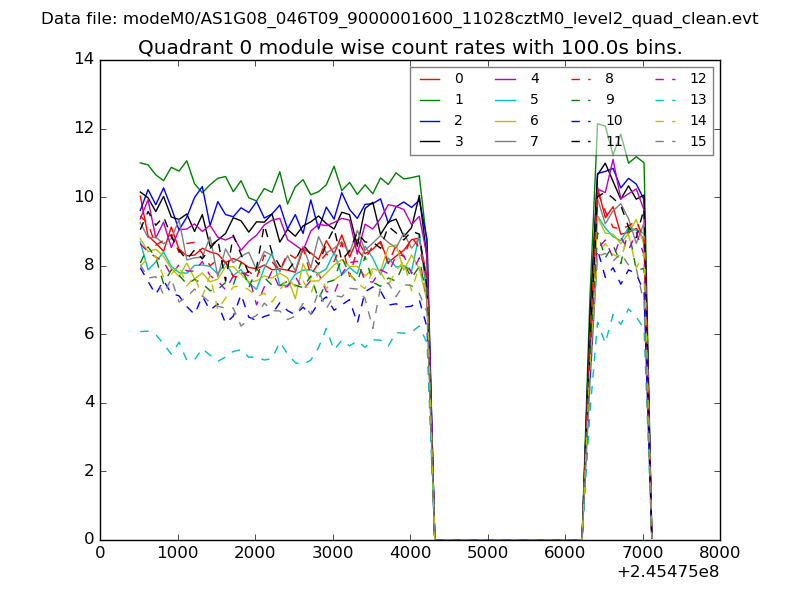 |
 |
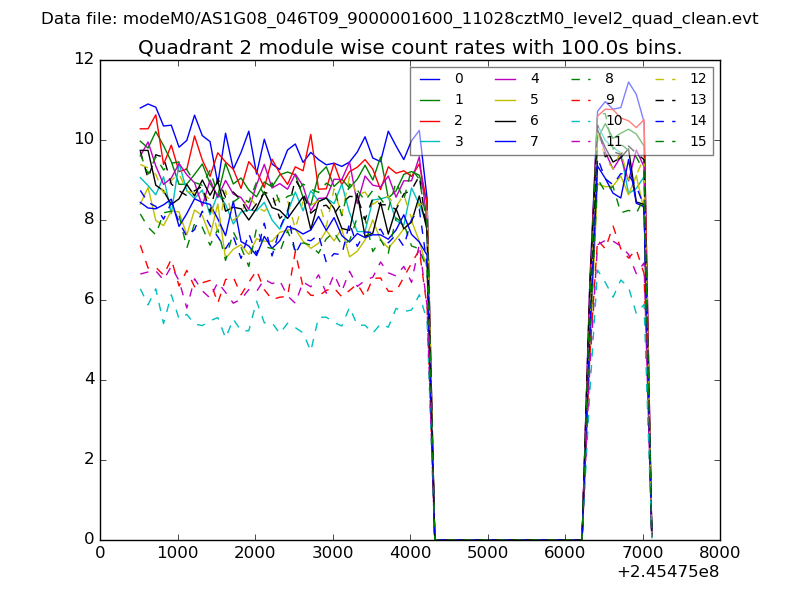
| Module-wise count rates for Quadrant B Data is divided into 100 sec bins |
 |
 |
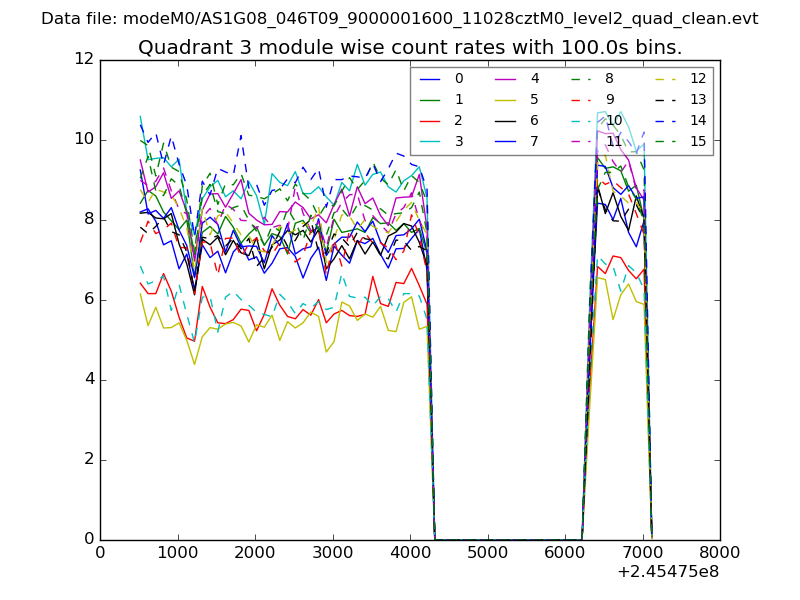
| Module-wise count rates for Quadrant C Data is divided into 100 sec bins |
 |
 |
| Module-wise count rates for Quadrant D Data is divided into 100 sec bins |
 |
 |
| Parameter | Plot |
|---|---|
| CZT HV Monitor | 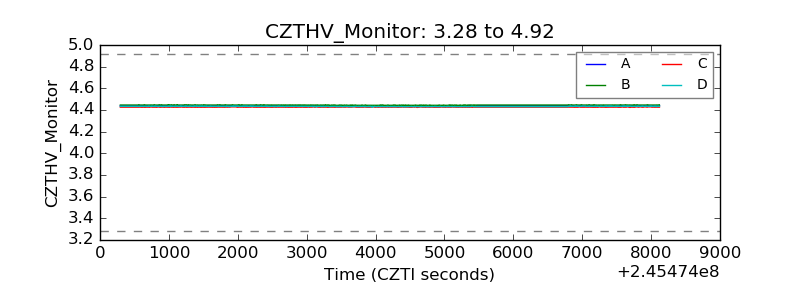 |
| D_VDD | 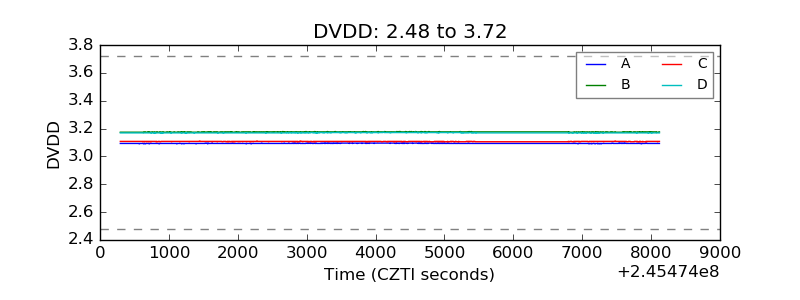 |
| Temperature 1 | 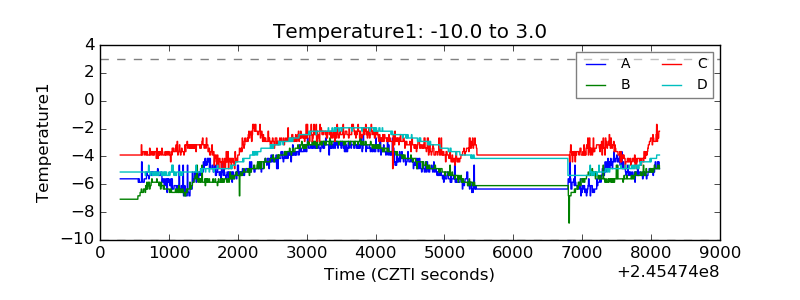 |
| Veto HV Monitor | 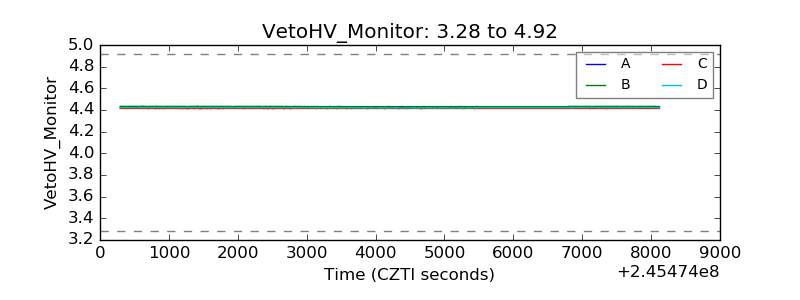 |
| Veto LLD | 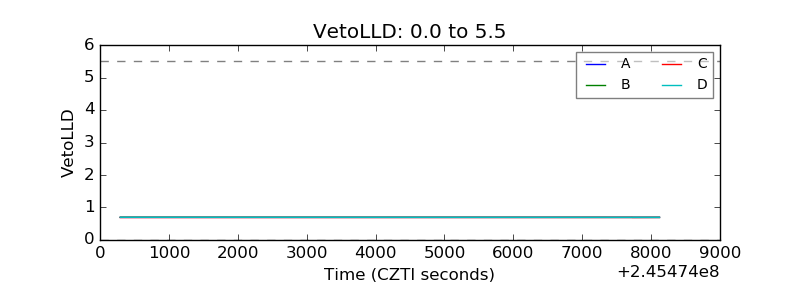 |
| Alpha Counter | 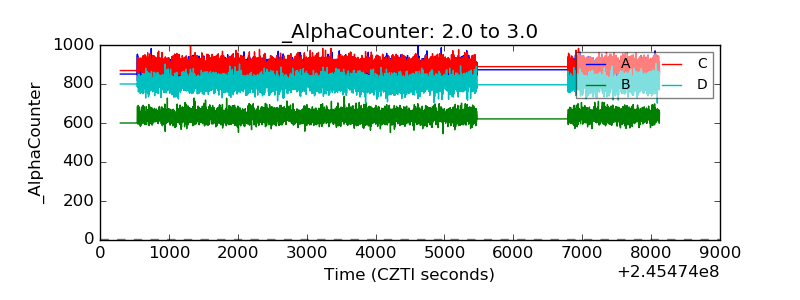 |
| _CPM_Rate | 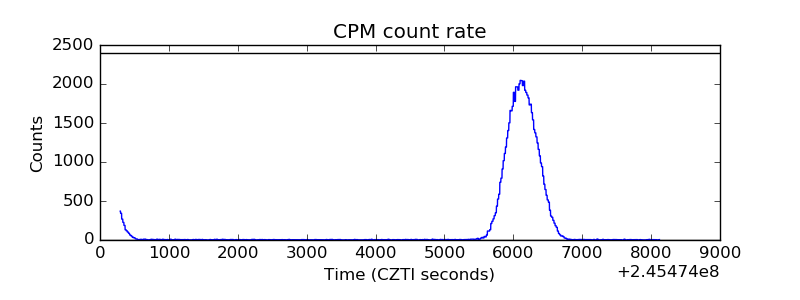 |
| CZT Counter | 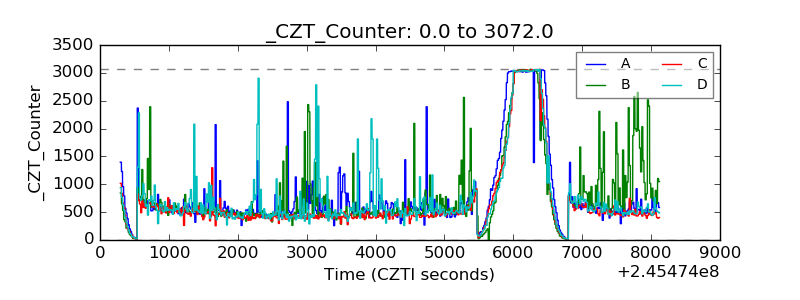 |
| +2.5 Volts monitor |  |
| +5 Volts monitor |  |
| _ROLL_ROT |  |
| _Roll_DEC | 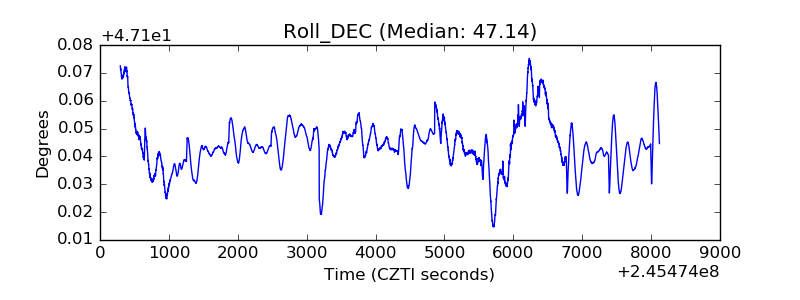 |
| _Roll_RA | 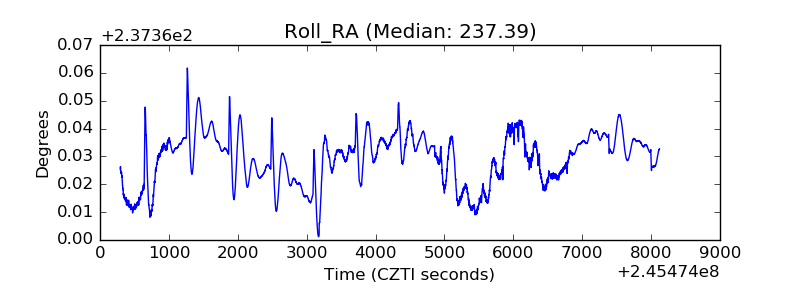 |
| Veto Counter | 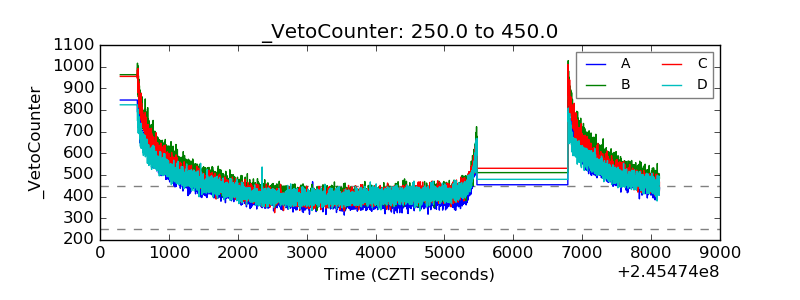 |