| Param | Original file | Final file |
|---|---|---|
| Filename | modeM0/AS1A04_113T01_9000001604_11033cztM0_level2.evt | modeM0/AS1A04_113T01_9000001604_11033cztM0_level2_quad_clean.evt |
| Size (bytes) | 365,028,480 | 40,383,360 |
| Size | 348.1 MB | 38.5 MB |
| Events in quadrant A | 3,723,803 | 226,852 |
| Events in quadrant B | 2,698,650 | 239,186 |
| Events in quadrant C | 1,978,080 | 239,901 |
| Events in quadrant D | 2,377,662 | 229,844 |
| Mode M9 | |||
|---|---|---|---|
| Quadrant | BADHDUFLAG | Total packets | Discarded packets |
| A | 0 | 1 | 0 |
| B | 0 | 1 | 0 |
| C | 0 | 1 | 0 |
| D | 0 | 1 | 0 |
| Mode M0 | |||
|---|---|---|---|
| Quadrant | BADHDUFLAG | Total packets | Discarded packets |
| A | 0 | 14066 | 30 |
| B | 0 | 10689 | 3 |
| C | 0 | 8633 | 15 |
| D | 0 | 9720 | 9 |
| Mode SS | |||
|---|---|---|---|
| Quadrant | BADHDUFLAG | Total packets | Discarded packets |
| A | 0 | 82 | 0 |
| B | 0 | 82 | 0 |
| C | 0 | 82 | 0 |
| D | 0 | 82 | 0 |
| Quadrant | Total seconds | Saturated seconds | Saturation percentage |
|---|---|---|---|
| A | 4063 | 473 | 11.641644% |
| B | 4069 | 359 | 8.822807% |
| C | 4064 | 71 | 1.747047% |
| D | 4066 | 87 | 2.139695% |
Noise dominated data is calculated using 1-second bins in cleaned event files. If a bin has >2000 counts, and if more than 50% of those come from <1% of pixels, then it is considered to be noise-dominated and hence unusable.
| Quadrant | # 1 sec bins | Bins with >0 counts | Bins with >2000 counts | High rate bins dominated by noise | Noise dominated (total time) | Noise dominated (detector-on time) | Marked lightcurve |
|---|---|---|---|---|---|---|---|
| A | 4140 | 4070 | 175 | 175 | 4.23% | 4.30% | 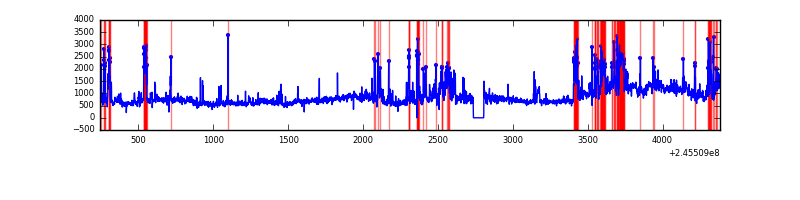 |
| B | 4140 | 4071 | 106 | 106 | 2.56% | 2.60% | 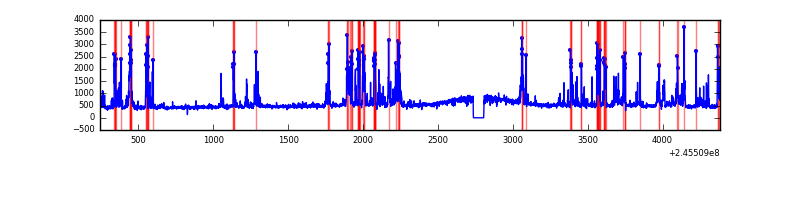 |
| C | 4140 | 4071 | 0 | 0 | 0.00% | 0.00% | 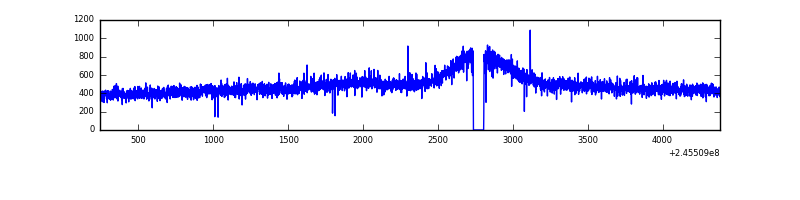 |
| D | 4140 | 4071 | 5 | 5 | 0.12% | 0.12% | 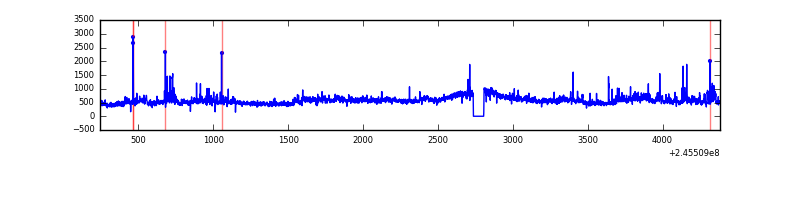 |
Top three noisy pixels from each quadrant. If the there are fewer than three noisy pixels in the level2.evt file, extra rows are filled as -1
| Pixel properties | Quadrant properties | ||||||
|---|---|---|---|---|---|---|---|
| Quadrant | DetID | PixID | Counts | Sigma | Mean | Median | Sigma |
| A | 15 | 174 | 898218 | 8607.91 | 502 | 490 | 104.3 |
| A | 8 | 5 | 432522 | 4142.56 | 502 | 490 | 104.3 |
| A | 14 | 238 | 335581 | 3213.04 | 502 | 490 | 104.3 |
| B | 4 | 239 | 679094 | 6794.08 | 510 | 496 | 99.9 |
| B | 12 | 111 | 11541 | 110.58 | 510 | 496 | 99.9 |
| B | 0 | 214 | 10370 | 98.86 | 510 | 496 | 99.9 |
| C | 8 | 128 | 4028 | 30.01 | 505 | 505 | 117.4 |
| C | 13 | 61 | 3779 | 27.89 | 505 | 505 | 117.4 |
| C | 8 | 112 | 2045 | 13.12 | 505 | 505 | 117.4 |
| D | 11 | 129 | 286893 | 2361.9 | 503 | 487 | 121.3 |
| D | 1 | 52 | 105722 | 867.84 | 503 | 487 | 121.3 |
| D | 5 | 97 | 24279 | 196.2 | 503 | 487 | 121.3 |
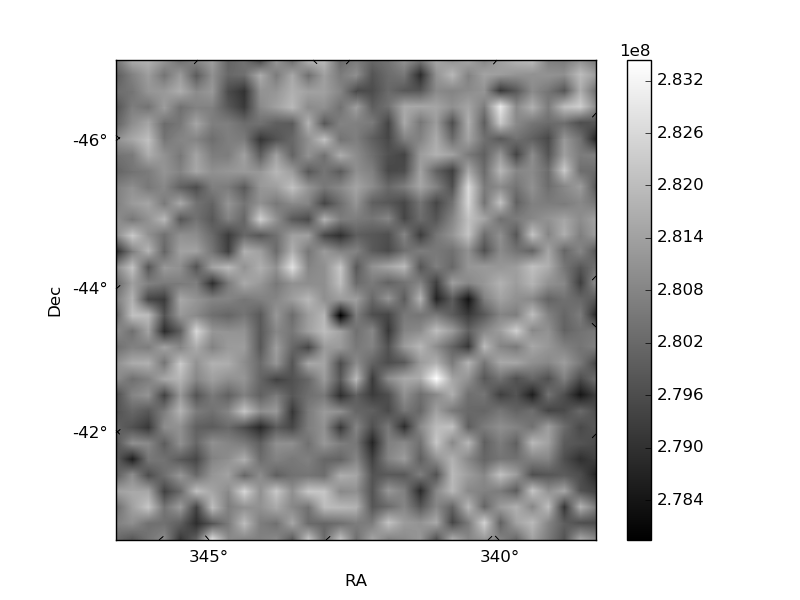
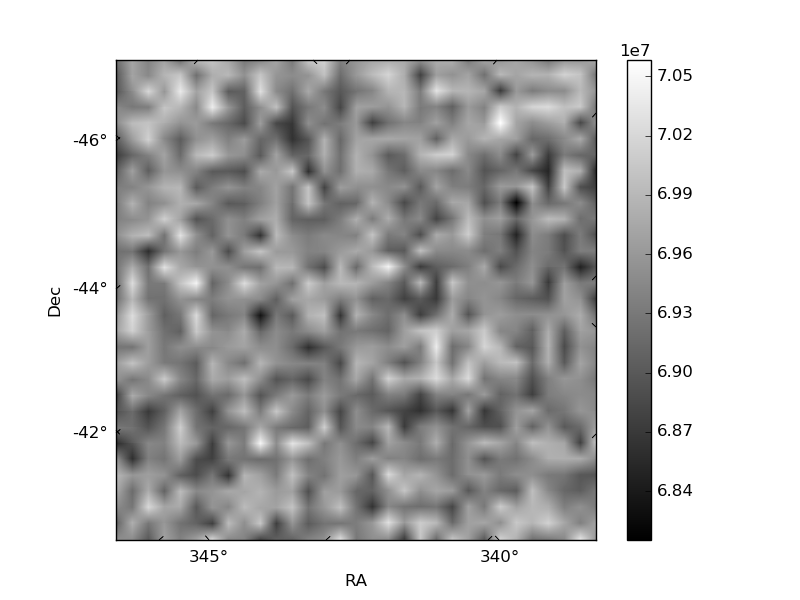
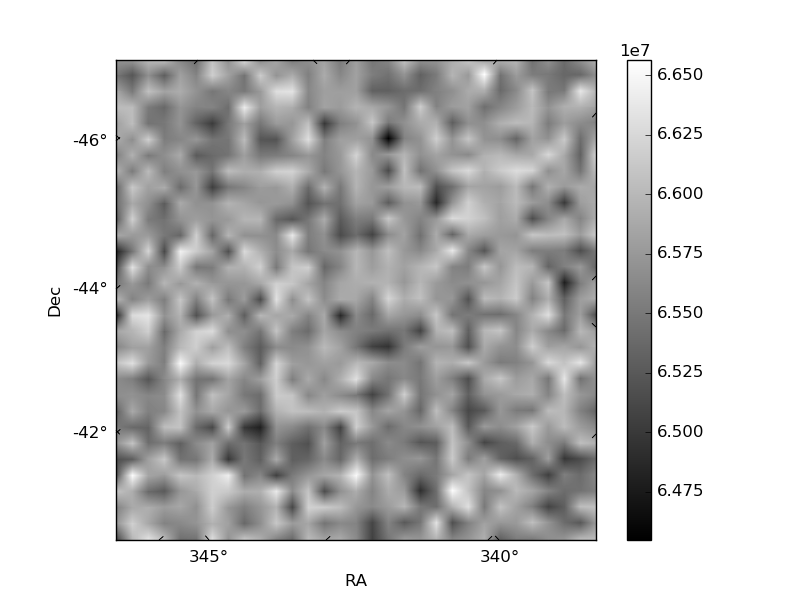
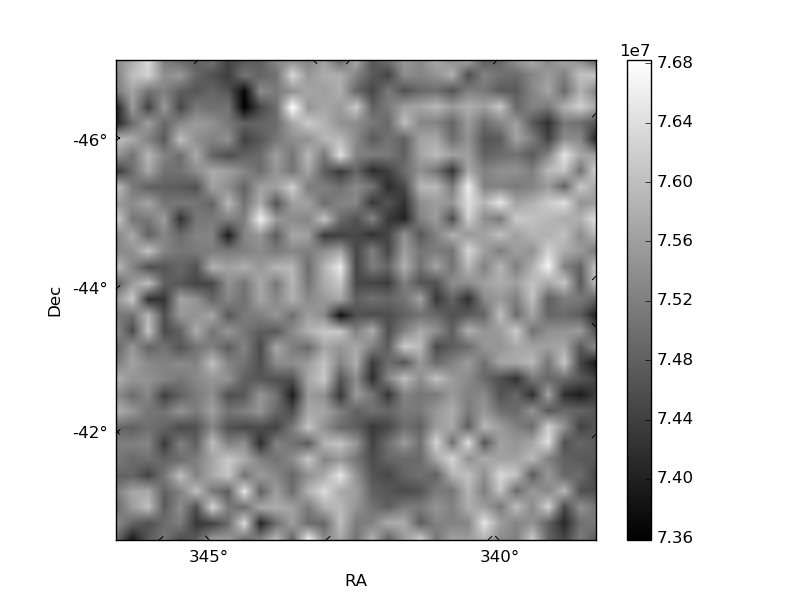
Histogram calculated using DETX and DETY for each event in the final _common_clean file
| Quadrant A | 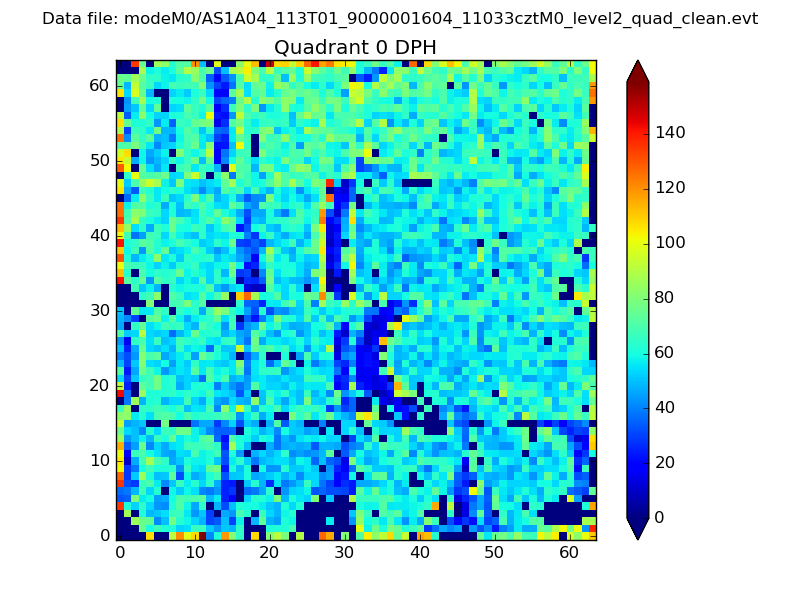 |
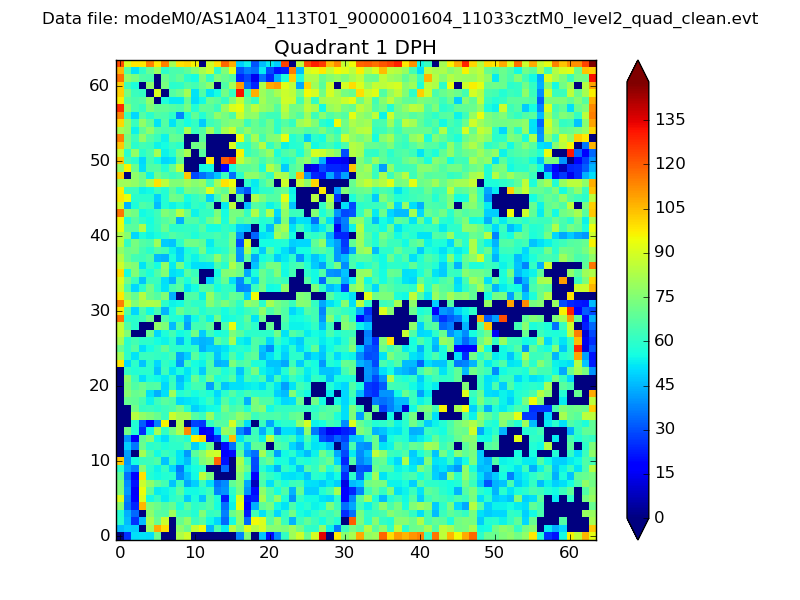 |
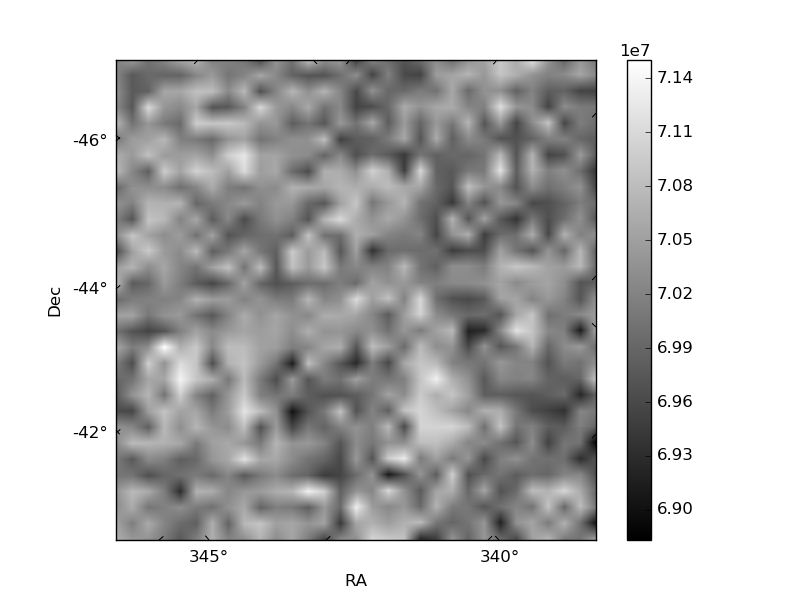
Quadrant B |
|---|---|---|---|
| Quadrant D | 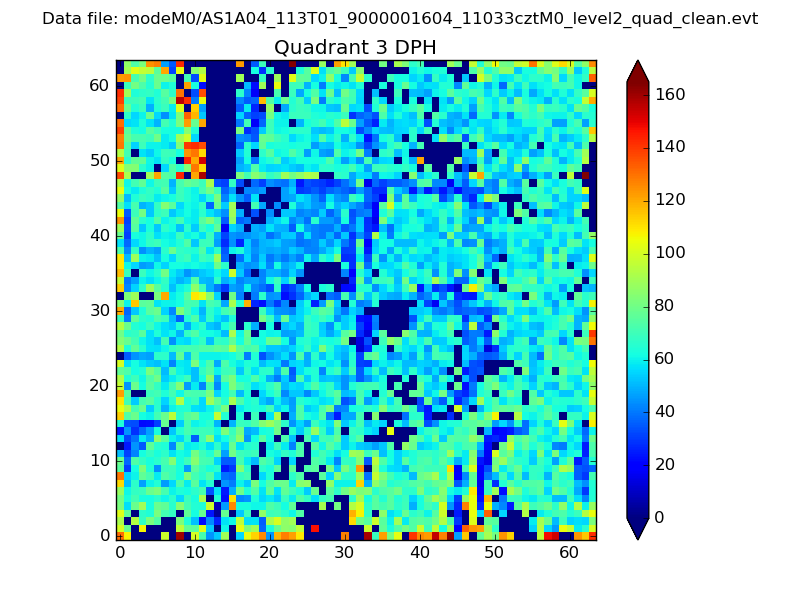 |
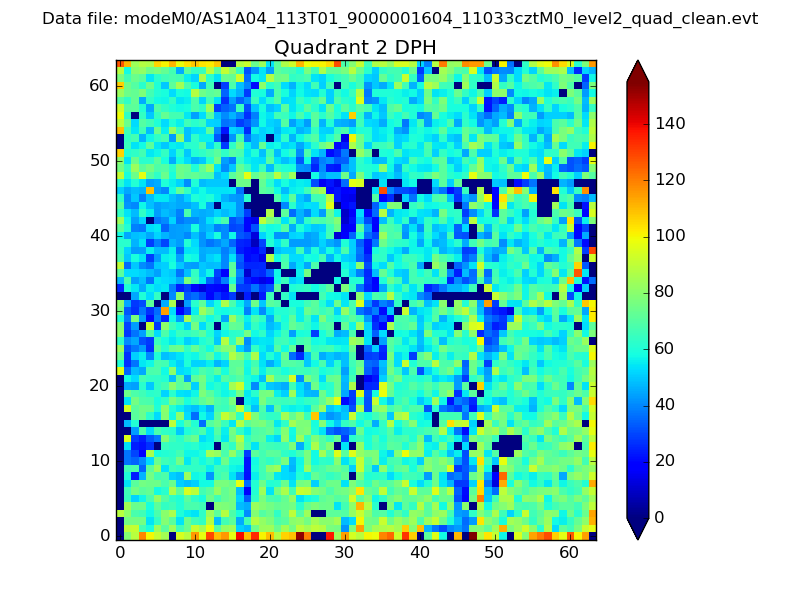 |
Quadrant C |
| Plot type | Count rate plots | Images |
|---|---|---|
| Comparison with Poisson distribution Blue bars denote a histogram of data divided into 1 sec bins. Red curve is a Poisson curve with rate = median count rate of data. |
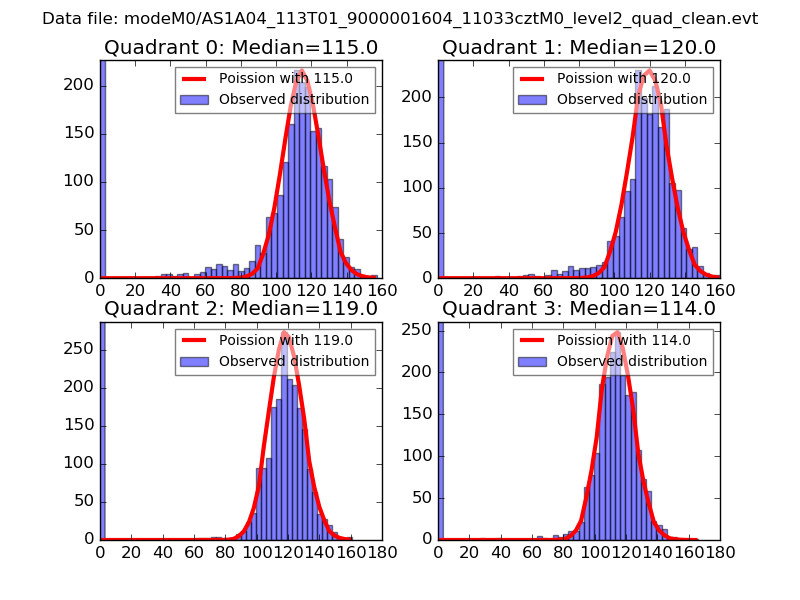 |
 |
| Quadrant-wise count rates Data is divided into 100 sec bins |
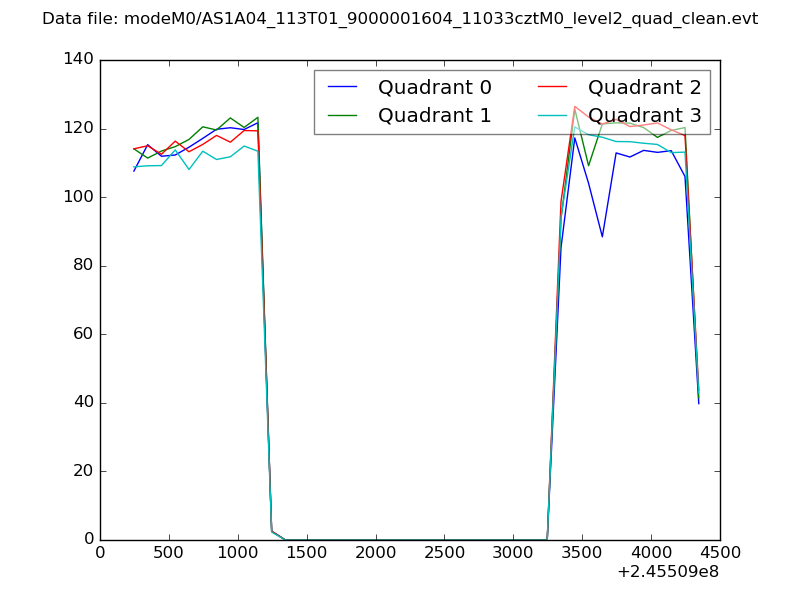 |
|
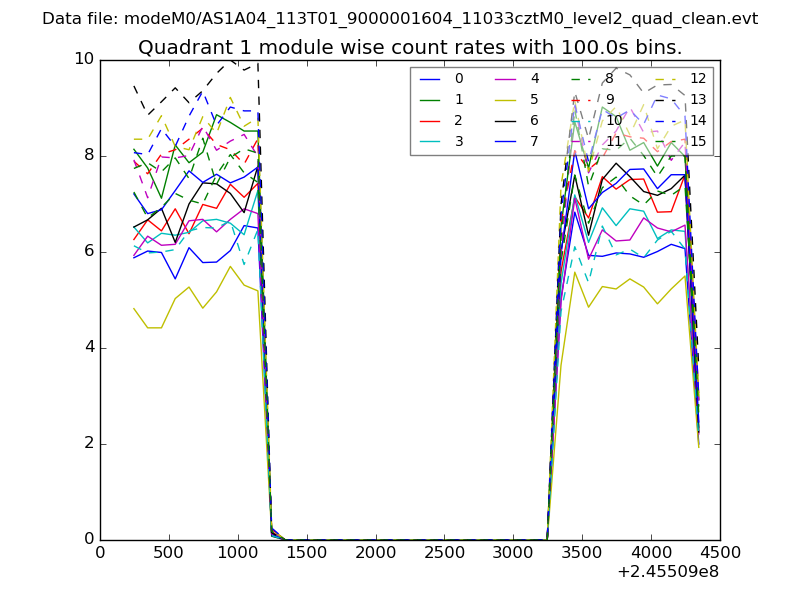
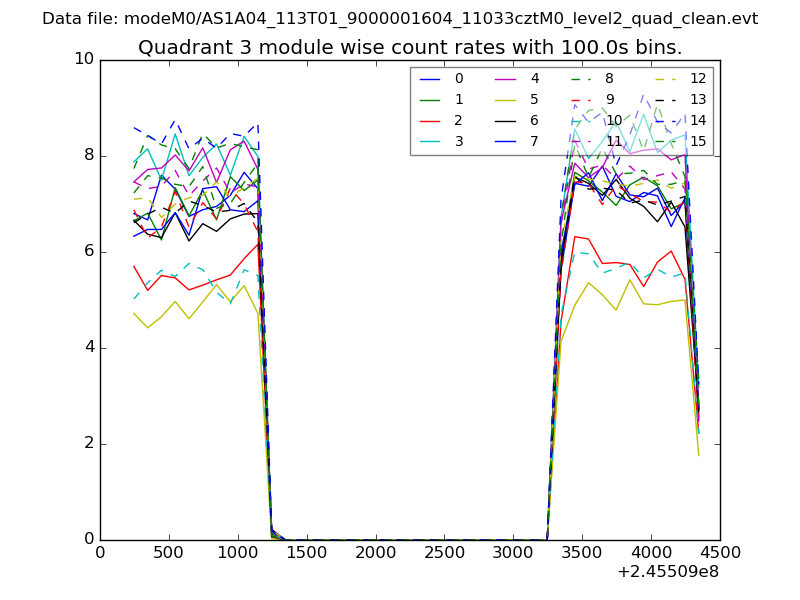
| Module-wise count rates for Quadrant A Data is divided into 100 sec bins |
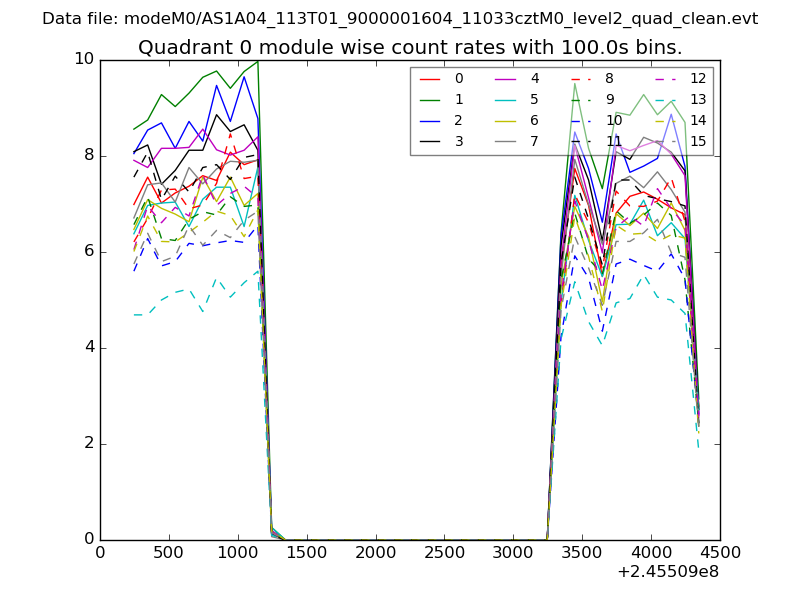 |
 |
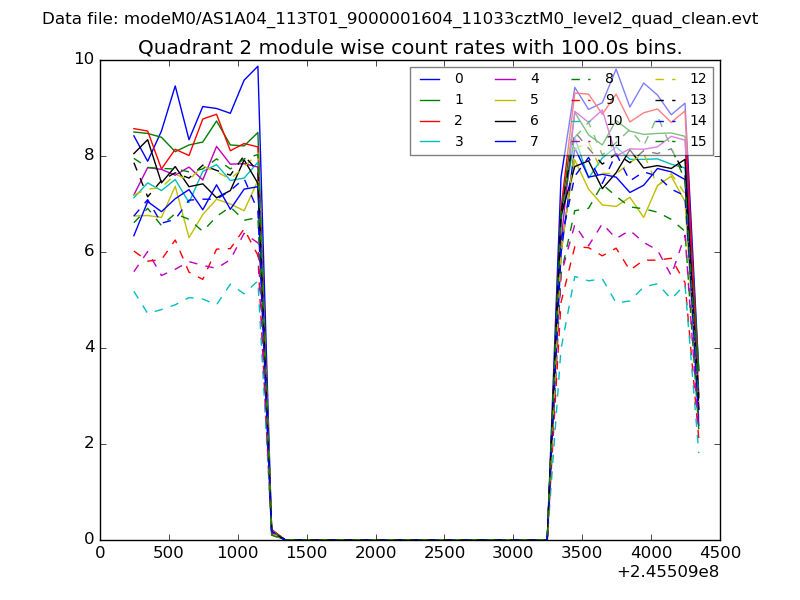
| Module-wise count rates for Quadrant B Data is divided into 100 sec bins |
 |
 |
| Module-wise count rates for Quadrant C Data is divided into 100 sec bins |
 |
 |
| Module-wise count rates for Quadrant D Data is divided into 100 sec bins |
 |
 |
| Parameter | Plot |
|---|---|
| CZT HV Monitor | 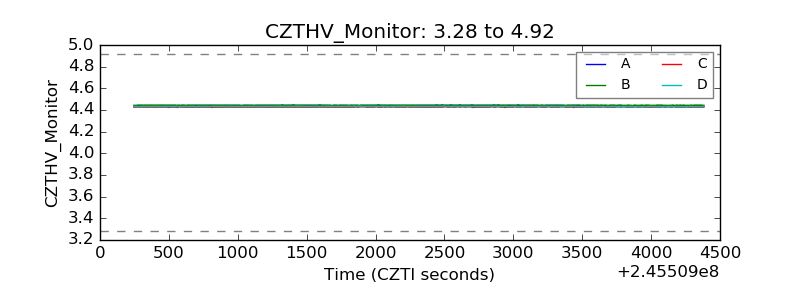 |
| D_VDD | 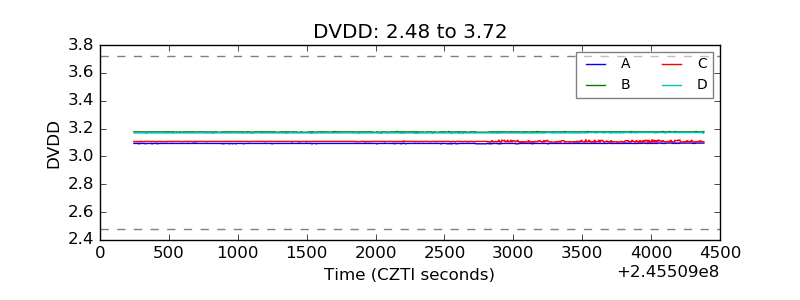 |
| Temperature 1 | 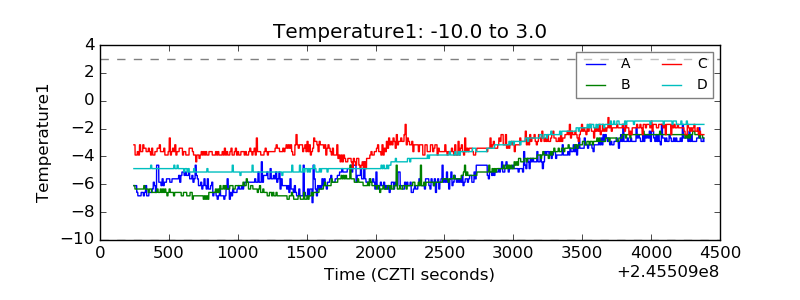 |
| Veto HV Monitor | 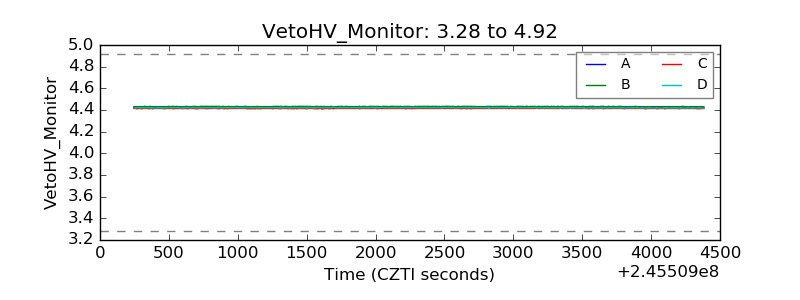 |
| Veto LLD | 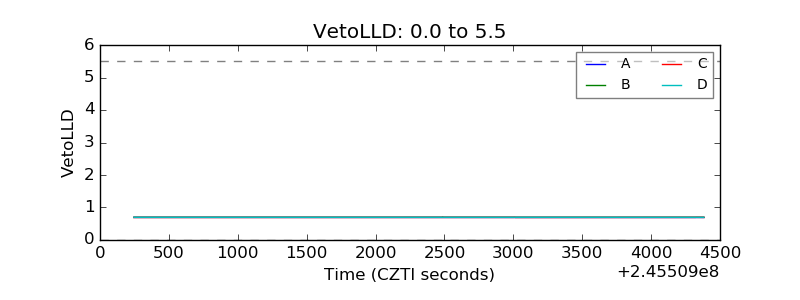 |
| Alpha Counter | 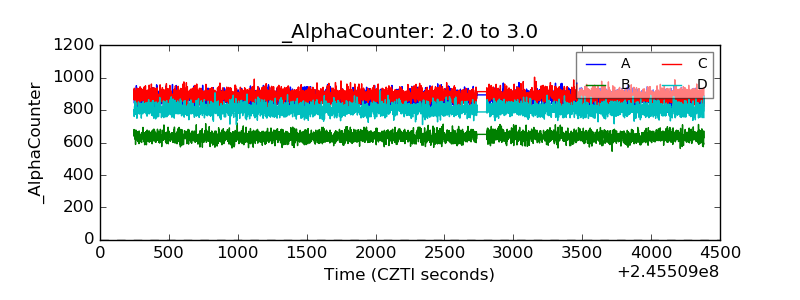 |
| _CPM_Rate | 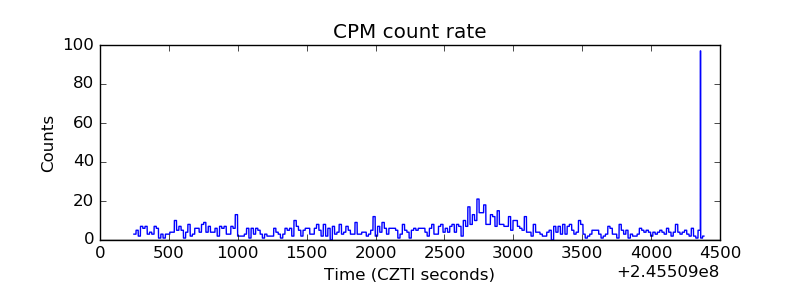 |
| CZT Counter | 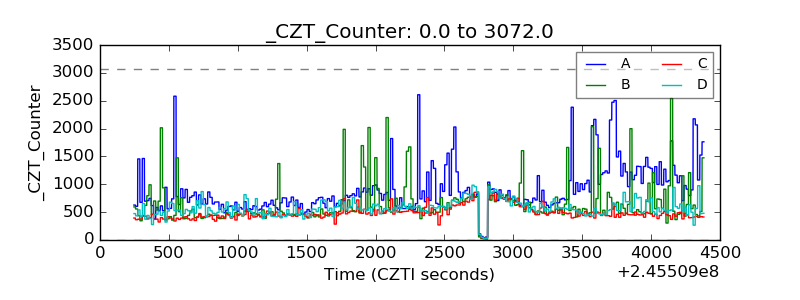 |
| +2.5 Volts monitor |  |
| +5 Volts monitor |  |
| _ROLL_ROT | 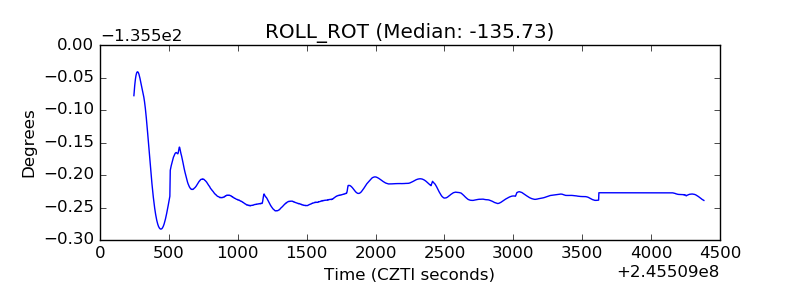 |
| _Roll_DEC | 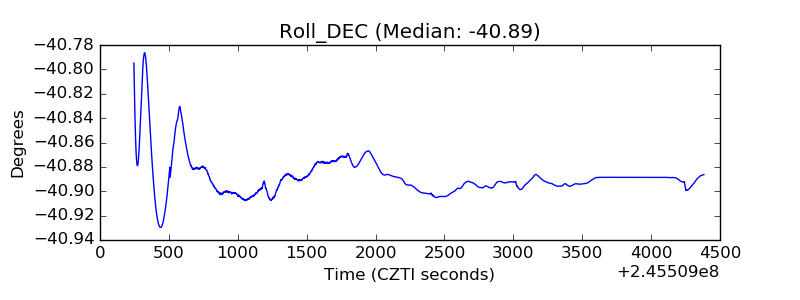 |
| _Roll_RA | 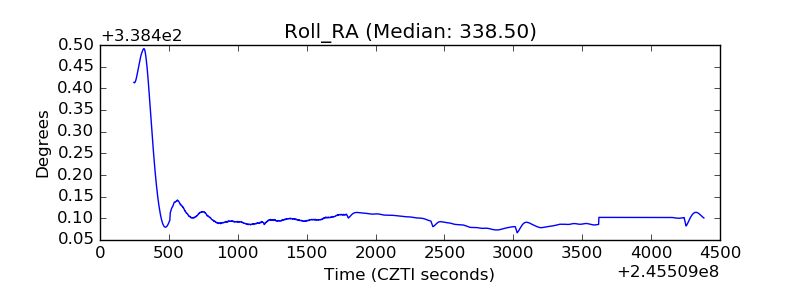 |
| Veto Counter | 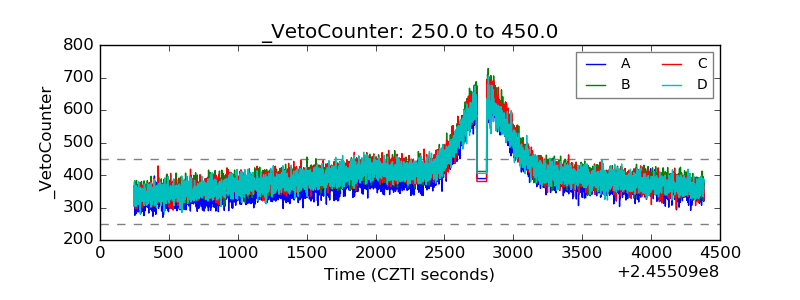 |