| Param | Original file | Final file |
|---|---|---|
| Filename | modeM0/AS1A04_113T01_9000001604_11038cztM0_level2.evt | modeM0/AS1A04_113T01_9000001604_11038cztM0_level2_quad_clean.evt |
| Size (bytes) | 2,156,480,640 | 264,954,240 |
| Size | 2.0 GB | 252.7 MB |
| Events in quadrant A | 21,839,015 | 1,523,292 |
| Events in quadrant B | 14,531,659 | 1,661,655 |
| Events in quadrant C | 10,430,377 | 1,717,744 |
| Events in quadrant D | 16,954,856 | 1,533,505 |
| Mode M9 | |||
|---|---|---|---|
| Quadrant | BADHDUFLAG | Total packets | Discarded packets |
| A | 0 | 25 | 3 |
| B | 0 | 25 | 5 |
| C | 0 | 25 | 3 |
| D | 0 | 25 | 3 |
| Mode M0 | |||
|---|---|---|---|
| Quadrant | BADHDUFLAG | Total packets | Discarded packets |
| A | 0 | 104565 | 24354 |
| B | 0 | 72685 | 14045 |
| C | 0 | 58245 | 10311 |
| D | 0 | 82855 | 16697 |
| Mode SS | |||
|---|---|---|---|
| Quadrant | BADHDUFLAG | Total packets | Discarded packets |
| A | 0 | 582 | 104 |
| B | 0 | 582 | 100 |
| C | 0 | 582 | 80 |
| D | 0 | 582 | 108 |
| Quadrant | Total seconds | Saturated seconds | Saturation percentage |
|---|---|---|---|
| A | 22440 | 3214 | 14.322638% |
| B | 23150 | 1256 | 5.425486% |
| C | 23479 | 89 | 0.379062% |
| D | 22810 | 1065 | 4.669005% |
Noise dominated data is calculated using 1-second bins in cleaned event files. If a bin has >2000 counts, and if more than 50% of those come from <1% of pixels, then it is considered to be noise-dominated and hence unusable.
| Quadrant | # 1 sec bins | Bins with >0 counts | Bins with >2000 counts | High rate bins dominated by noise | Noise dominated (total time) | Noise dominated (detector-on time) | Marked lightcurve |
|---|---|---|---|---|---|---|---|
| A | 31169 | 24001 | 2144 | 2144 | 6.88% | 8.93% | 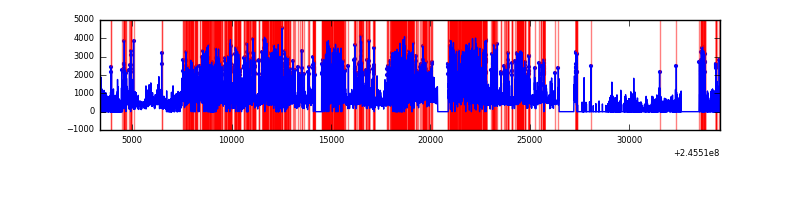 |
| B | 31167 | 24853 | 679 | 679 | 2.18% | 2.73% | 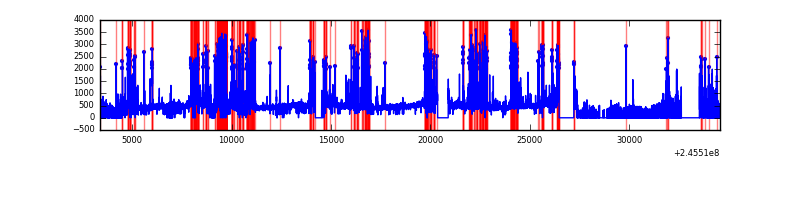 |
| C | 31171 | 25119 | 0 | 0 | 0.00% | 0.00% | 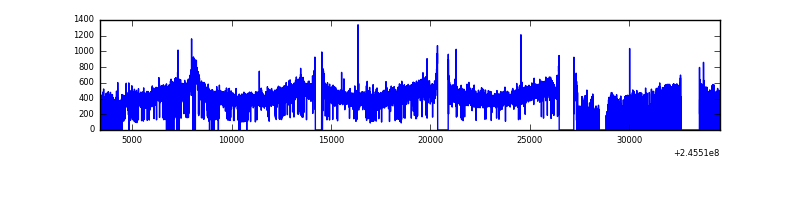 |
| D | 31172 | 24462 | 875 | 875 | 2.81% | 3.58% | 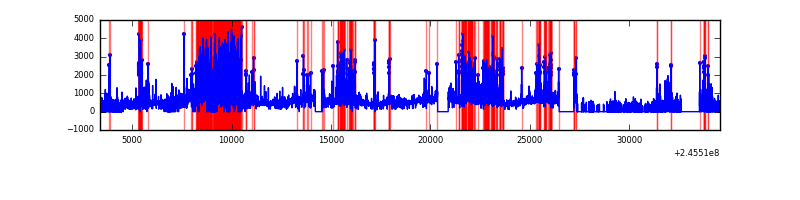 |
Top three noisy pixels from each quadrant. If the there are fewer than three noisy pixels in the level2.evt file, extra rows are filled as -1
| Pixel properties | Quadrant properties | ||||||
|---|---|---|---|---|---|---|---|
| Quadrant | DetID | PixID | Counts | Sigma | Mean | Median | Sigma |
| A | 14 | 238 | 9698333 | 19103.43 | 2492 | 2439 | 507.5 |
| A | 8 | 5 | 1286230 | 2529.4 | 2492 | 2439 | 507.5 |
| A | 15 | 174 | 1128589 | 2218.81 | 2492 | 2439 | 507.5 |
| B | 4 | 239 | 3787796 | 7476.03 | 2668 | 2599 | 506.3 |
| B | 0 | 214 | 83637 | 160.06 | 2668 | 2599 | 506.3 |
| B | 0 | 187 | 65656 | 124.54 | 2668 | 2599 | 506.3 |
| C | 13 | 61 | 19813 | 27.78 | 2664 | 2676 | 616.8 |
| C | 8 | 128 | 19676 | 27.56 | 2664 | 2676 | 616.8 |
| C | 8 | 112 | 12115 | 15.3 | 2664 | 2676 | 616.8 |
| D | 1 | 52 | 3469397 | 5722.99 | 2526 | 2454 | 605.8 |
| D | 11 | 129 | 1426351 | 2350.47 | 2526 | 2454 | 605.8 |
| D | 14 | 34 | 709882 | 1167.77 | 2526 | 2454 | 605.8 |
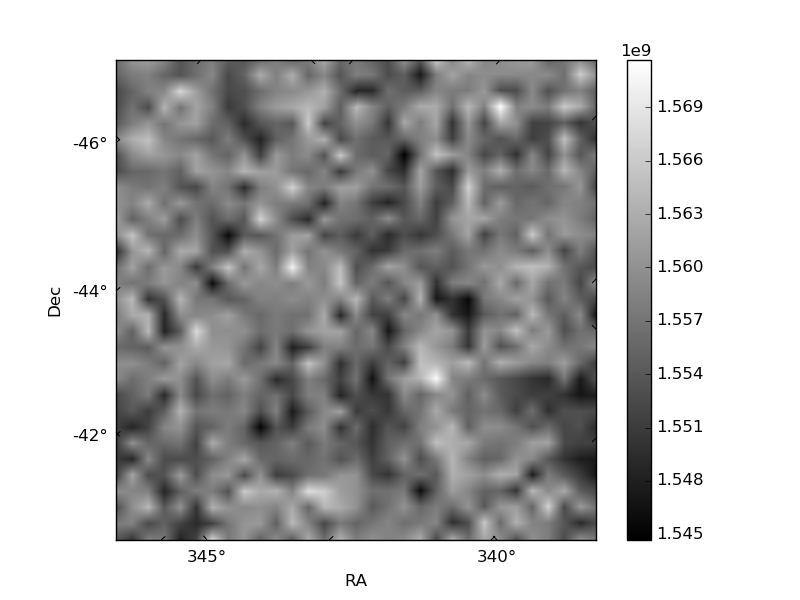
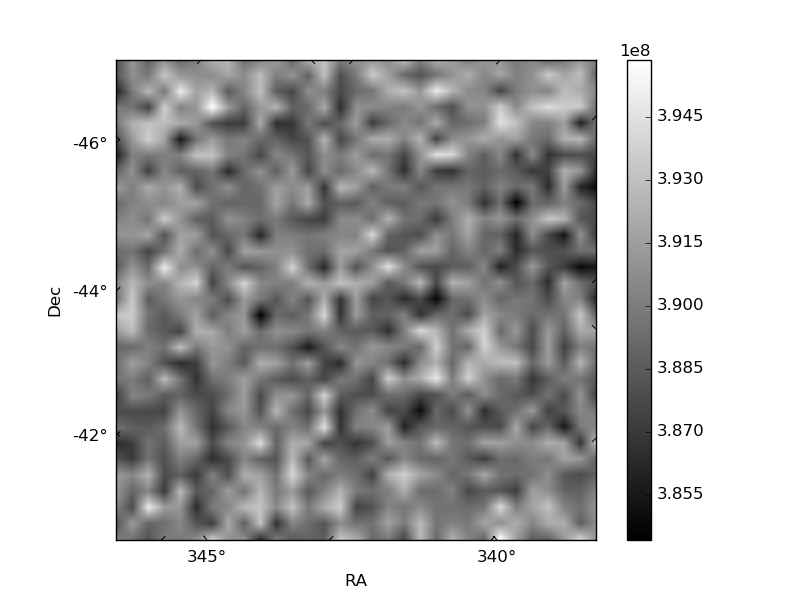
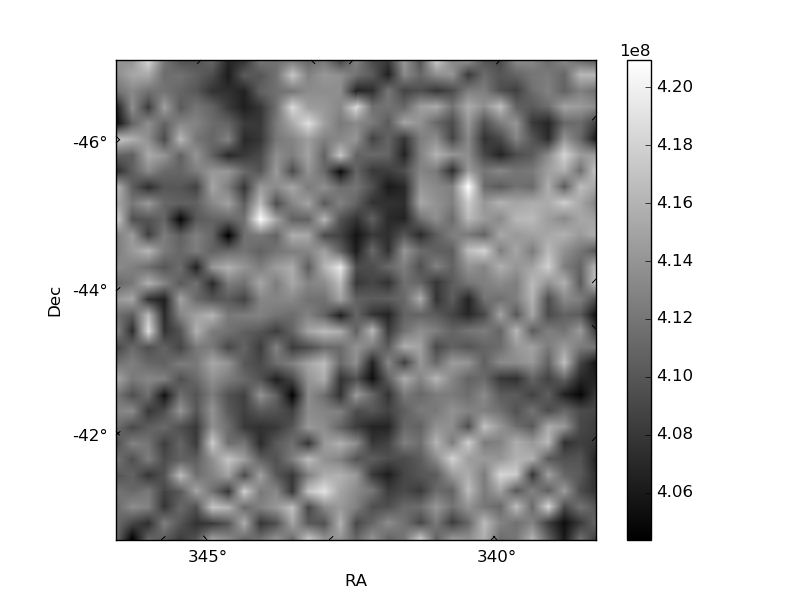
Histogram calculated using DETX and DETY for each event in the final _common_clean file
| Quadrant A | 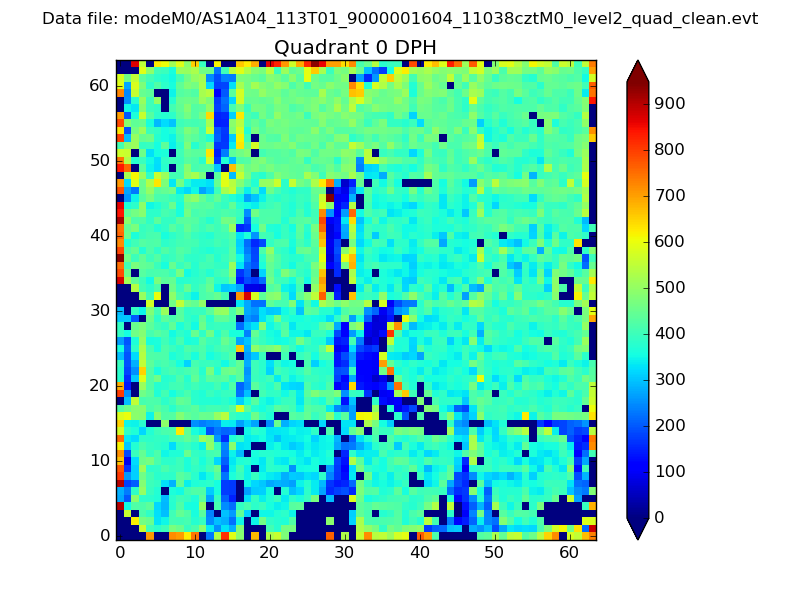 |
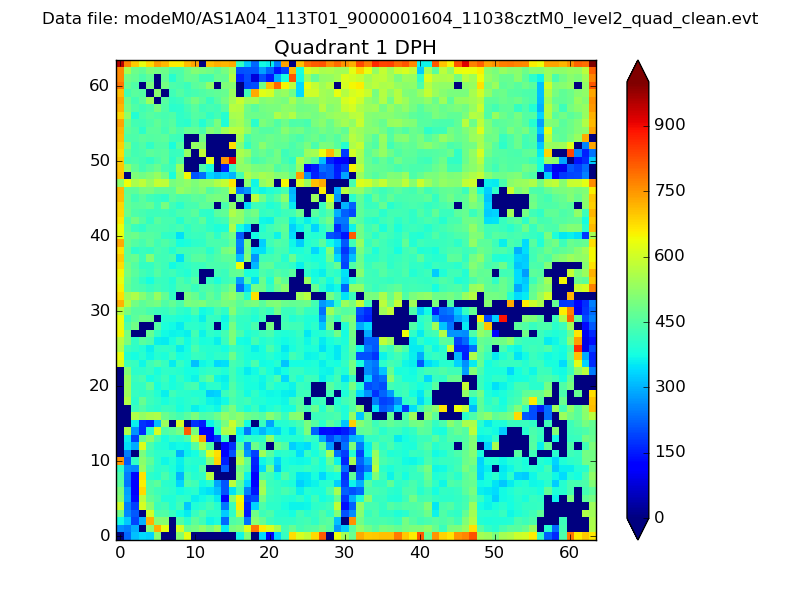 |
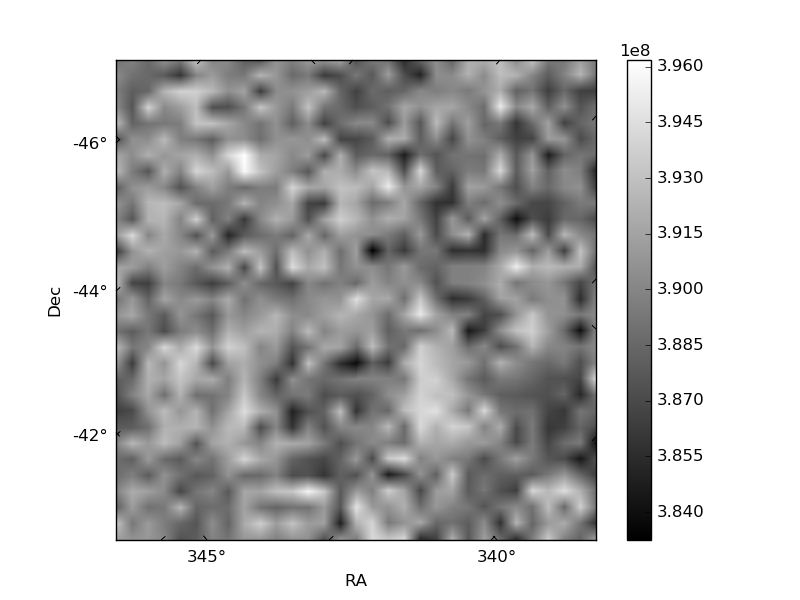
Quadrant B |
|---|---|---|---|
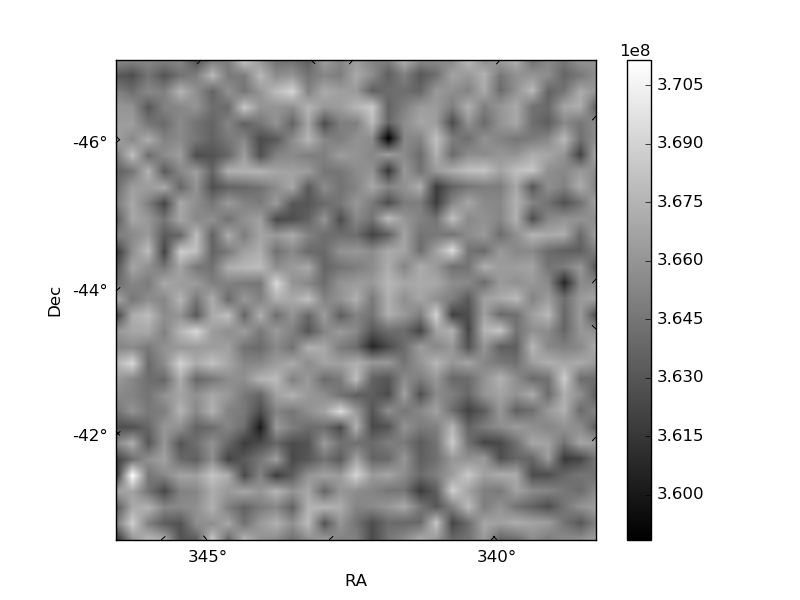
| Quadrant D | 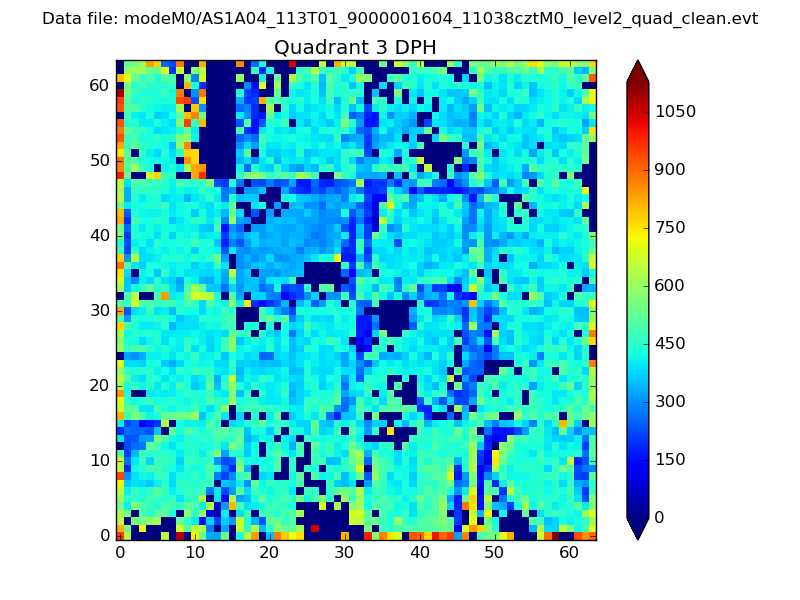 |
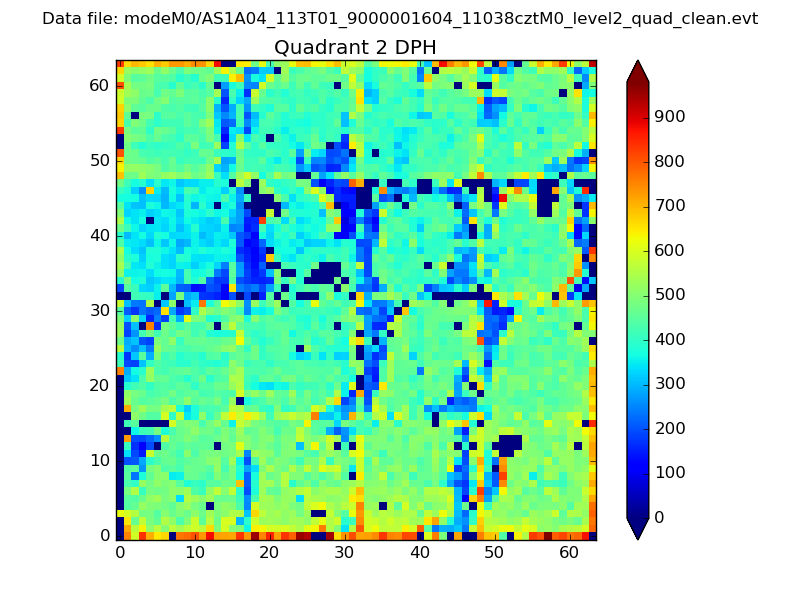 |
Quadrant C |
| Plot type | Count rate plots | Images |
|---|---|---|
| Comparison with Poisson distribution Blue bars denote a histogram of data divided into 1 sec bins. Red curve is a Poisson curve with rate = median count rate of data. |
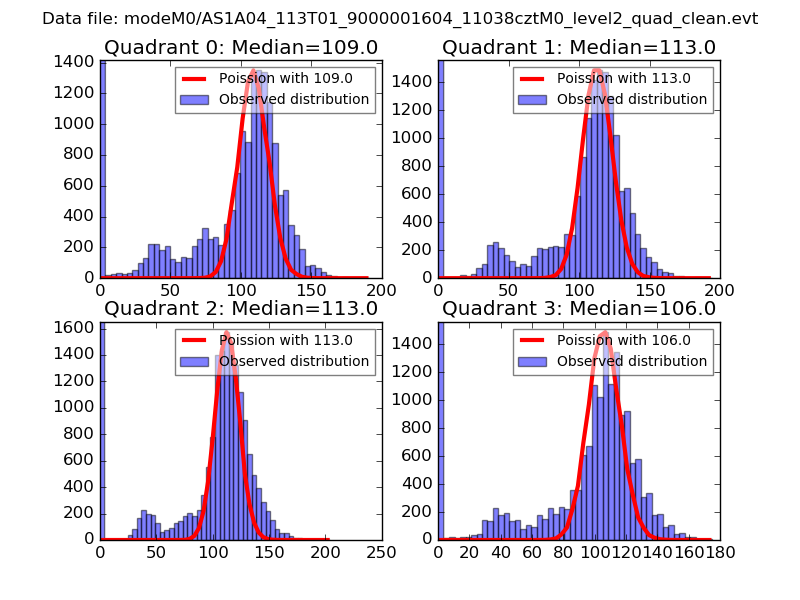 |
 |
| Quadrant-wise count rates Data is divided into 100 sec bins |
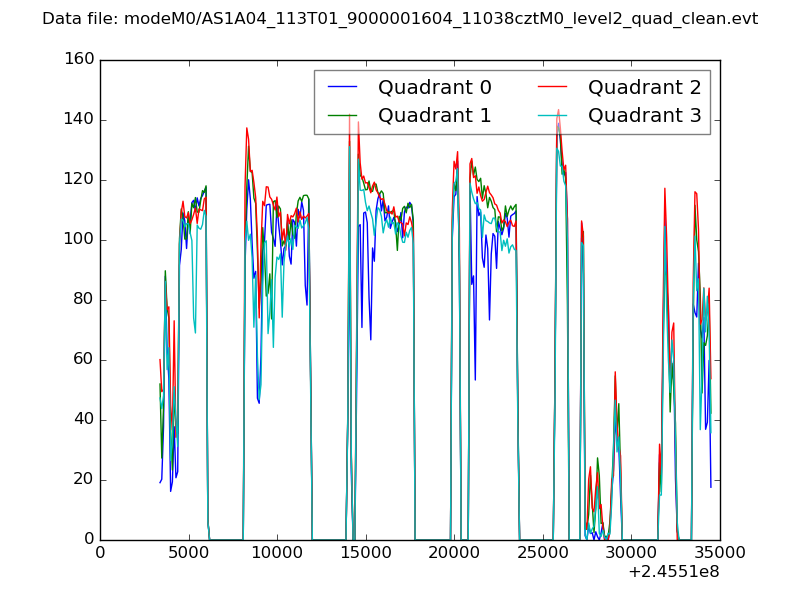 |
|
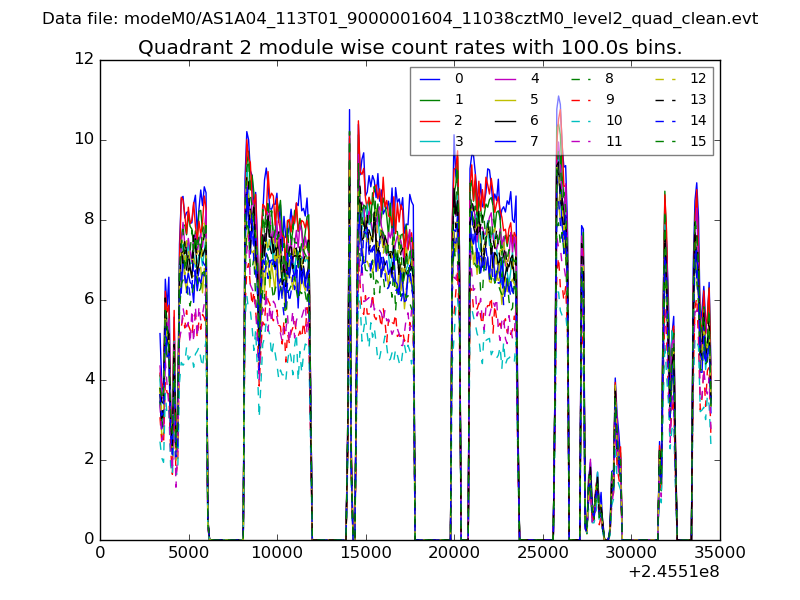
| Module-wise count rates for Quadrant A Data is divided into 100 sec bins |
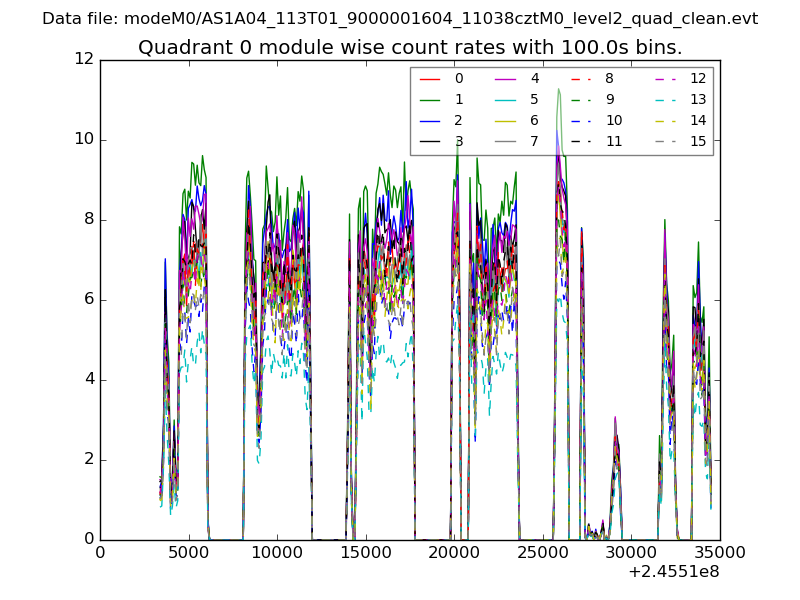 |
 |
| Module-wise count rates for Quadrant B Data is divided into 100 sec bins |
 |
 |
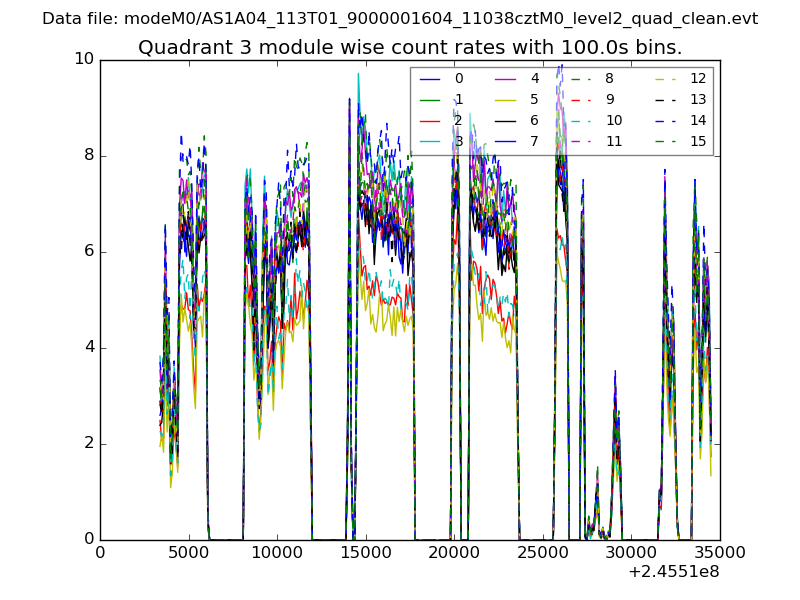
| Module-wise count rates for Quadrant C Data is divided into 100 sec bins |
 |
 |
| Module-wise count rates for Quadrant D Data is divided into 100 sec bins |
 |
 |
| Parameter | Plot |
|---|---|
| CZT HV Monitor | 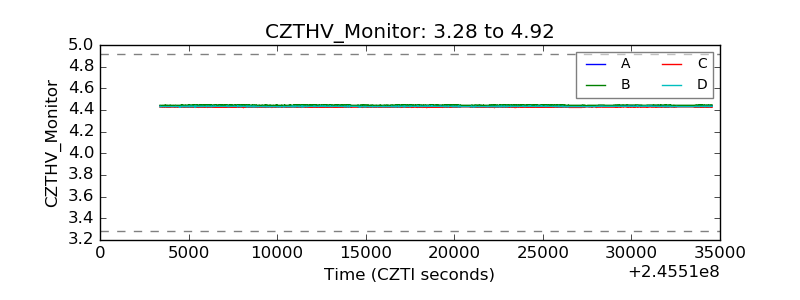 |
| D_VDD | 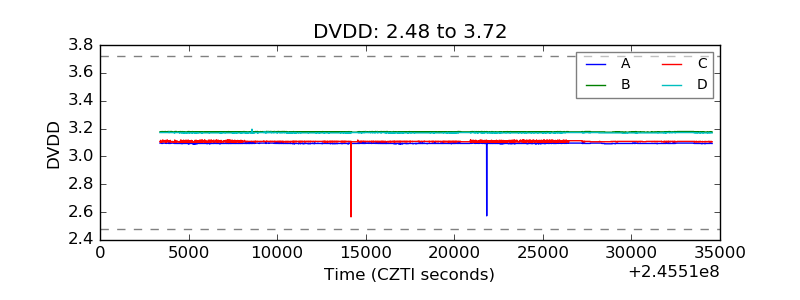 |
| Temperature 1 | 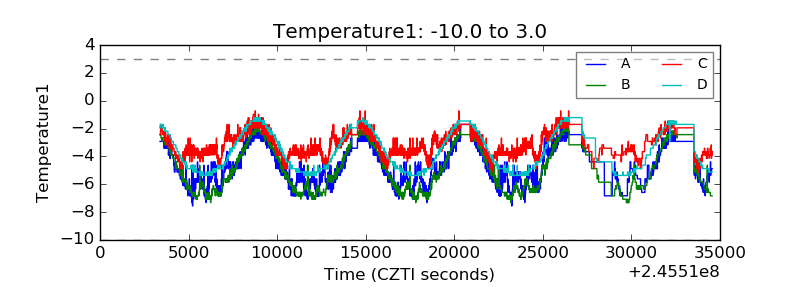 |
| Veto HV Monitor | 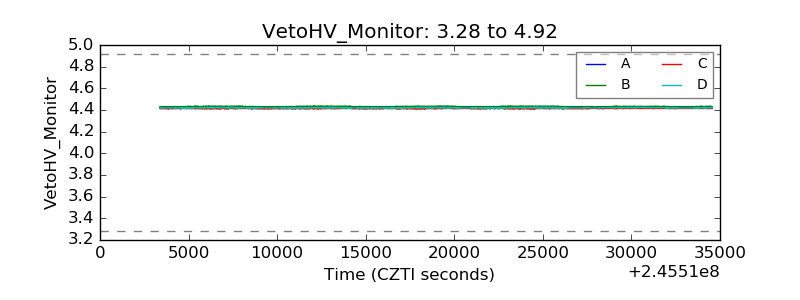 |
| Veto LLD | 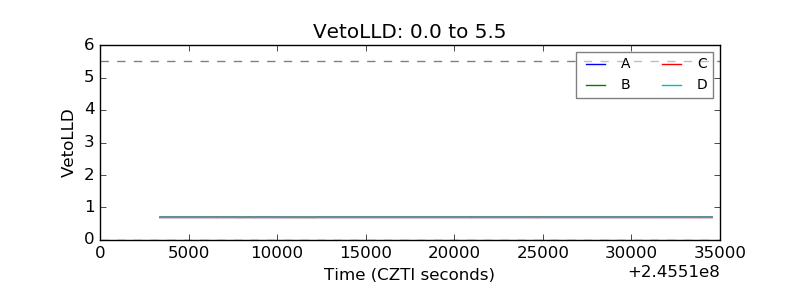 |
| Alpha Counter | 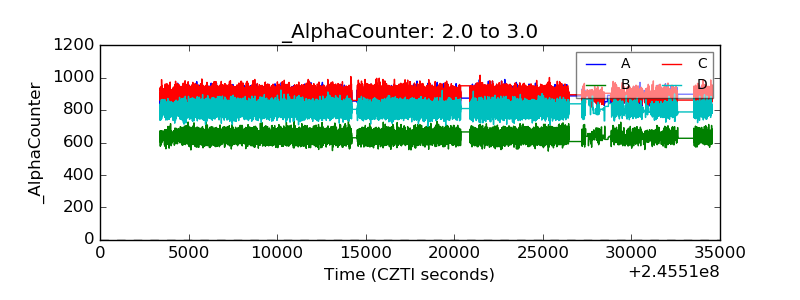 |
| _CPM_Rate | 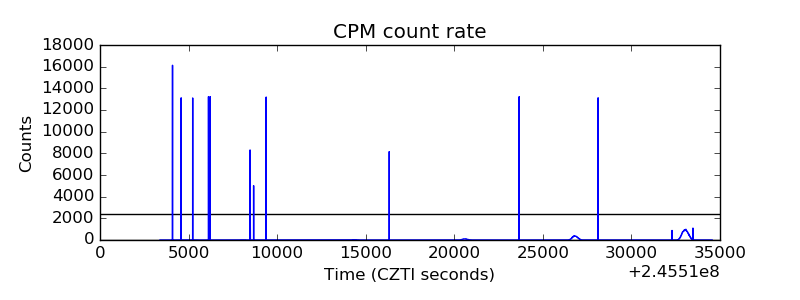 |
| CZT Counter | 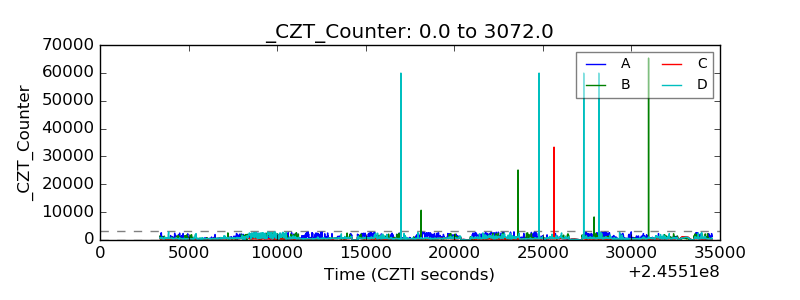 |
| +2.5 Volts monitor |  |
| +5 Volts monitor | 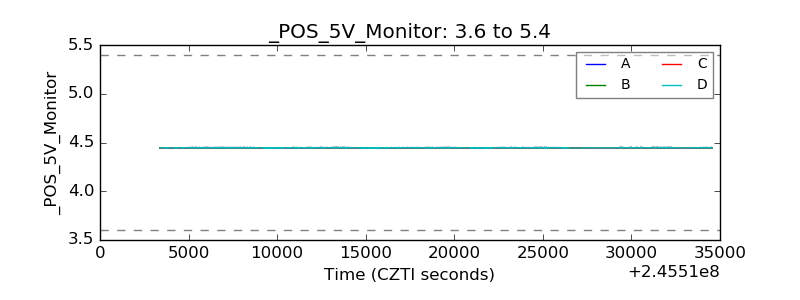 |
| _ROLL_ROT | 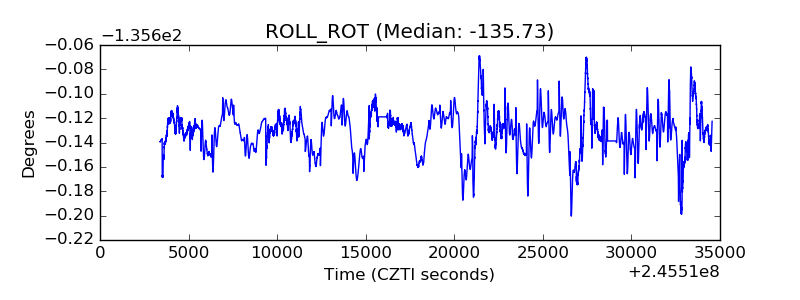 |
| _Roll_DEC | 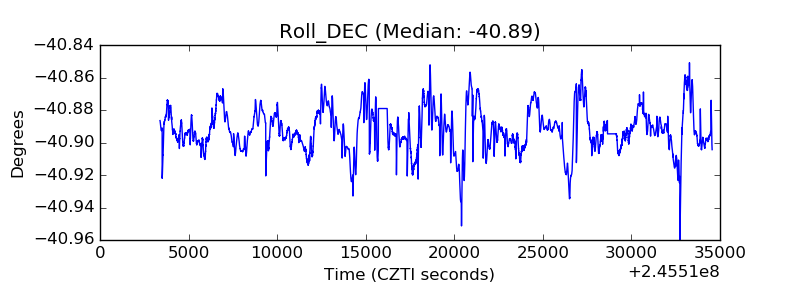 |
| _Roll_RA | 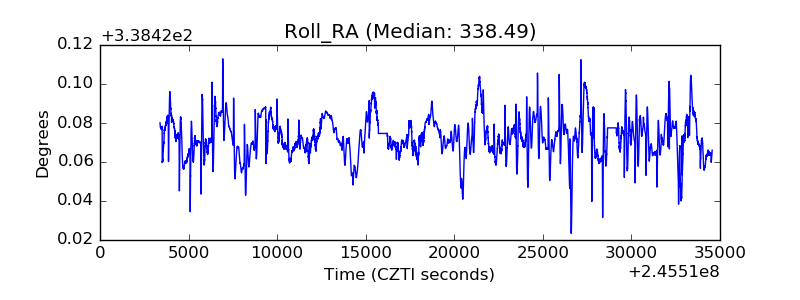 |
| Veto Counter | 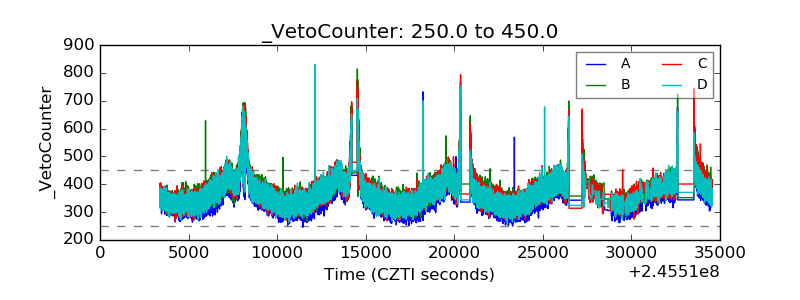 |