| Param | Original file | Final file |
|---|---|---|
| Filename | modeM0/AS1A04_113T01_9000001604_11039cztM0_level2.evt | modeM0/AS1A04_113T01_9000001604_11039cztM0_level2_quad_clean.evt |
| Size (bytes) | 130,176,000 | 23,990,400 |
| Size | 124.1 MB | 22.9 MB |
| Events in quadrant A | 1,311,213 | 151,651 |
| Events in quadrant B | 993,070 | 161,014 |
| Events in quadrant C | 593,705 | 164,794 |
| Events in quadrant D | 956,189 | 153,635 |
| Mode M9 | |||
|---|---|---|---|
| Quadrant | BADHDUFLAG | Total packets | Discarded packets |
| A | 0 | 9 | 0 |
| B | 0 | 9 | 0 |
| C | 0 | 9 | 0 |
| D | 0 | 9 | 0 |
| Mode M0 | |||
|---|---|---|---|
| Quadrant | BADHDUFLAG | Total packets | Discarded packets |
| A | 0 | 4803 | 26 |
| B | 0 | 3800 | 21 |
| C | 0 | 2610 | 3 |
| D | 0 | 3698 | 10 |
| Mode SS | |||
|---|---|---|---|
| Quadrant | BADHDUFLAG | Total packets | Discarded packets |
| A | 0 | 28 | 0 |
| B | 0 | 28 | 0 |
| C | 0 | 28 | 0 |
| D | 0 | 28 | 0 |
| Quadrant | Total seconds | Saturated seconds | Saturation percentage |
|---|---|---|---|
| A | 1255 | 180 | 14.342629% |
| B | 1258 | 122 | 9.697933% |
| C | 1261 | 18 | 1.427439% |
| D | 1259 | 84 | 6.671962% |
Noise dominated data is calculated using 1-second bins in cleaned event files. If a bin has >2000 counts, and if more than 50% of those come from <1% of pixels, then it is considered to be noise-dominated and hence unusable.
| Quadrant | # 1 sec bins | Bins with >0 counts | Bins with >2000 counts | High rate bins dominated by noise | Noise dominated (total time) | Noise dominated (detector-on time) | Marked lightcurve |
|---|---|---|---|---|---|---|---|
| A | 2172 | 1262 | 128 | 128 | 5.89% | 10.14% | 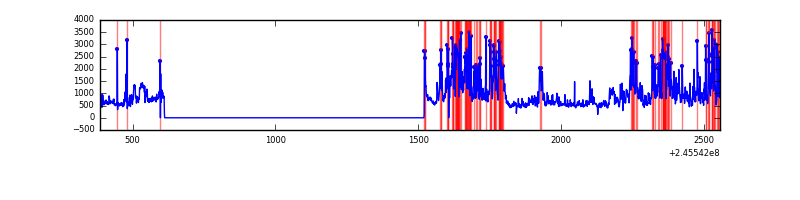 |
| B | 2172 | 1262 | 57 | 57 | 2.62% | 4.52% | 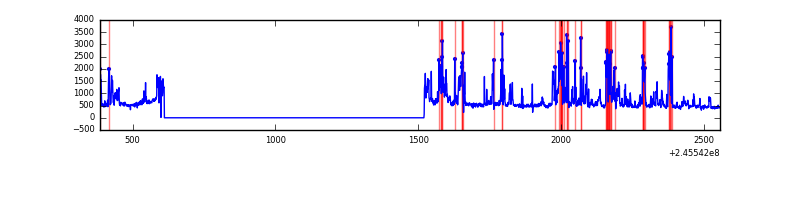 |
| C | 2172 | 1263 | 0 | 0 | 0.00% | 0.00% | 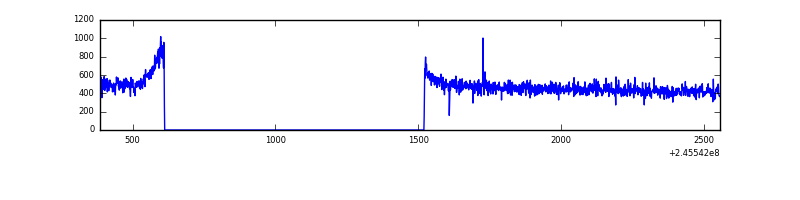 |
| D | 2172 | 1263 | 66 | 66 | 3.04% | 5.23% |  |
Top three noisy pixels from each quadrant. If the there are fewer than three noisy pixels in the level2.evt file, extra rows are filled as -1
| Pixel properties | Quadrant properties | ||||||
|---|---|---|---|---|---|---|---|
| Quadrant | DetID | PixID | Counts | Sigma | Mean | Median | Sigma |
| A | 14 | 238 | 602717 | 18365.53 | 148 | 145 | 32.8 |
| A | 8 | 5 | 94042 | 2861.85 | 148 | 145 | 32.8 |
| A | 15 | 174 | 30303 | 919.17 | 148 | 145 | 32.8 |
| B | 4 | 239 | 373052 | 11814.86 | 153 | 149 | 31.6 |
| B | 0 | 219 | 4896 | 150.4 | 153 | 149 | 31.6 |
| B | 12 | 111 | 3409 | 103.29 | 153 | 149 | 31.6 |
| C | 12 | 4 | 1239 | 29.42 | 151 | 152 | 37.0 |
| C | 13 | 61 | 1107 | 25.85 | 151 | 152 | 37.0 |
| C | 5 | 207 | 455 | 8.2 | 151 | 152 | 37.0 |
| D | 14 | 34 | 205238 | 5548.66 | 147 | 141 | 37.0 |
| D | 11 | 129 | 83422 | 2253.07 | 147 | 141 | 37.0 |
| D | 1 | 52 | 82152 | 2218.71 | 147 | 141 | 37.0 |
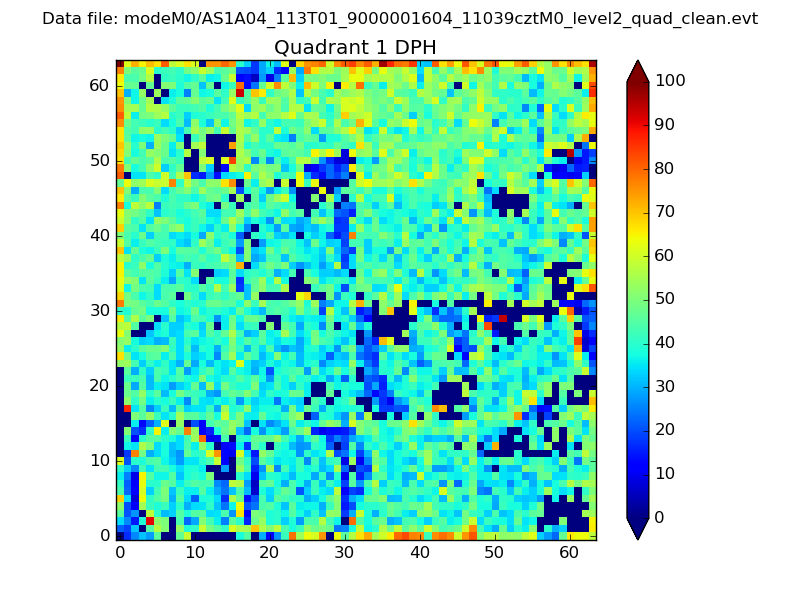
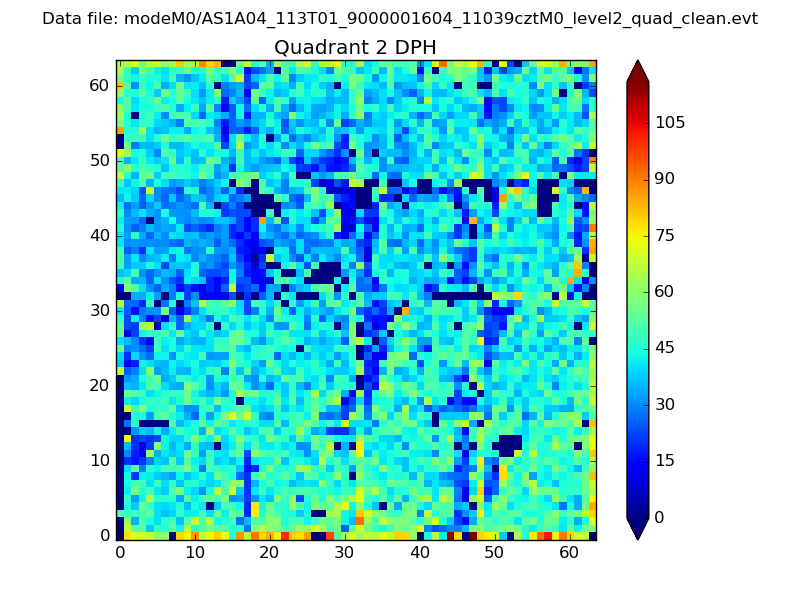
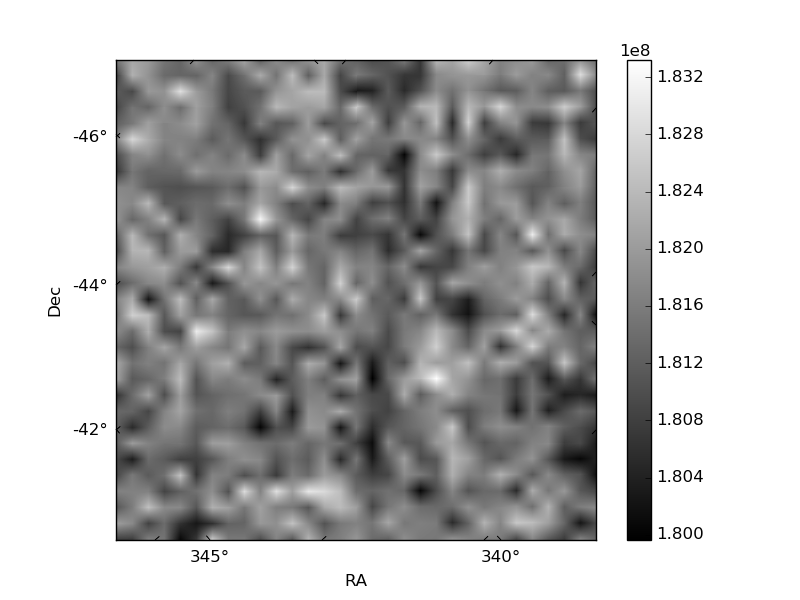
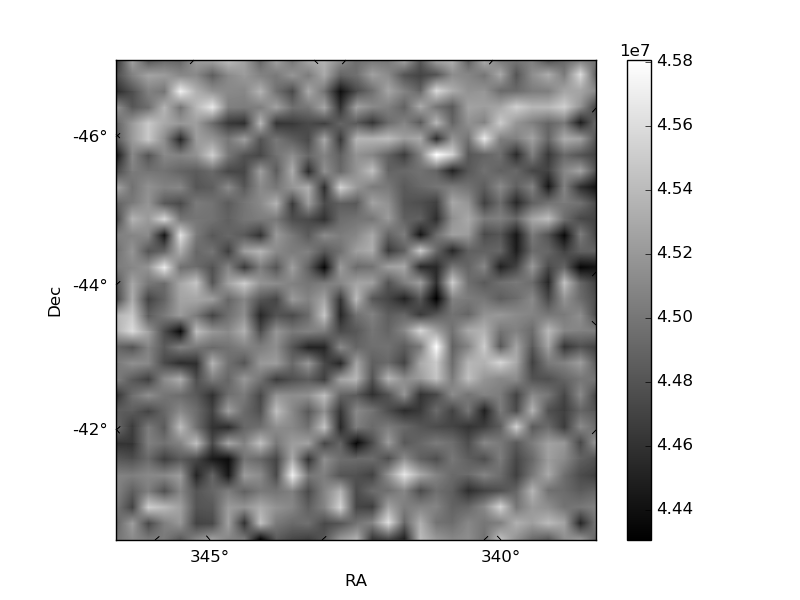
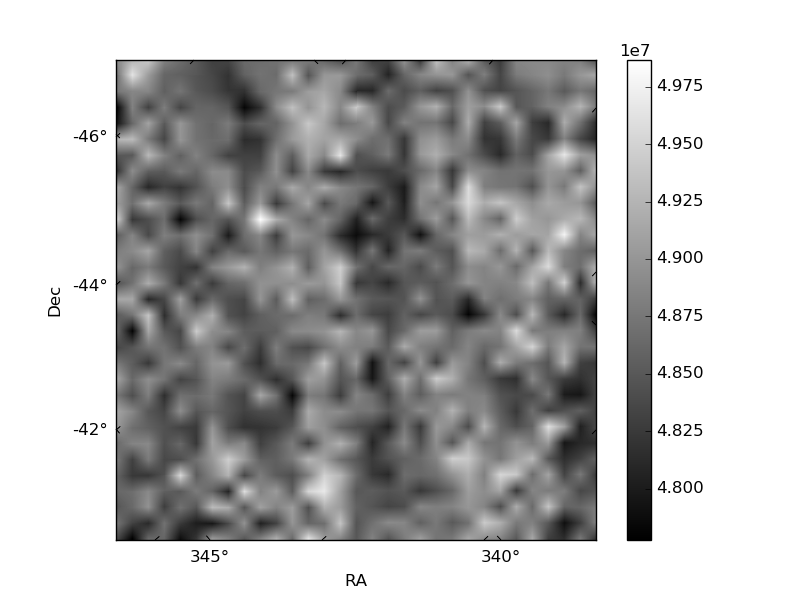
Histogram calculated using DETX and DETY for each event in the final _common_clean file
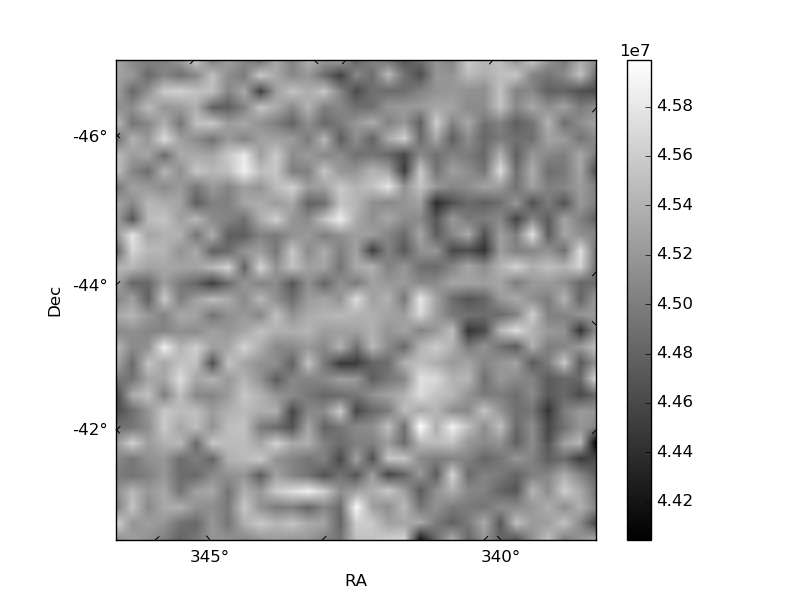
| Quadrant A | 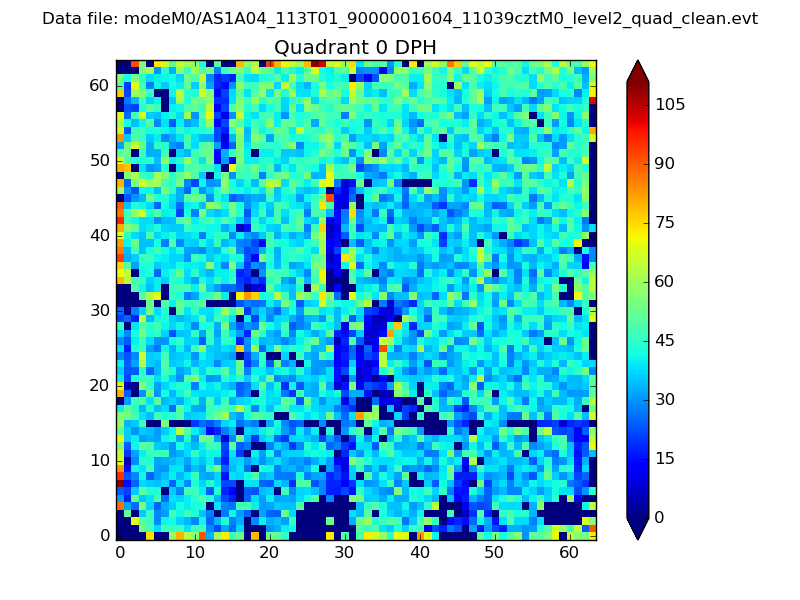 |
 |
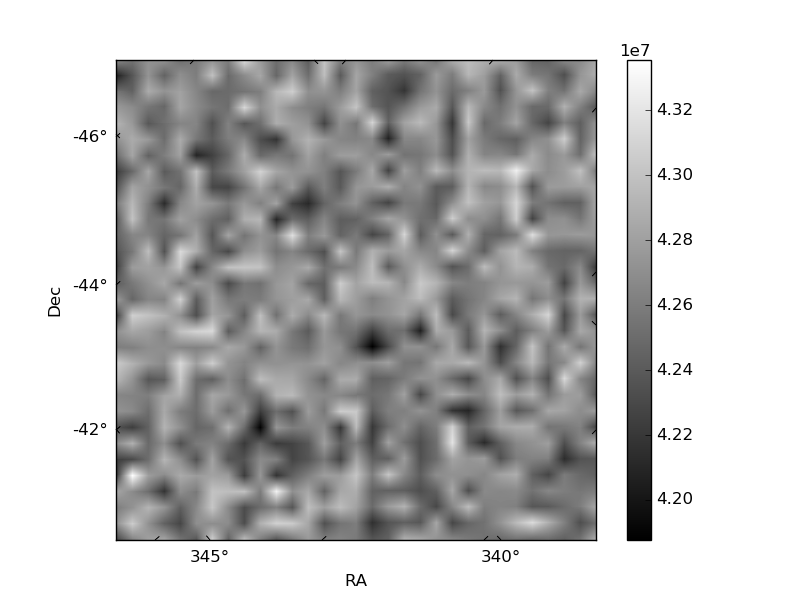
Quadrant B |
|---|---|---|---|
| Quadrant D | 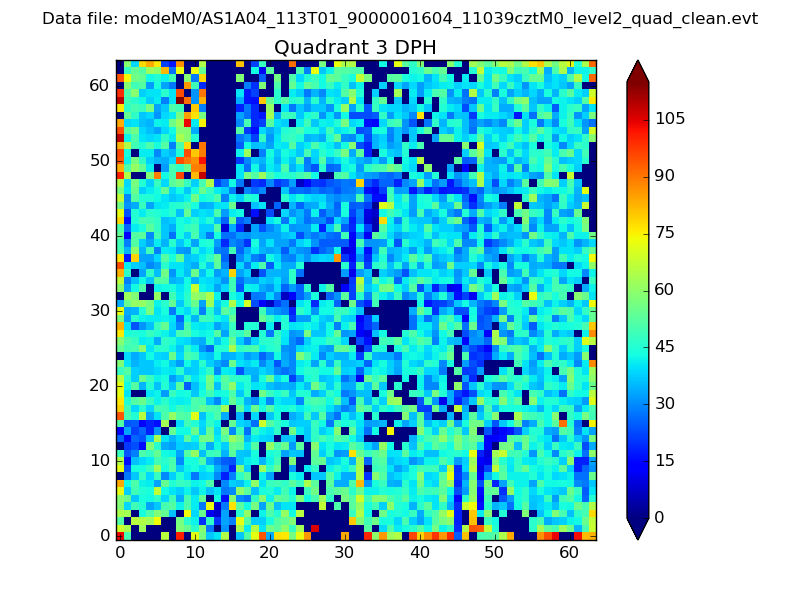 |
 |
Quadrant C |
| Plot type | Count rate plots | Images |
|---|---|---|
| Comparison with Poisson distribution Blue bars denote a histogram of data divided into 1 sec bins. Red curve is a Poisson curve with rate = median count rate of data. |
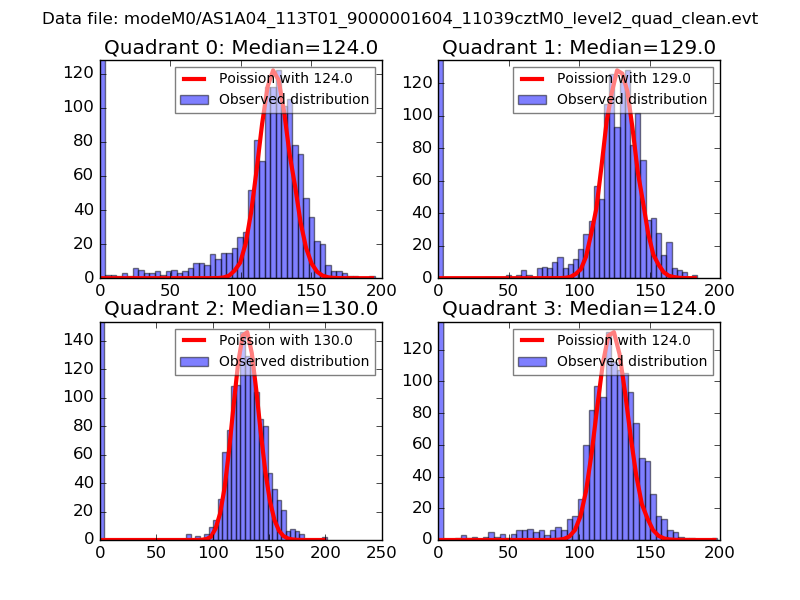 |
 |
| Quadrant-wise count rates Data is divided into 100 sec bins |
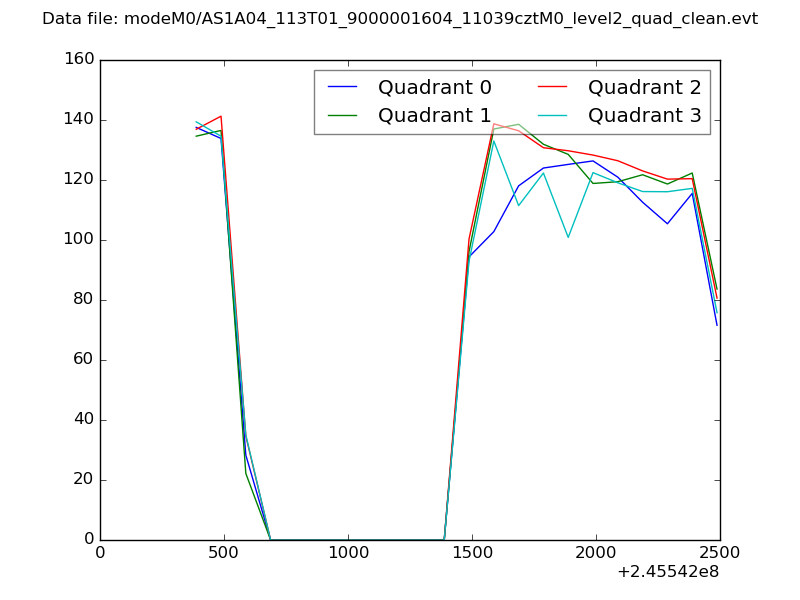 |
|
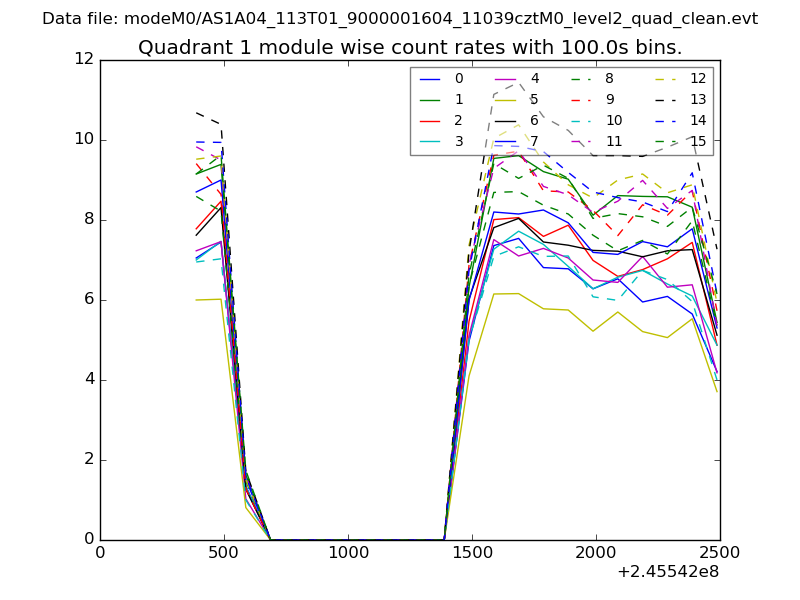
| Module-wise count rates for Quadrant A Data is divided into 100 sec bins |
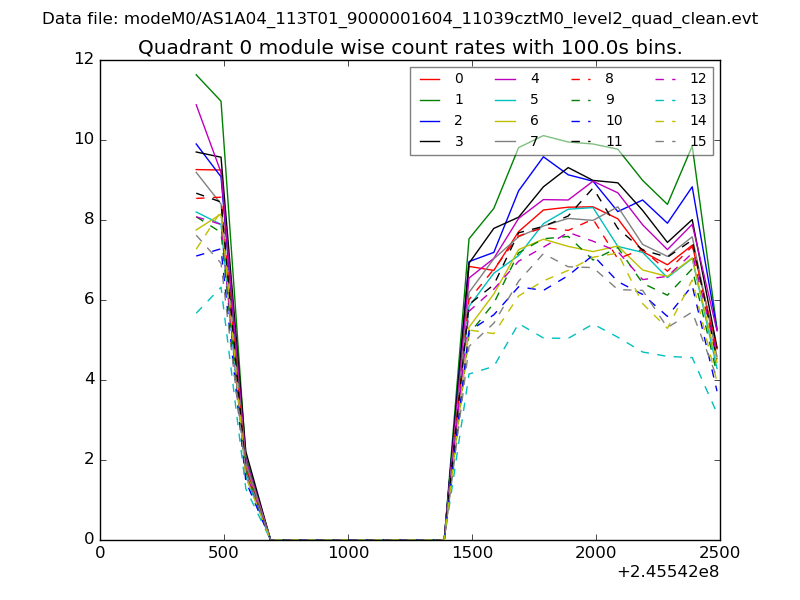 |
 |
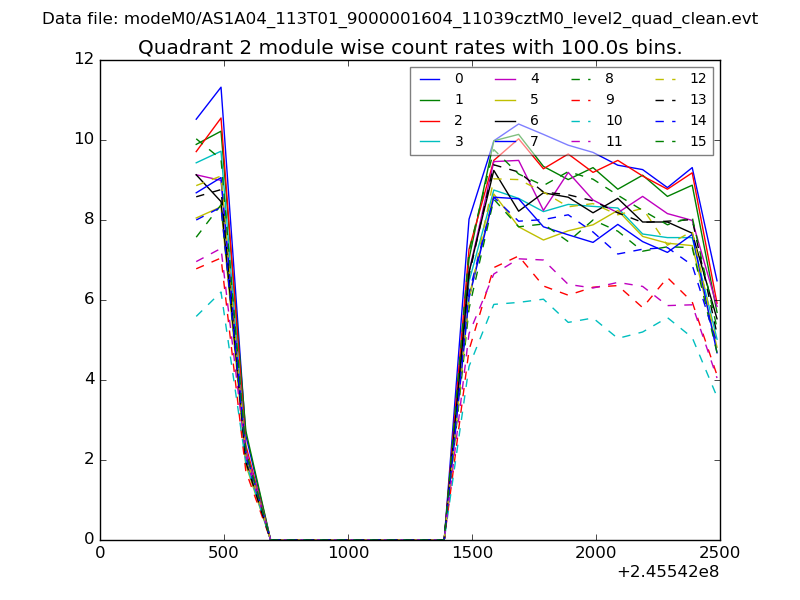
| Module-wise count rates for Quadrant B Data is divided into 100 sec bins |
 |
 |
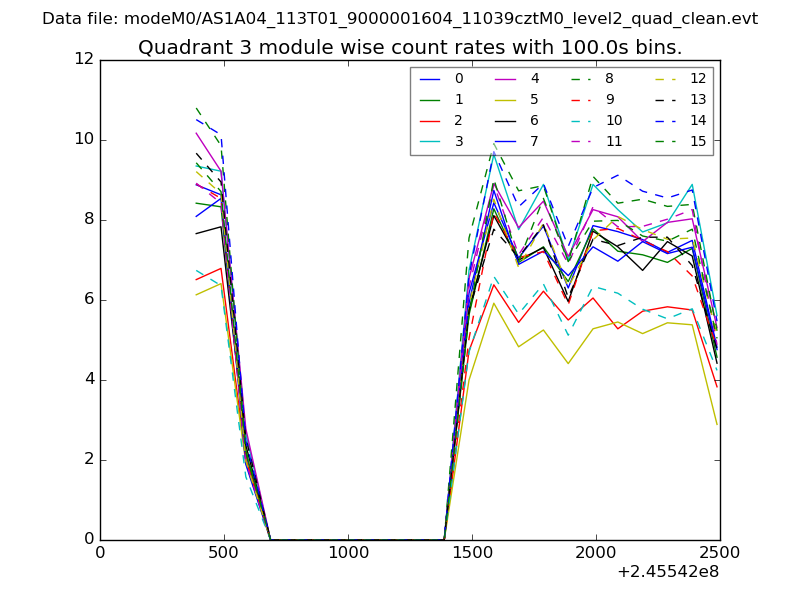
| Module-wise count rates for Quadrant C Data is divided into 100 sec bins |
 |
 |
| Module-wise count rates for Quadrant D Data is divided into 100 sec bins |
 |
 |
| Parameter | Plot |
|---|---|
| CZT HV Monitor | 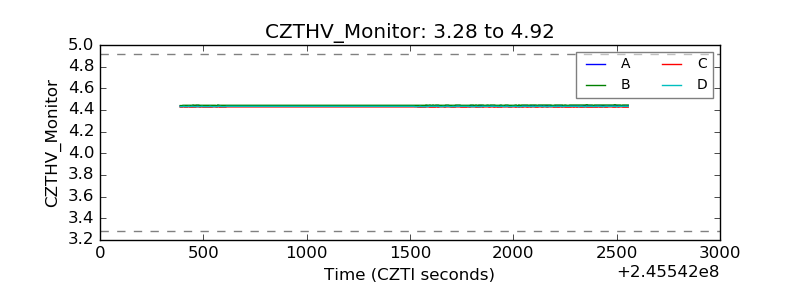 |
| D_VDD | 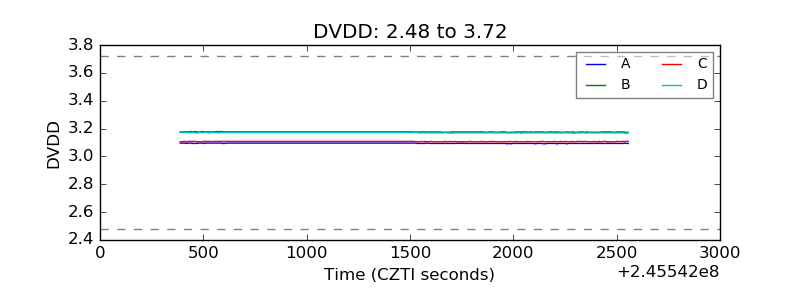 |
| Temperature 1 | 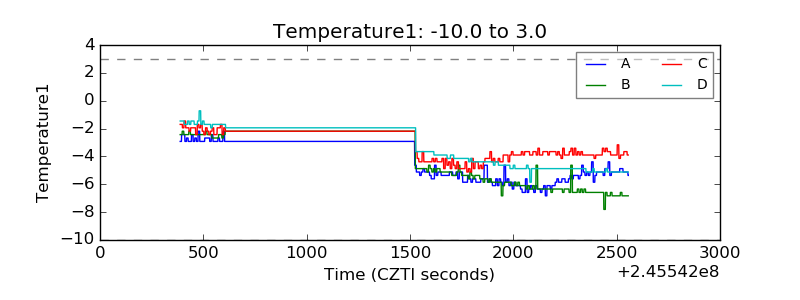 |
| Veto HV Monitor | 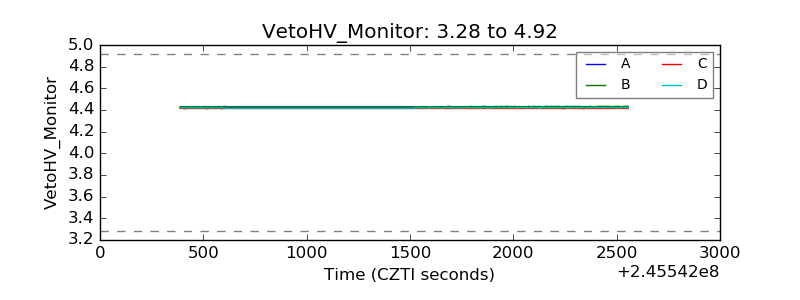 |
| Veto LLD | 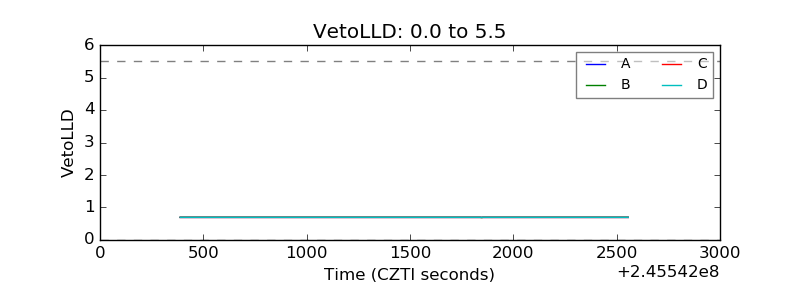 |
| Alpha Counter | 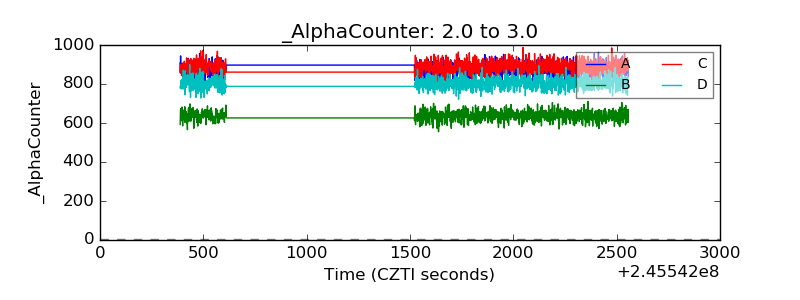 |
| _CPM_Rate | 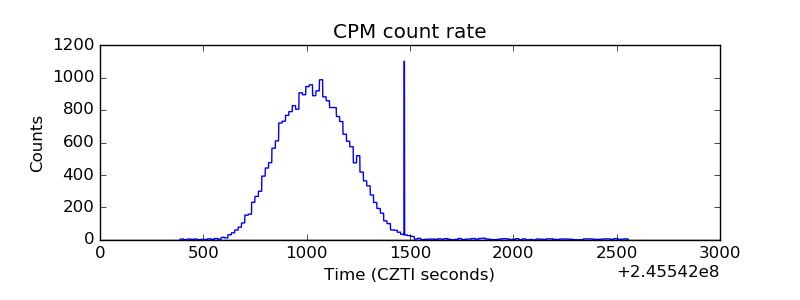 |
| CZT Counter | 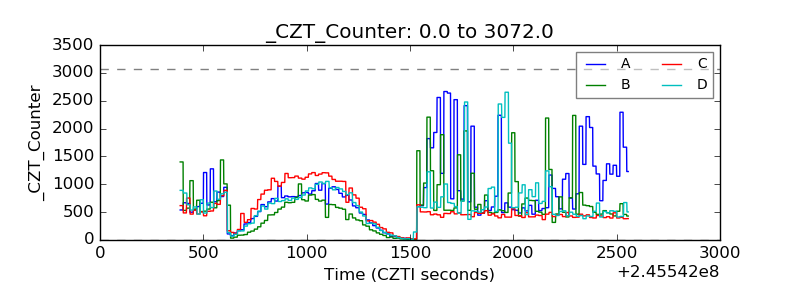 |
| +2.5 Volts monitor |  |
| +5 Volts monitor |  |
| _ROLL_ROT | 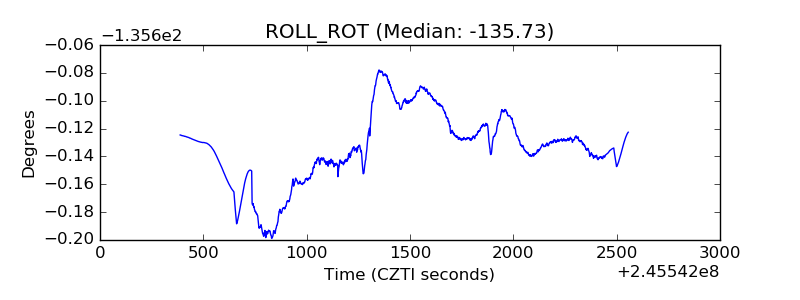 |
| _Roll_DEC | 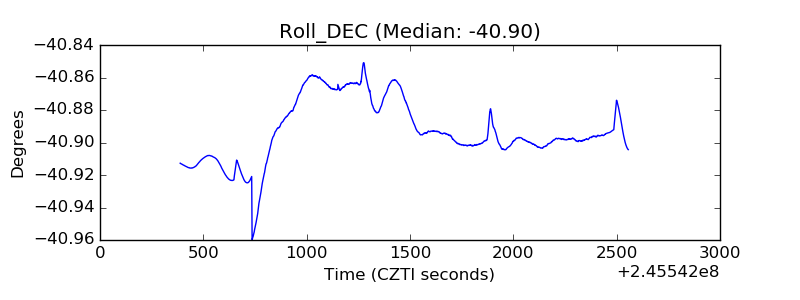 |
| _Roll_RA | 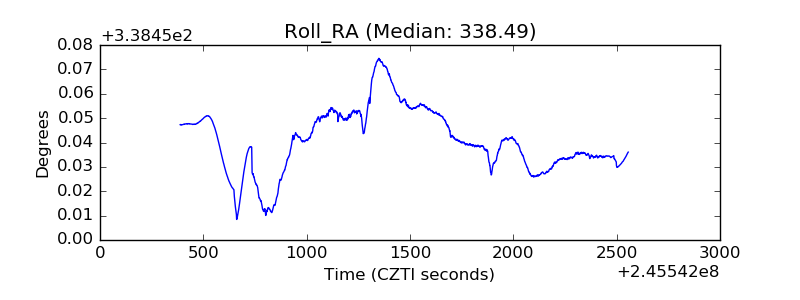 |
| Veto Counter | 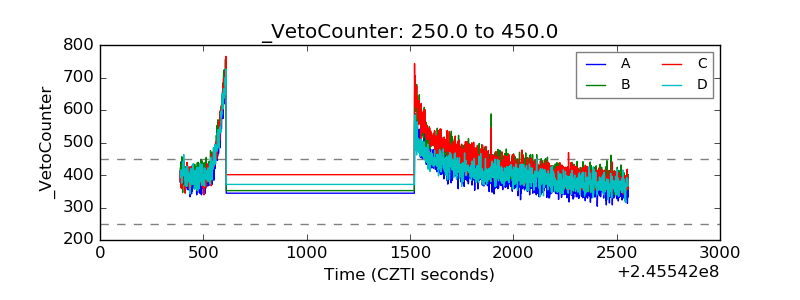 |