| Param | Original file | Final file |
|---|---|---|
| Filename | modeM0/AS1A04_113T02_9000001606cztM0_level2.fits | modeM0/AS1A04_113T02_9000001606cztM0_level2_quad_clean.evt |
| Size (bytes) | 467,035,200 | 427,746,240 |
| Size | 445.4 MB | 407.9 MB |
| Events in quadrant A | 2,500,110 | 2,033,755 |
| Events in quadrant B | 2,792,671 | 2,574,375 |
| Events in quadrant C | 2,942,718 | 2,593,208 |
| Events in quadrant D | 2,501,600 | 2,352,526 |
| Mode SS | |||
|---|---|---|---|
| Quadrant | BADHDUFLAG | Total packets | Discarded packets |
| A | 0 | 1010 | 0 |
| B | 0 | 1012 | 0 |
| C | 0 | 1010 | 0 |
| D | 0 | 1012 | 0 |
| Mode M0 | |||
|---|---|---|---|
| Quadrant | BADHDUFLAG | Total packets | Discarded packets |
| A | 0 | 232156 | 0 |
| B | 0 | 128334 | 0 |
| C | 0 | 102405 | 0 |
| D | 0 | 126768 | 0 |
| Mode M9 | |||
|---|---|---|---|
| Quadrant | BADHDUFLAG | Total packets | Discarded packets |
| A | 0 | 83 | 0 |
| B | 0 | 83 | 0 |
| C | 0 | 83 | 0 |
| D | 0 | 83 | 0 |
| Quadrant | Total seconds | Saturated seconds | Saturation percentage |
|---|---|---|---|
| A | 49504 | 14085 | 28.452246% |
| B | 49528 | 2855 | 5.764416% |
| C | 49542 | 517 | 1.043559% |
| D | 49514 | 1560 | 3.150624% |
Noise dominated data is calculated using 1-second bins in cleaned event files. If a bin has >2000 counts, and if more than 50% of those come from <1% of pixels, then it is considered to be noise-dominated and hence unusable.
| Quadrant | # 1 sec bins | Bins with >0 counts | Bins with >2000 counts | High rate bins dominated by noise | Noise dominated (total time) | Noise dominated (detector-on time) | Marked lightcurve |
|---|---|---|---|---|---|---|---|
| A | 58114 | 49416 | 0 | 0 | 0.00% | 0.00% | 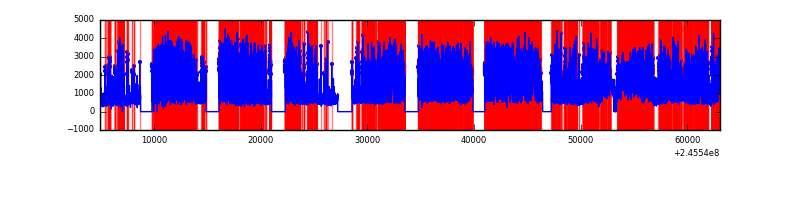 |
| B | 58115 | 49623 | 0 | 0 | 0.00% | 0.00% | 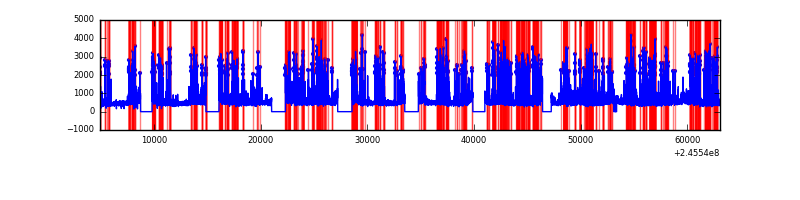 |
| C | 58115 | 49634 | 0 | 0 | 0.00% | 0.00% | 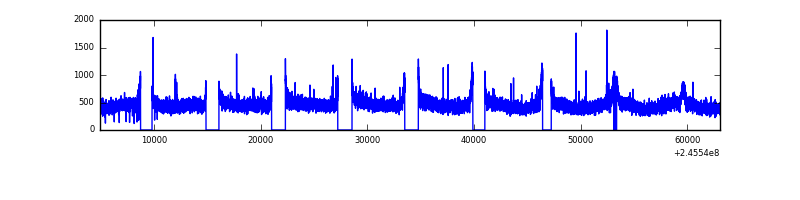 |
| D | 58115 | 49553 | 0 | 0 | 0.00% | 0.00% | 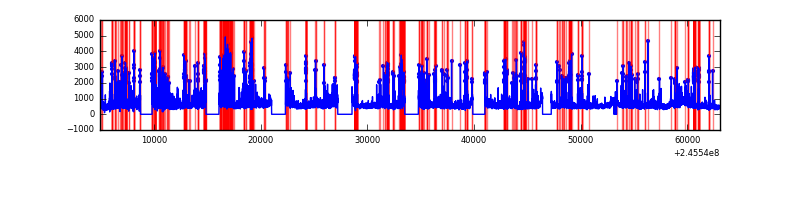 |
Top three noisy pixels from each quadrant. If the there are fewer than three noisy pixels in the level2.evt file, extra rows are filled as -1
| Pixel properties | Quadrant properties | ||||||
|---|---|---|---|---|---|---|---|
| Quadrant | DetID | PixID | Counts | Sigma | Mean | Median | Sigma |
| A | 14 | 188 | 2452 | 11.36 | 649 | 608 | 162.3 |
| A | 0 | 29 | 2303 | 10.44 | 649 | 608 | 162.3 |
| A | 7 | 110 | 2050 | 8.88 | 649 | 608 | 162.3 |
| B | 2 | 9 | 2509 | 12.33 | 736 | 703 | 146.4 |
| B | 3 | 17 | 1904 | 8.2 | 736 | 703 | 146.4 |
| B | 2 | 8 | 1887 | 8.09 | 736 | 703 | 146.4 |
| C | 1 | 81 | 2099 | 6.81 | 777 | 725 | 201.7 |
| C | 1 | 80 | 2062 | 6.63 | 777 | 725 | 201.7 |
| C | 12 | 241 | 2007 | 6.36 | 777 | 725 | 201.7 |
| D | 6 | 231 | 1915 | 6.65 | 714 | 653 | 189.9 |
| D | 3 | 14 | 1900 | 6.57 | 714 | 653 | 189.9 |
| D | 10 | 189 | 1779 | 5.93 | 714 | 653 | 189.9 |
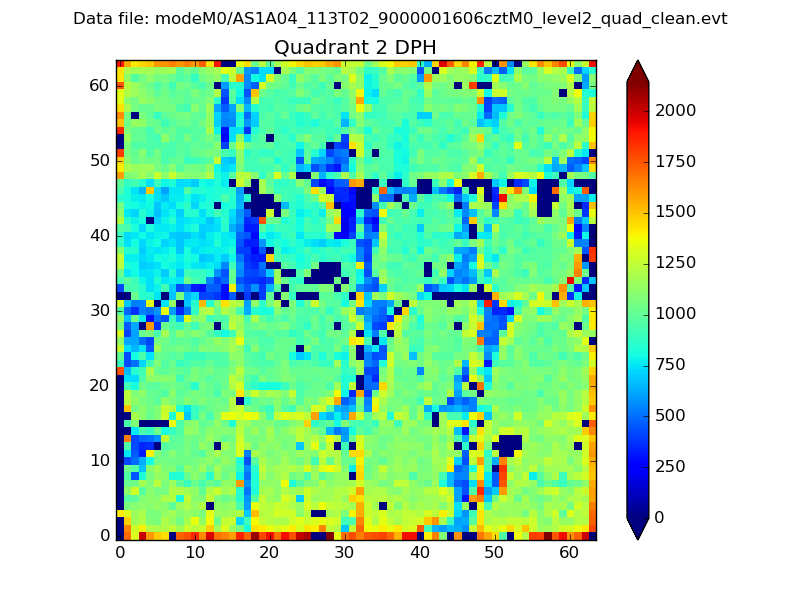
Histogram calculated using DETX and DETY for each event in the final _common_clean file
| Quadrant A | 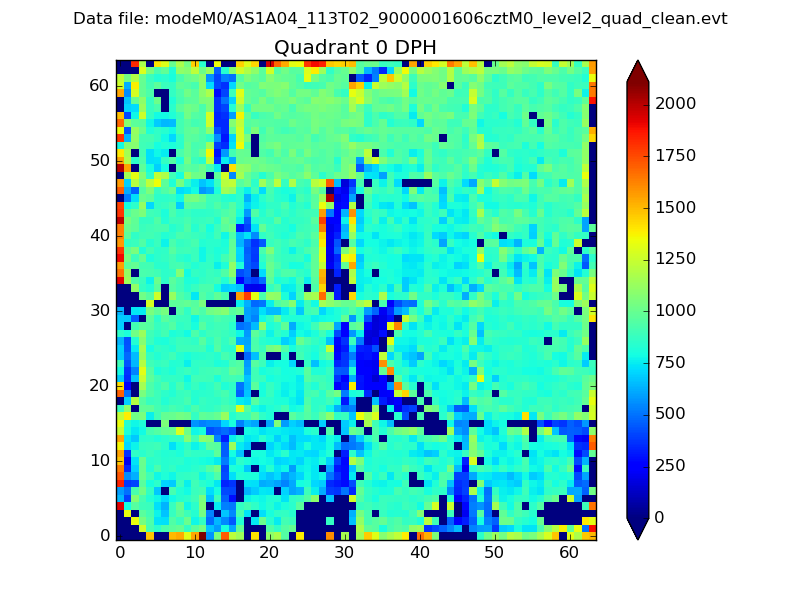 |
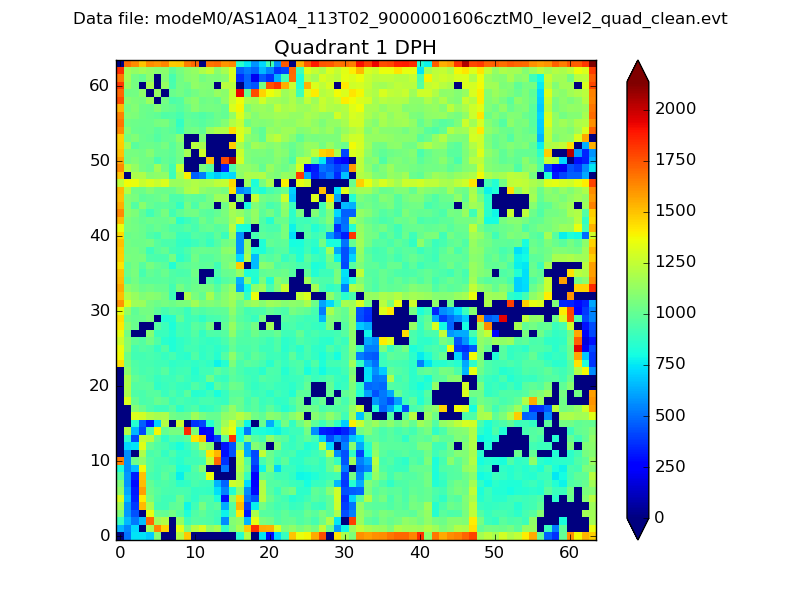 |
Quadrant B |
|---|---|---|---|
| Quadrant D | 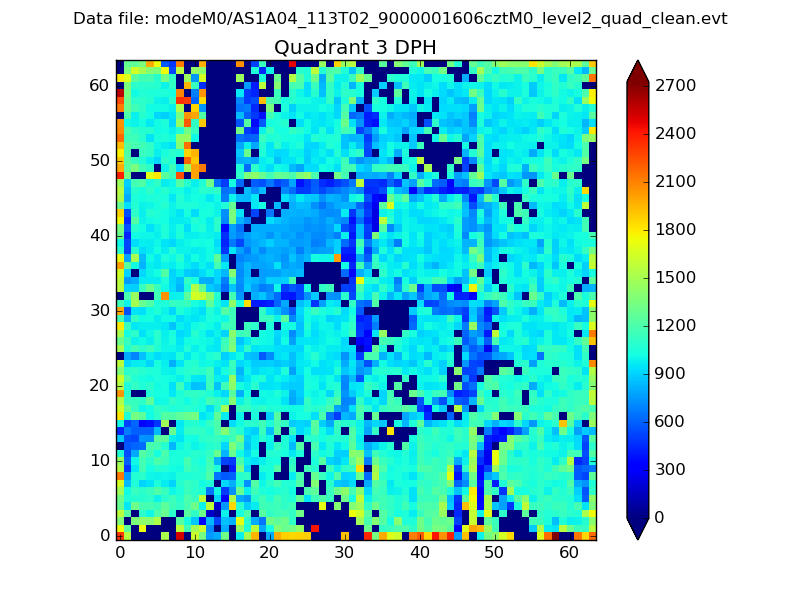 |
 |
Quadrant C |
| Plot type | Count rate plots | Images |
|---|---|---|
| Comparison with Poisson distribution Blue bars denote a histogram of data divided into 1 sec bins. Red curve is a Poisson curve with rate = median count rate of data. |
 |
 |
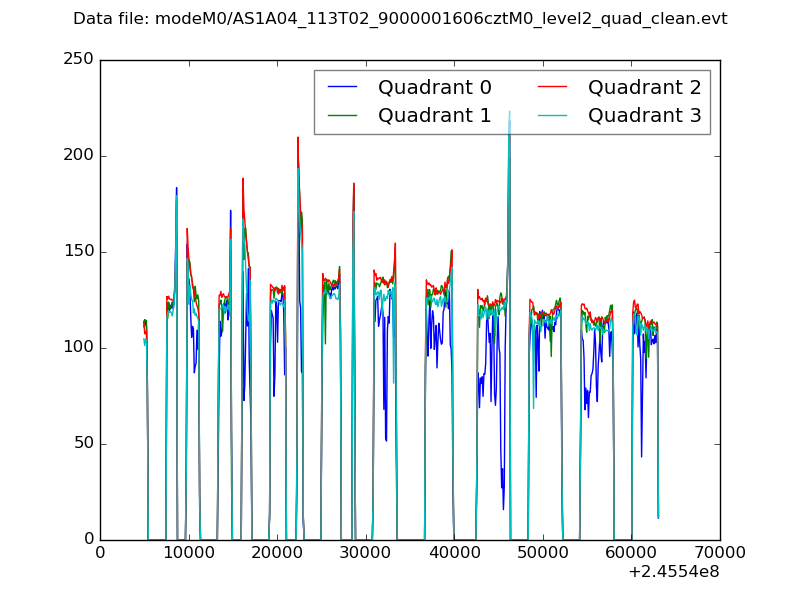
| Quadrant-wise count rates Data is divided into 100 sec bins |
 |
|
| Module-wise count rates for Quadrant A Data is divided into 100 sec bins |
 |
 |
| Module-wise count rates for Quadrant B Data is divided into 100 sec bins |
 |
 |
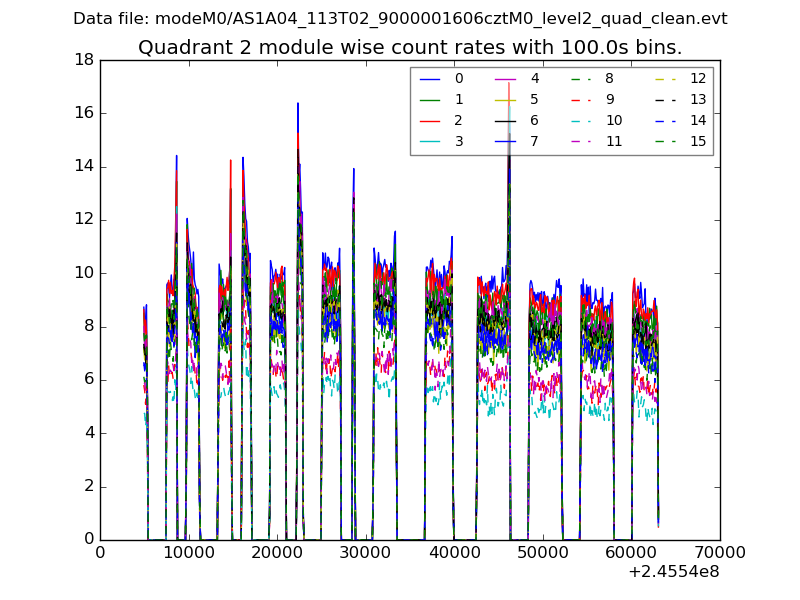
| Module-wise count rates for Quadrant C Data is divided into 100 sec bins |
 |
 |
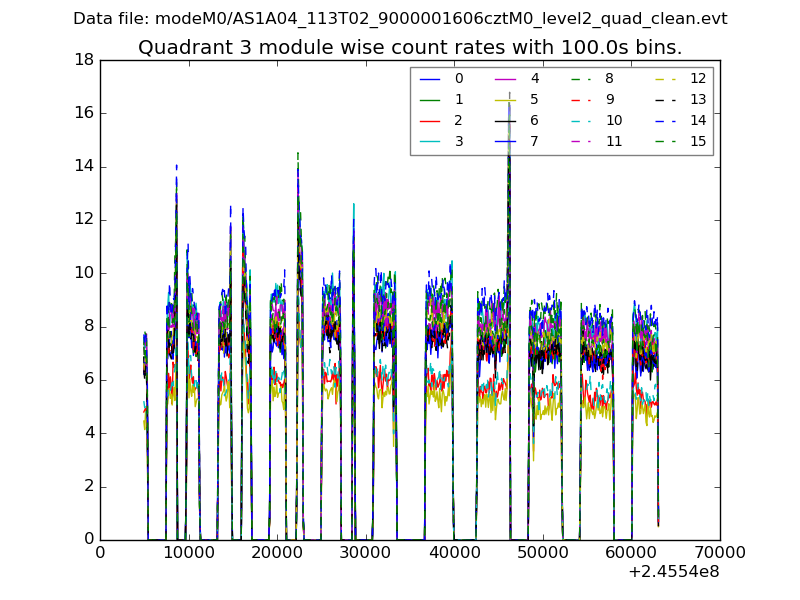
| Module-wise count rates for Quadrant D Data is divided into 100 sec bins |
 |
 |
| Parameter | Plot |
|---|---|
| CZT HV Monitor |  |
| D_VDD | 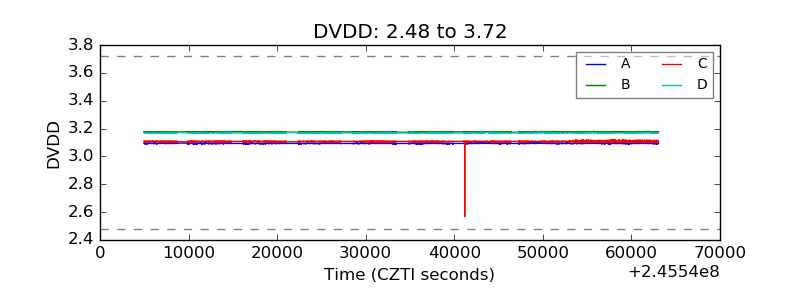 |
| Temperature 1 |  |
| Veto HV Monitor |  |
| Veto LLD | 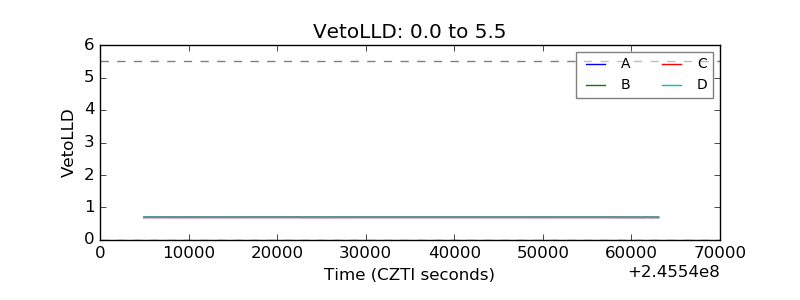 |
| Alpha Counter | 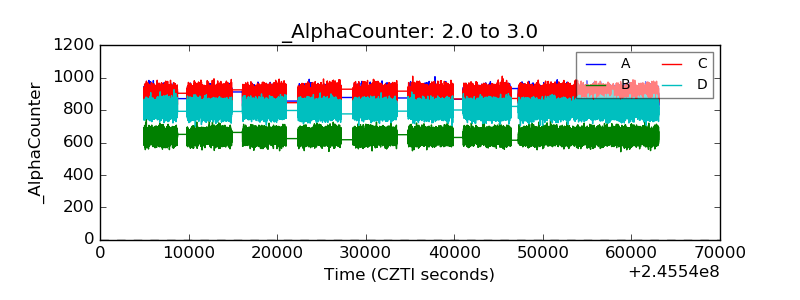 |
| _CPM_Rate | 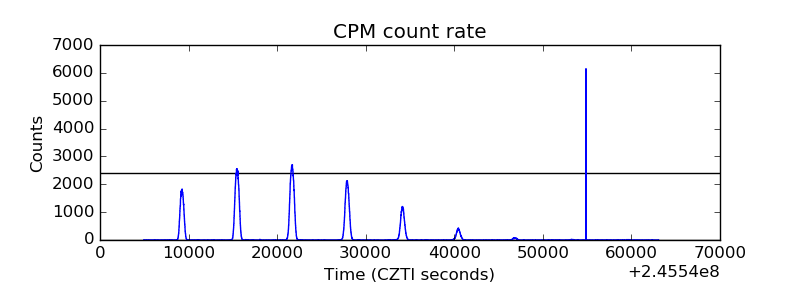 |
| CZT Counter | 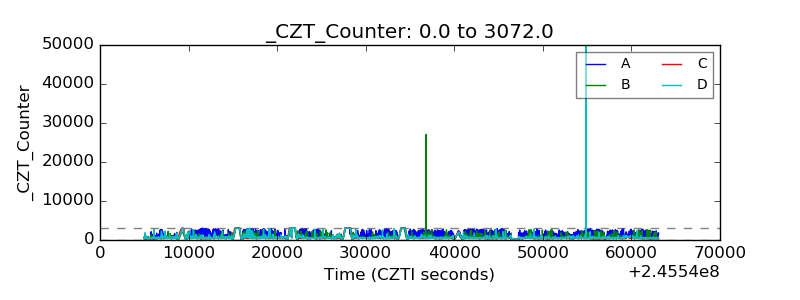 |
| +2.5 Volts monitor |  |
| +5 Volts monitor | 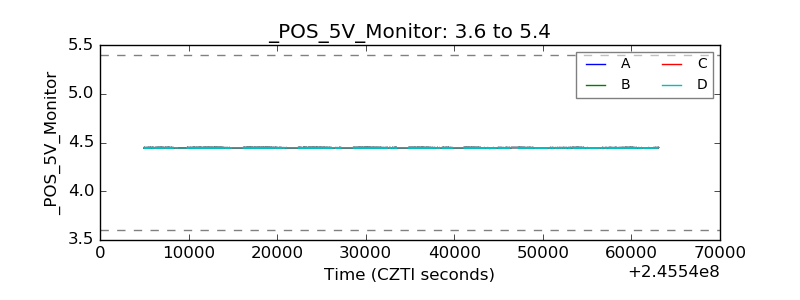 |
| _ROLL_ROT | 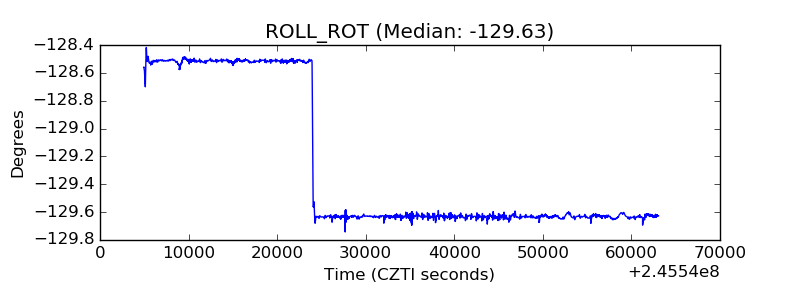 |
| _Roll_DEC | 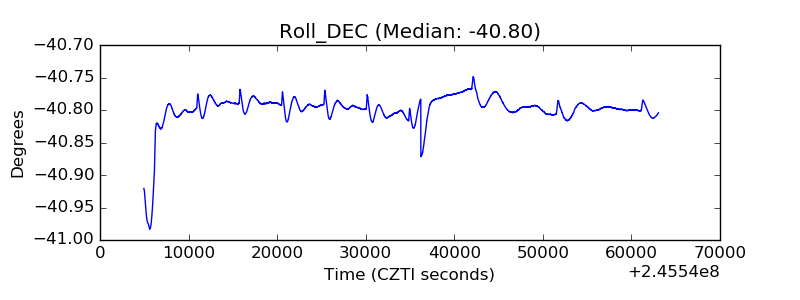 |
| _Roll_RA | 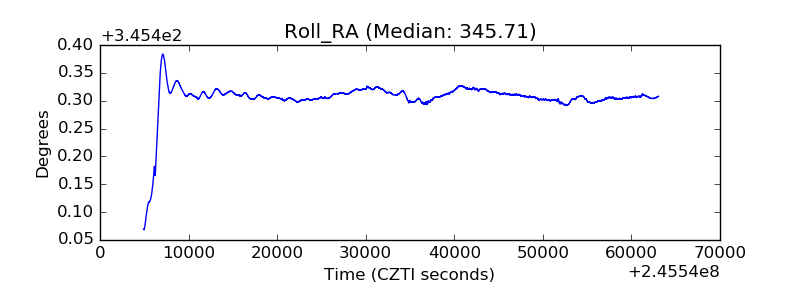 |
| Veto Counter | 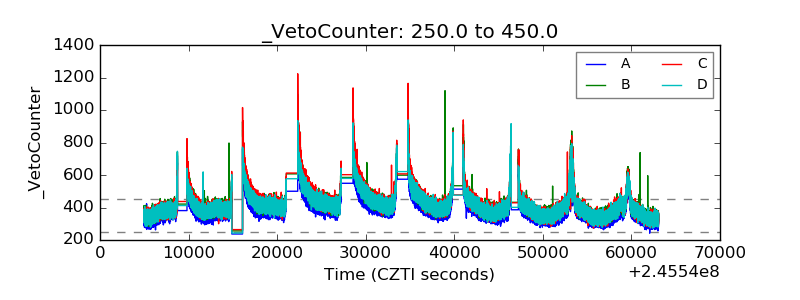 |