| Param | Original file | Final file |
|---|---|---|
| Filename | modeM0/AS1A04_113T02_9000001606_11039cztM0_level2.evt | modeM0/AS1A04_113T02_9000001606_11039cztM0_level2_quad_clean.evt |
| Size (bytes) | 470,249,280 | 63,391,680 |
| Size | 448.5 MB | 60.5 MB |
| Events in quadrant A | 5,138,759 | 372,214 |
| Events in quadrant B | 3,017,269 | 399,118 |
| Events in quadrant C | 2,326,079 | 403,323 |
| Events in quadrant D | 3,405,996 | 379,763 |
| Mode SS | |||
|---|---|---|---|
| Quadrant | BADHDUFLAG | Total packets | Discarded packets |
| A | 0 | 106 | 0 |
| B | 0 | 106 | 0 |
| C | 0 | 106 | 0 |
| D | 0 | 106 | 0 |
| Mode M0 | |||
|---|---|---|---|
| Quadrant | BADHDUFLAG | Total packets | Discarded packets |
| A | 0 | 18874 | 71 |
| B | 0 | 12502 | 28 |
| C | 0 | 10563 | 23 |
| D | 0 | 13740 | 32 |
| Mode M9 | |||
|---|---|---|---|
| Quadrant | BADHDUFLAG | Total packets | Discarded packets |
| A | 0 | 11 | 0 |
| B | 0 | 11 | 0 |
| C | 0 | 11 | 0 |
| D | 0 | 11 | 0 |
| Quadrant | Total seconds | Saturated seconds | Saturation percentage |
|---|---|---|---|
| A | 5203 | 810 | 15.567942% |
| B | 5205 | 175 | 3.362152% |
| C | 5206 | 10 | 0.192086% |
| D | 5206 | 120 | 2.305033% |
Noise dominated data is calculated using 1-second bins in cleaned event files. If a bin has >2000 counts, and if more than 50% of those come from <1% of pixels, then it is considered to be noise-dominated and hence unusable.
| Quadrant | # 1 sec bins | Bins with >0 counts | Bins with >2000 counts | High rate bins dominated by noise | Noise dominated (total time) | Noise dominated (detector-on time) | Marked lightcurve |
|---|---|---|---|---|---|---|---|
| A | 6297 | 5215 | 691 | 691 | 10.97% | 13.25% | 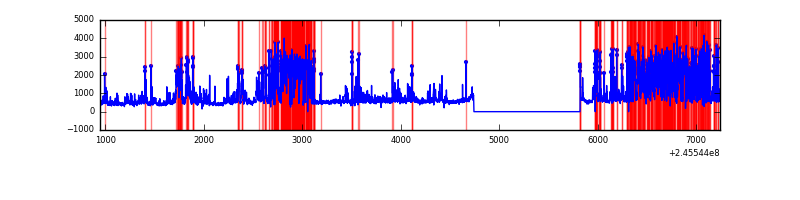 |
| B | 6298 | 5219 | 106 | 106 | 1.68% | 2.03% | 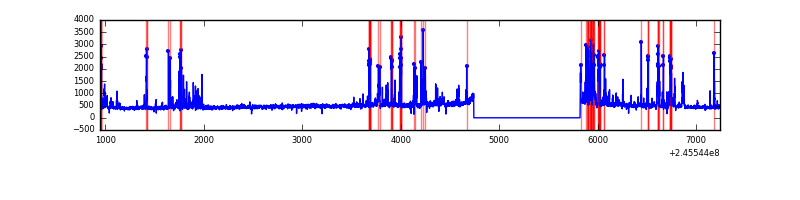 |
| C | 6298 | 5219 | 0 | 0 | 0.00% | 0.00% | 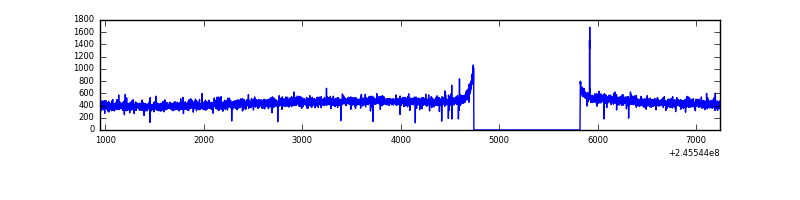 |
| D | 6298 | 5219 | 93 | 93 | 1.48% | 1.78% |  |
Top three noisy pixels from each quadrant. If the there are fewer than three noisy pixels in the level2.evt file, extra rows are filled as -1
| Pixel properties | Quadrant properties | ||||||
|---|---|---|---|---|---|---|---|
| Quadrant | DetID | PixID | Counts | Sigma | Mean | Median | Sigma |
| A | 8 | 5 | 1802312 | 15423.41 | 568 | 556 | 116.8 |
| A | 14 | 238 | 1121460 | 9595.17 | 568 | 556 | 116.8 |
| A | 14 | 254 | 12397 | 101.36 | 568 | 556 | 116.8 |
| B | 4 | 239 | 611092 | 5248.98 | 605 | 589 | 116.3 |
| B | 11 | 51 | 20541 | 171.54 | 605 | 589 | 116.3 |
| B | 0 | 214 | 16296 | 135.05 | 605 | 589 | 116.3 |
| C | 14 | 234 | 4780 | 30.21 | 595 | 600 | 138.3 |
| C | 13 | 61 | 4305 | 26.78 | 595 | 600 | 138.3 |
| C | 3 | 202 | 1516 | 6.62 | 595 | 600 | 138.3 |
| D | 14 | 34 | 545531 | 3845.14 | 585 | 567 | 141.7 |
| D | 11 | 129 | 207066 | 1457.01 | 585 | 567 | 141.7 |
| D | 1 | 52 | 123061 | 864.29 | 585 | 567 | 141.7 |
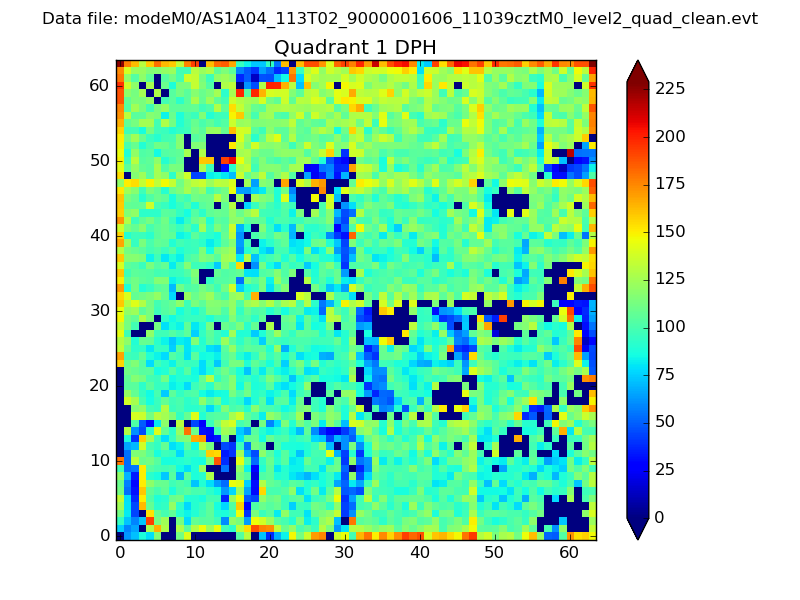
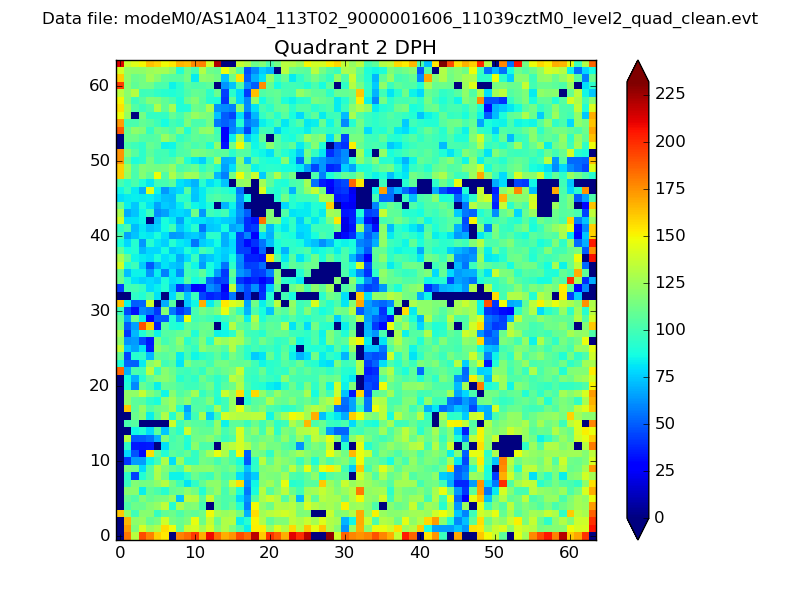
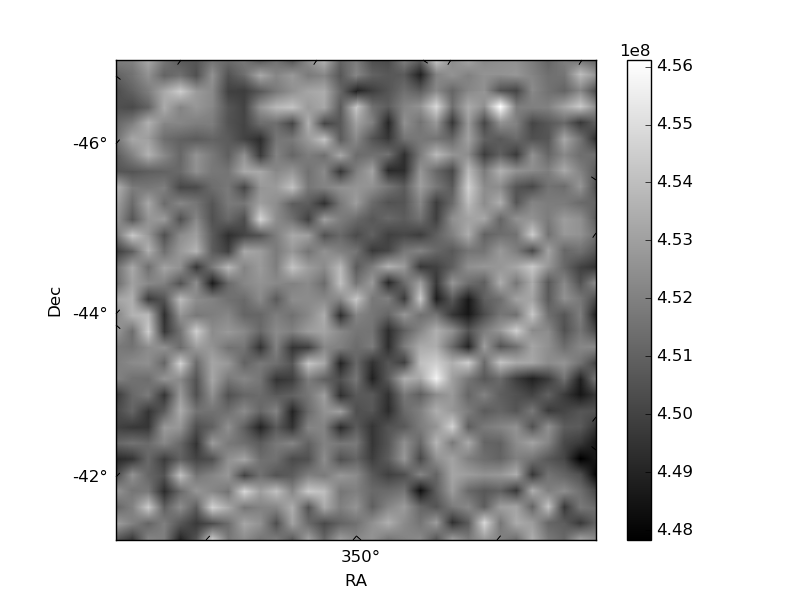
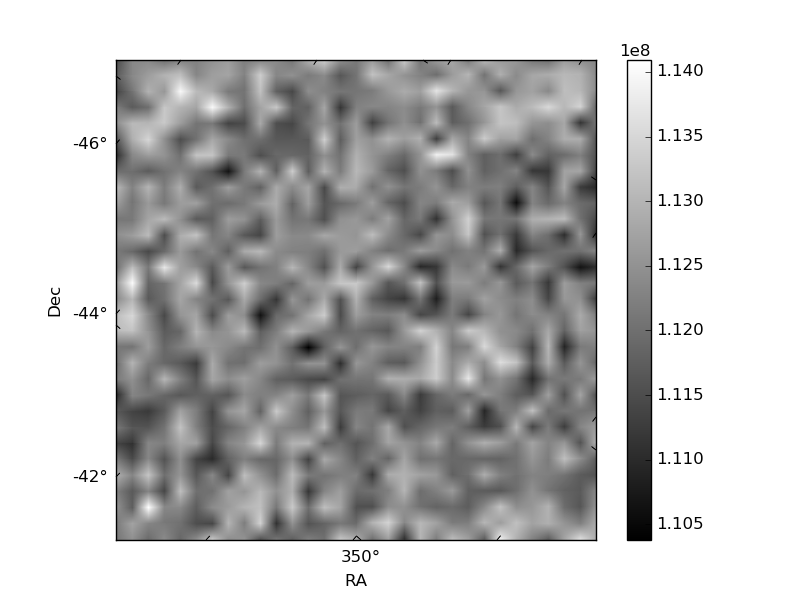
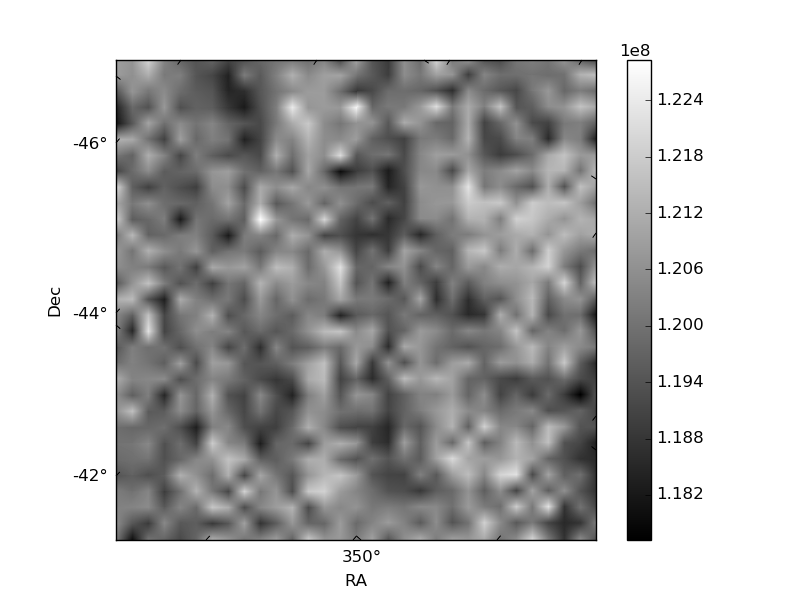
Histogram calculated using DETX and DETY for each event in the final _common_clean file
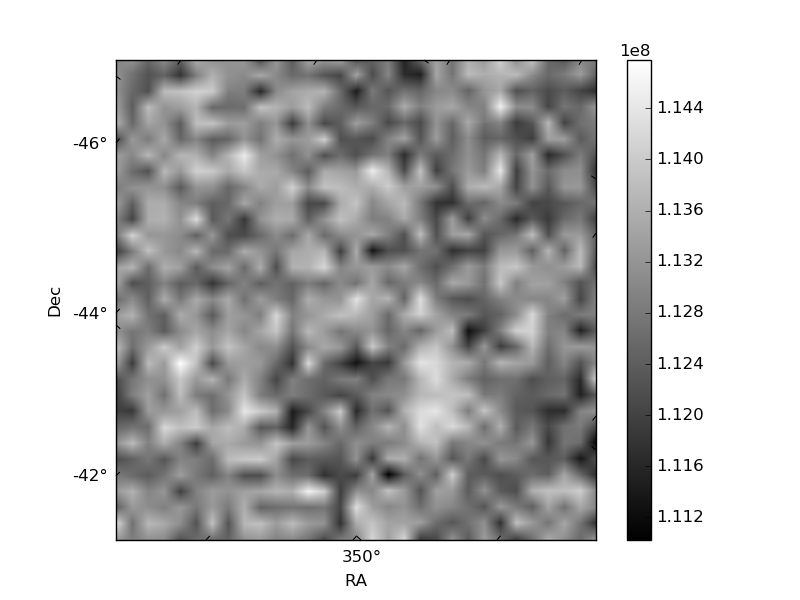
| Quadrant A | 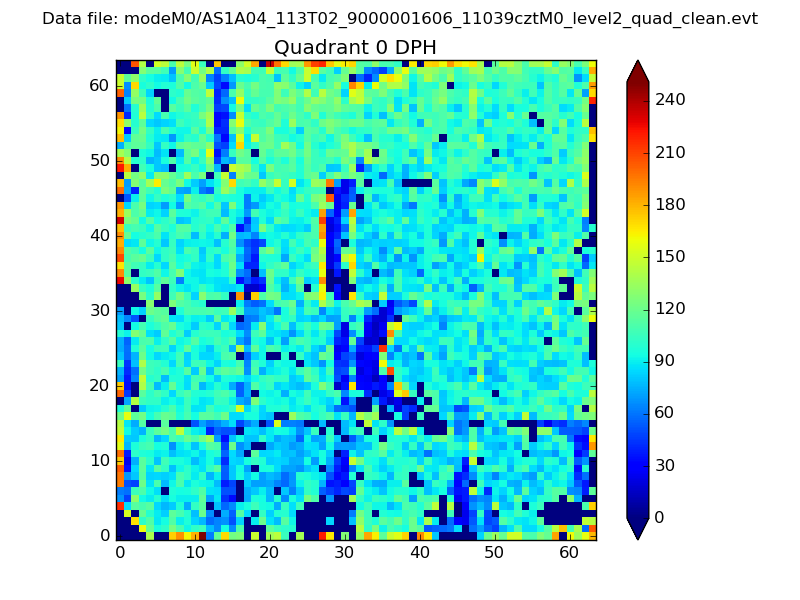 |
 |
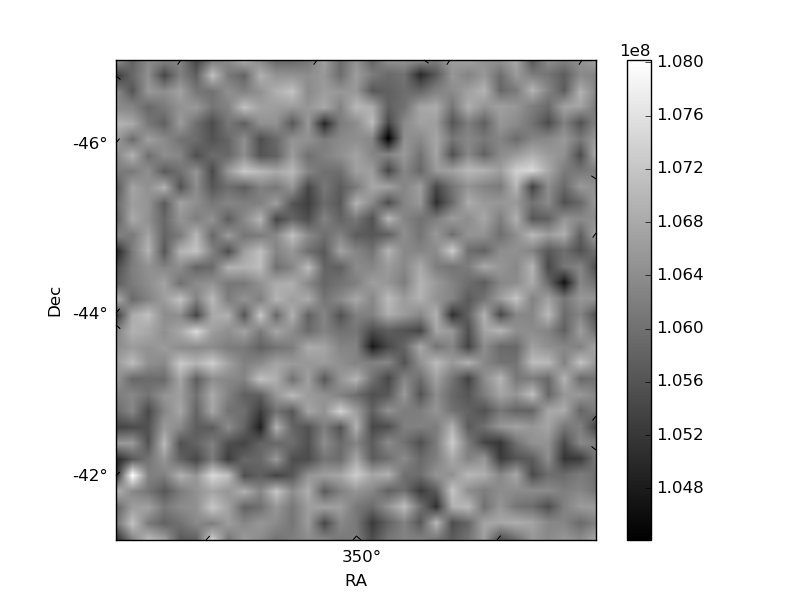
Quadrant B |
|---|---|---|---|
| Quadrant D | 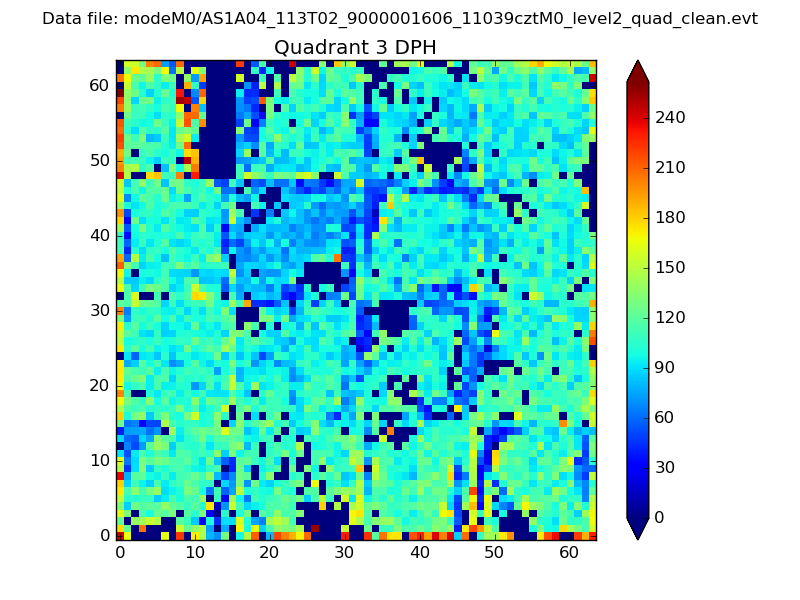 |
 |
Quadrant C |
| Plot type | Count rate plots | Images |
|---|---|---|
| Comparison with Poisson distribution Blue bars denote a histogram of data divided into 1 sec bins. Red curve is a Poisson curve with rate = median count rate of data. |
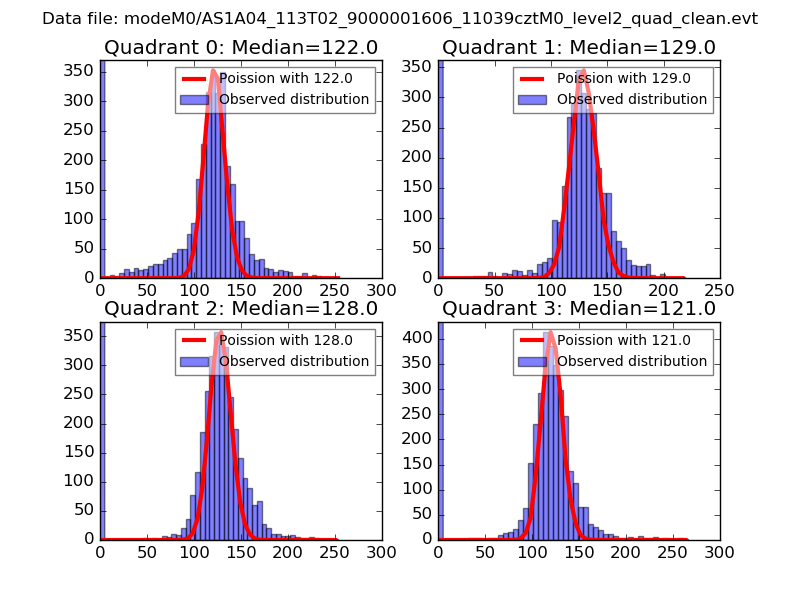 |
 |
| Quadrant-wise count rates Data is divided into 100 sec bins |
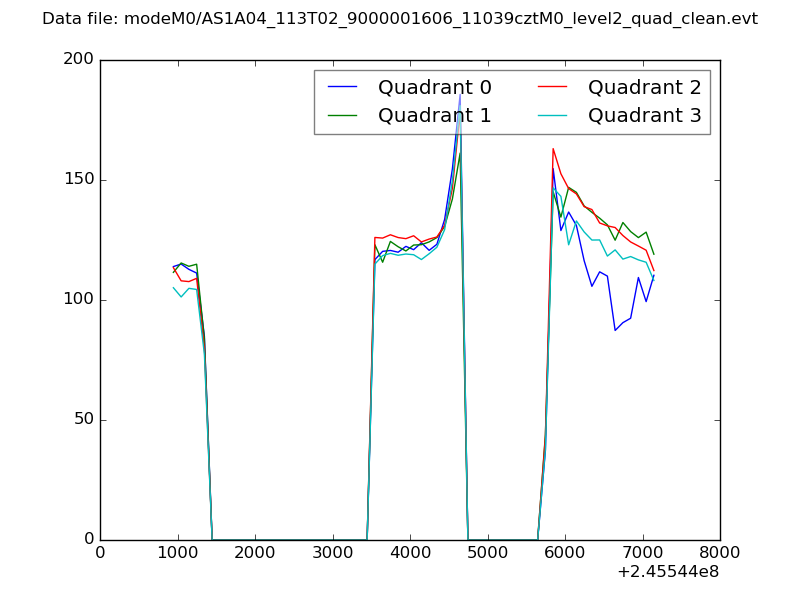 |
|
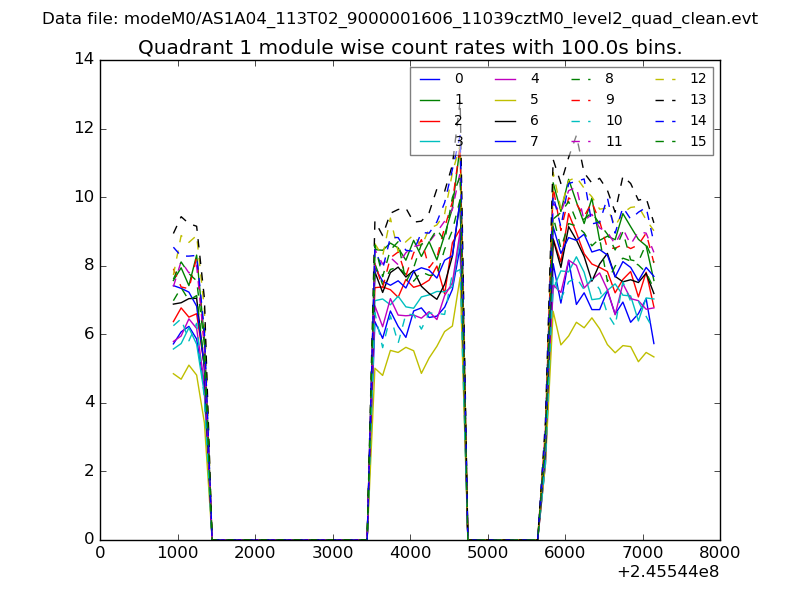
| Module-wise count rates for Quadrant A Data is divided into 100 sec bins |
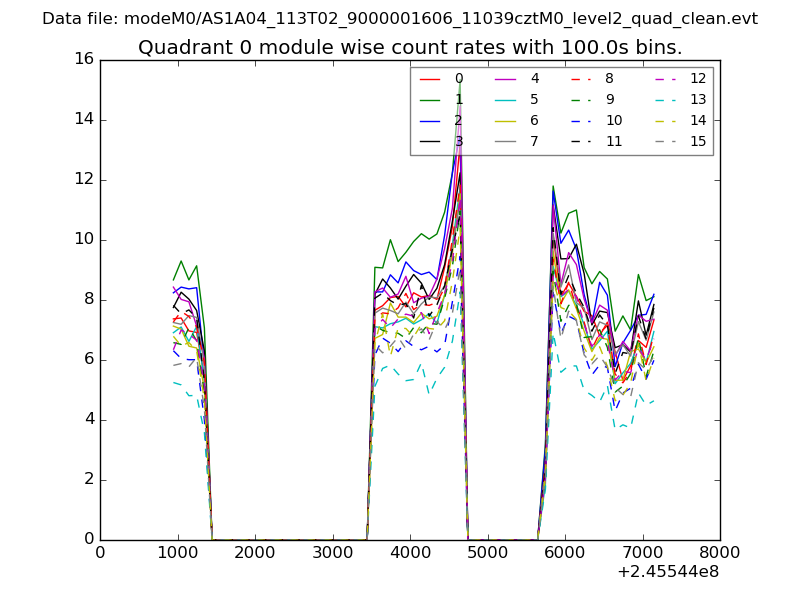 |
 |
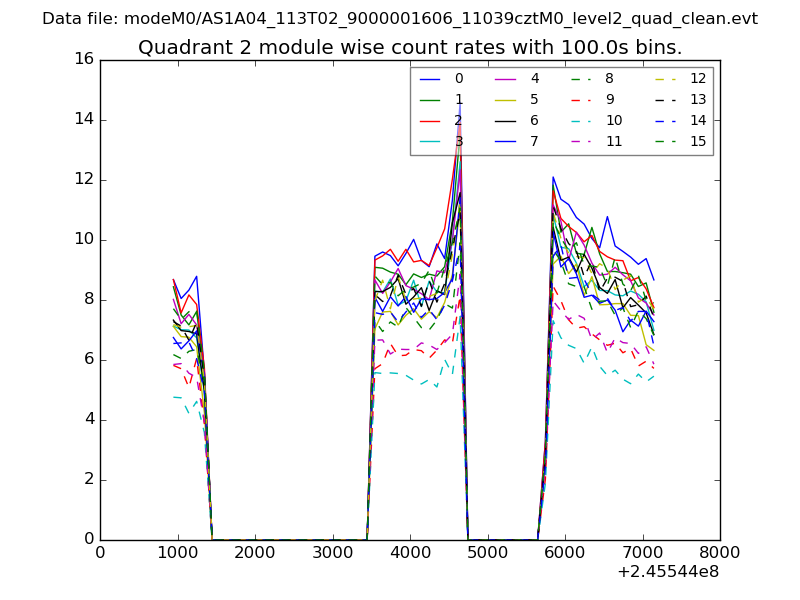
| Module-wise count rates for Quadrant B Data is divided into 100 sec bins |
 |
 |
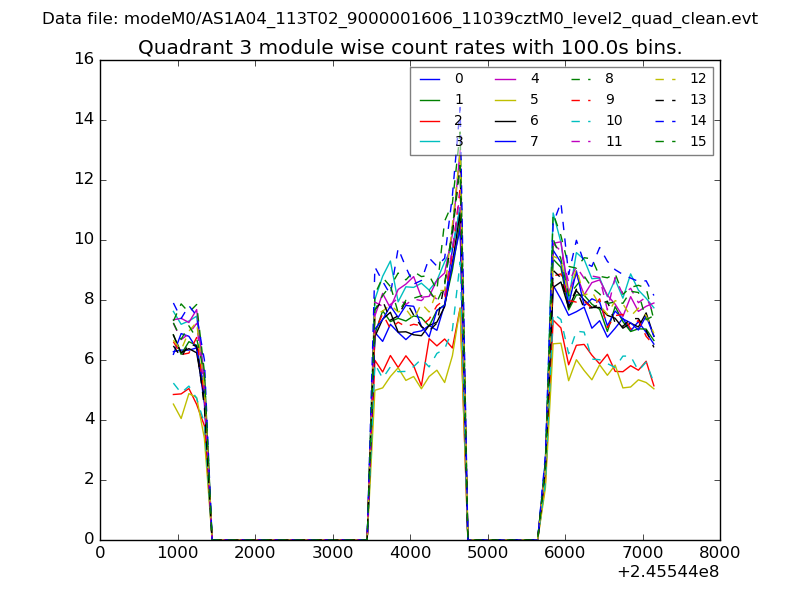
| Module-wise count rates for Quadrant C Data is divided into 100 sec bins |
 |
 |
| Module-wise count rates for Quadrant D Data is divided into 100 sec bins |
 |
 |
| Parameter | Plot |
|---|---|
| CZT HV Monitor | 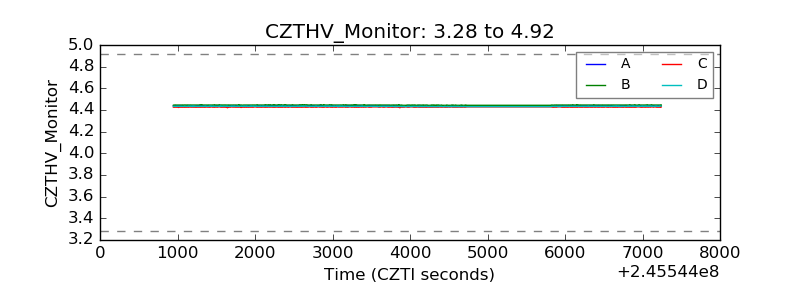 |
| D_VDD | 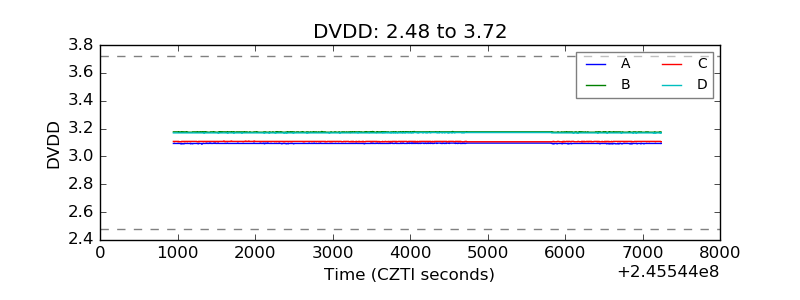 |
| Temperature 1 | 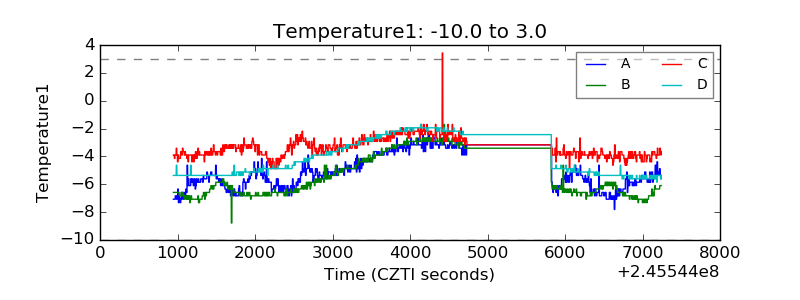 |
| Veto HV Monitor | 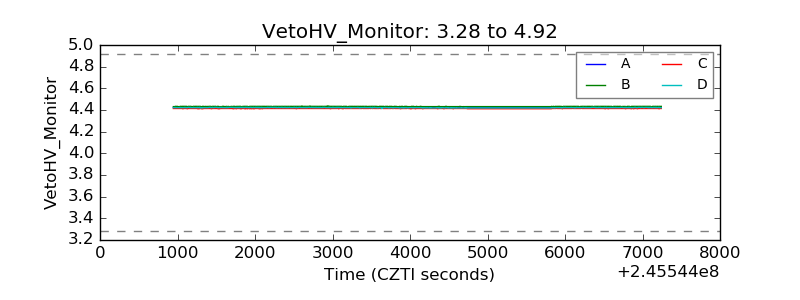 |
| Veto LLD | 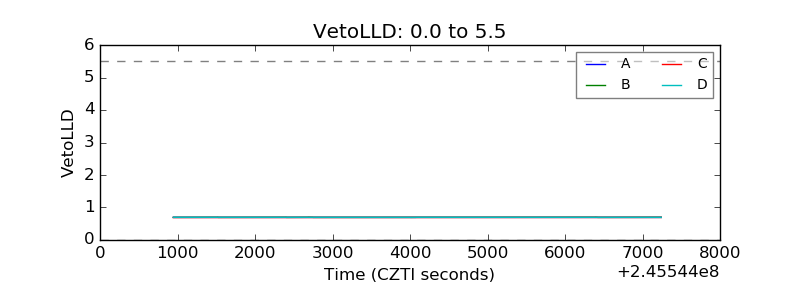 |
| Alpha Counter | 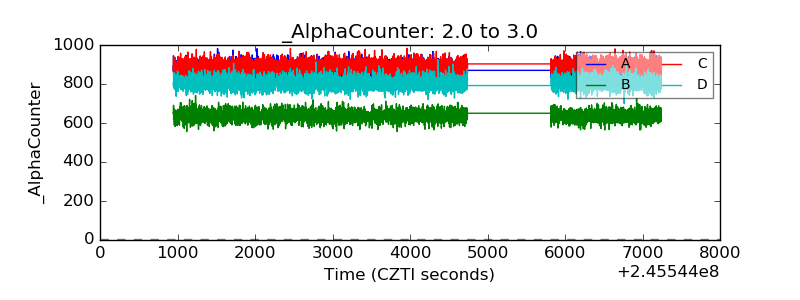 |
| _CPM_Rate | 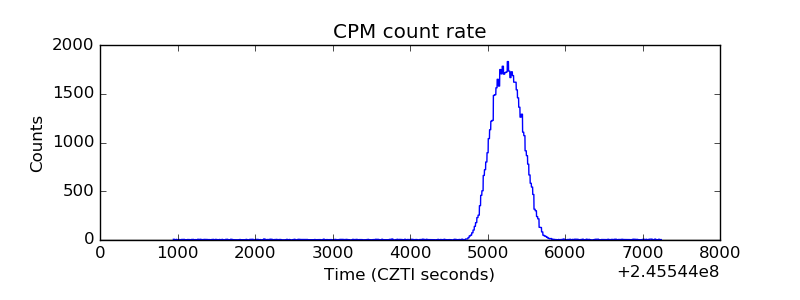 |
| CZT Counter | 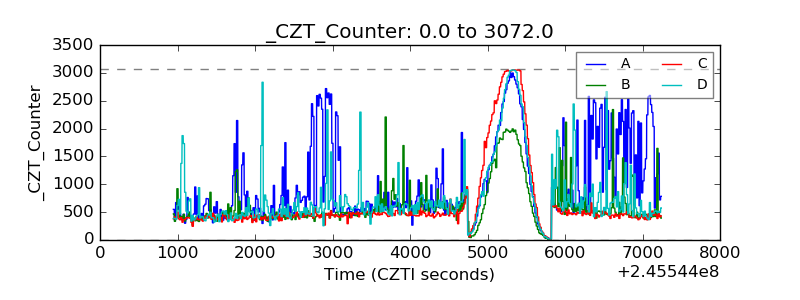 |
| +2.5 Volts monitor | 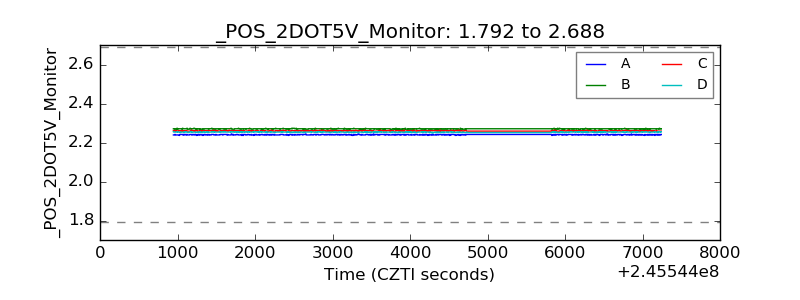 |
| +5 Volts monitor |  |
| _ROLL_ROT | 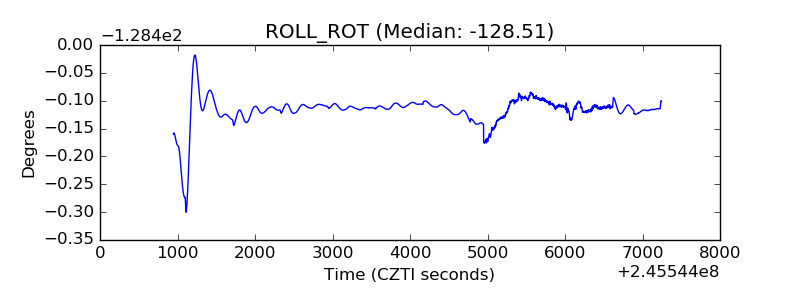 |
| _Roll_DEC | 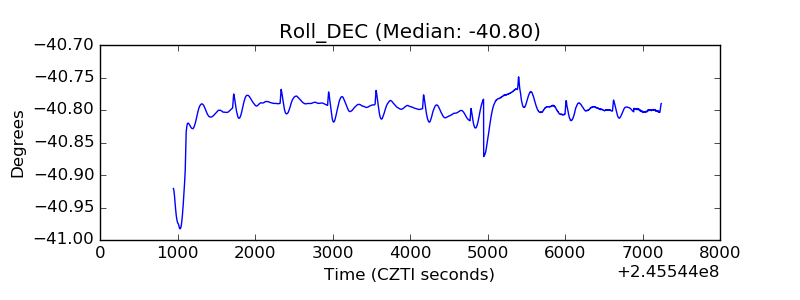 |
| _Roll_RA | 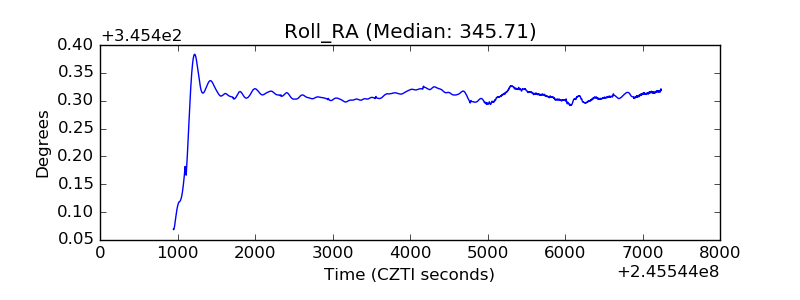 |
| Veto Counter | 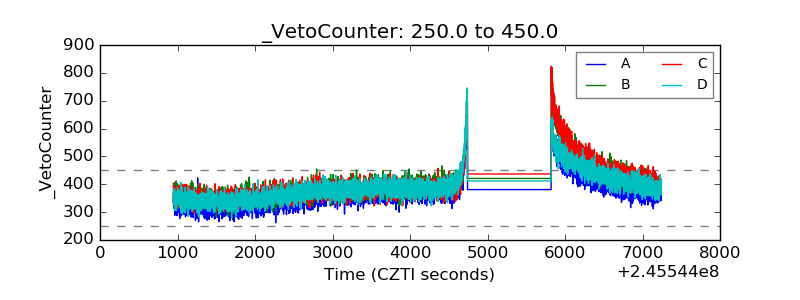 |