| Param | Original file | Final file |
|---|---|---|
| Filename | modeM0/AS1A04_113T02_9000001606_11041cztM0_level2.evt | modeM0/AS1A04_113T02_9000001606_11041cztM0_level2_quad_clean.evt |
| Size (bytes) | 731,548,800 | 82,362,240 |
| Size | 697.7 MB | 78.5 MB |
| Events in quadrant A | 10,041,035 | 452,765 |
| Events in quadrant B | 3,969,150 | 539,068 |
| Events in quadrant C | 2,934,052 | 552,845 |
| Events in quadrant D | 4,785,315 | 509,064 |
| Mode SS | |||
|---|---|---|---|
| Quadrant | BADHDUFLAG | Total packets | Discarded packets |
| A | 0 | 128 | 0 |
| B | 0 | 128 | 0 |
| C | 0 | 128 | 0 |
| D | 0 | 128 | 0 |
| Mode M0 | |||
|---|---|---|---|
| Quadrant | BADHDUFLAG | Total packets | Discarded packets |
| A | 0 | 34260 | 4 |
| B | 0 | 15889 | 2 |
| C | 0 | 12881 | 2 |
| D | 0 | 18396 | 2 |
| Mode M9 | |||
|---|---|---|---|
| Quadrant | BADHDUFLAG | Total packets | Discarded packets |
| A | 0 | 20 | 0 |
| B | 0 | 20 | 0 |
| C | 0 | 20 | 0 |
| D | 0 | 20 | 0 |
| Quadrant | Total seconds | Saturated seconds | Saturation percentage |
|---|---|---|---|
| A | 6299 | 2459 | 39.037943% |
| B | 6299 | 280 | 4.445150% |
| C | 6299 | 6 | 0.095253% |
| D | 6299 | 277 | 4.397523% |
Noise dominated data is calculated using 1-second bins in cleaned event files. If a bin has >2000 counts, and if more than 50% of those come from <1% of pixels, then it is considered to be noise-dominated and hence unusable.
| Quadrant | # 1 sec bins | Bins with >0 counts | Bins with >2000 counts | High rate bins dominated by noise | Noise dominated (total time) | Noise dominated (detector-on time) | Marked lightcurve |
|---|---|---|---|---|---|---|---|
| A | 7520 | 6300 | 2121 | 2121 | 28.20% | 33.67% | 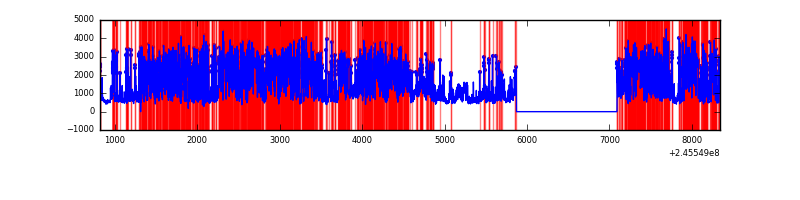 |
| B | 7520 | 6301 | 170 | 170 | 2.26% | 2.70% | 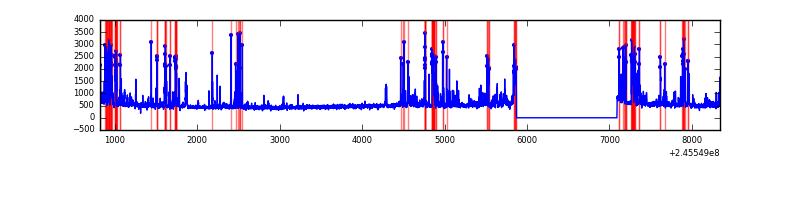 |
| C | 7520 | 6301 | 0 | 0 | 0.00% | 0.00% | 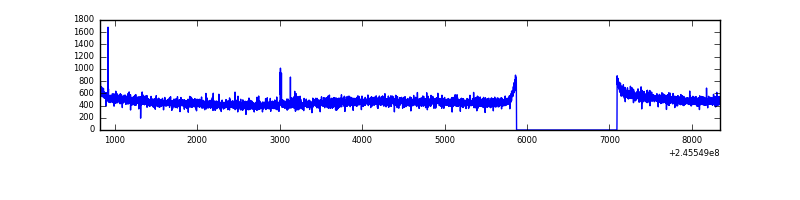 |
| D | 7520 | 6301 | 277 | 277 | 3.68% | 4.40% | 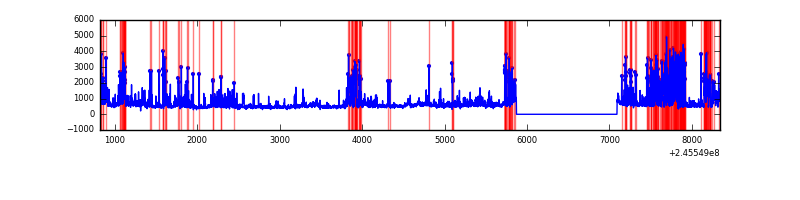 |
Top three noisy pixels from each quadrant. If the there are fewer than three noisy pixels in the level2.evt file, extra rows are filled as -1
| Pixel properties | Quadrant properties | ||||||
|---|---|---|---|---|---|---|---|
| Quadrant | DetID | PixID | Counts | Sigma | Mean | Median | Sigma |
| A | 8 | 5 | 4632156 | 36365.96 | 627 | 614 | 127.4 |
| A | 14 | 238 | 2635159 | 20685.93 | 627 | 614 | 127.4 |
| A | 15 | 174 | 325509 | 2551.01 | 627 | 614 | 127.4 |
| B | 4 | 239 | 970868 | 6797.13 | 753 | 735 | 142.7 |
| B | 15 | 255 | 24827 | 168.8 | 753 | 735 | 142.7 |
| B | 0 | 187 | 18839 | 126.84 | 753 | 735 | 142.7 |
| C | 9 | 54 | 8158 | 42.88 | 749 | 753 | 172.7 |
| C | 14 | 234 | 6383 | 32.6 | 749 | 753 | 172.7 |
| C | 13 | 61 | 5466 | 27.29 | 749 | 753 | 172.7 |
| D | 14 | 34 | 786943 | 4541.3 | 726 | 706 | 173.1 |
| D | 1 | 52 | 661289 | 3815.53 | 726 | 706 | 173.1 |
| D | 11 | 129 | 183861 | 1057.9 | 726 | 706 | 173.1 |
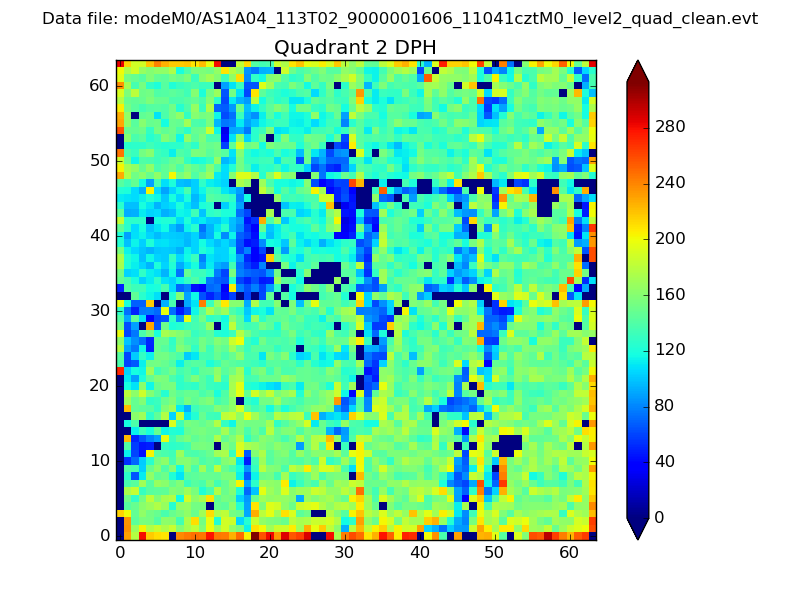
Histogram calculated using DETX and DETY for each event in the final _common_clean file
| Quadrant A | 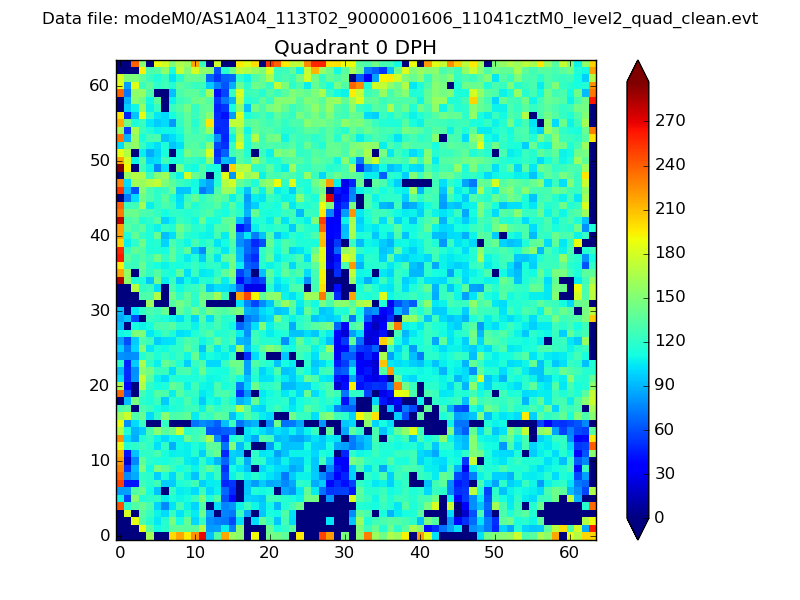 |
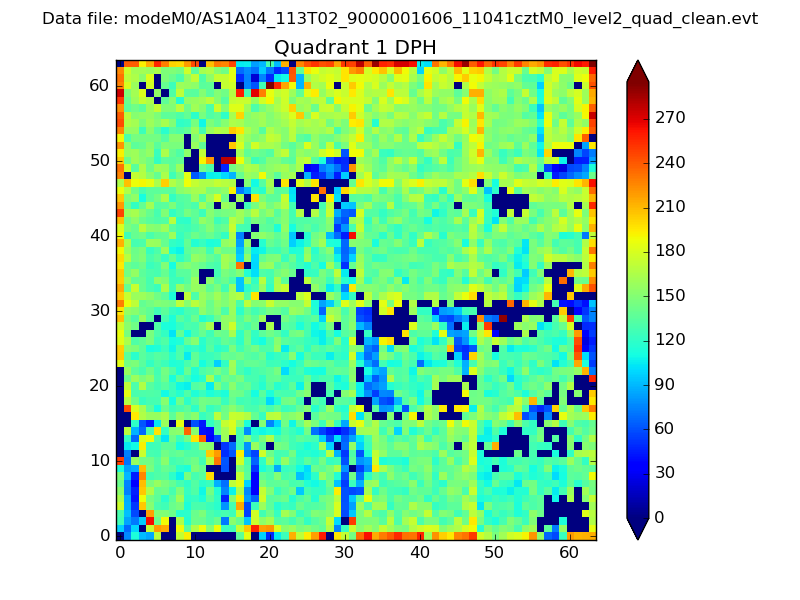 |
Quadrant B |
|---|---|---|---|
| Quadrant D | 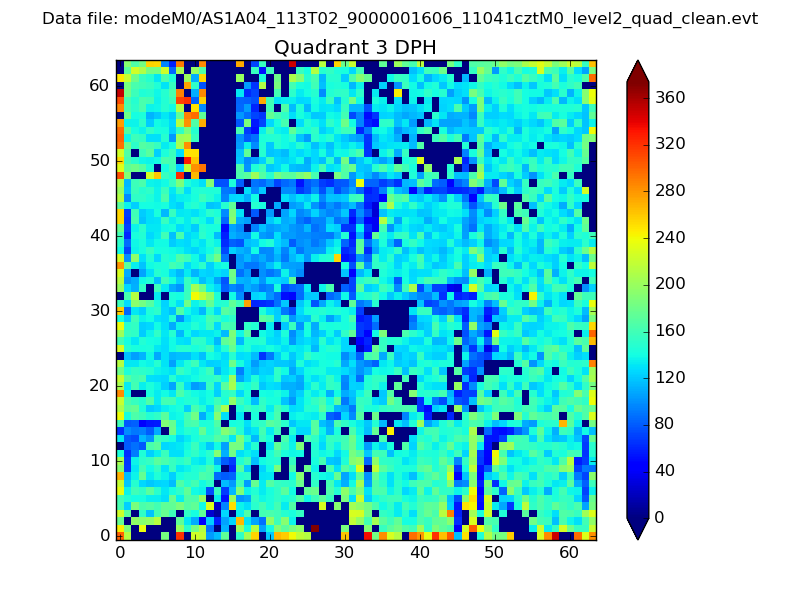 |
 |
Quadrant C |
| Plot type | Count rate plots | Images |
|---|---|---|
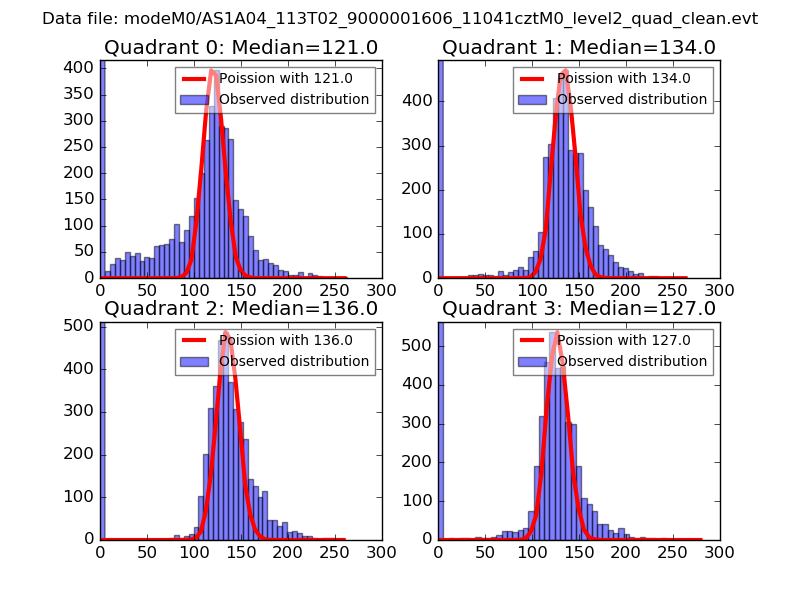
| Comparison with Poisson distribution Blue bars denote a histogram of data divided into 1 sec bins. Red curve is a Poisson curve with rate = median count rate of data. |
 |
 |
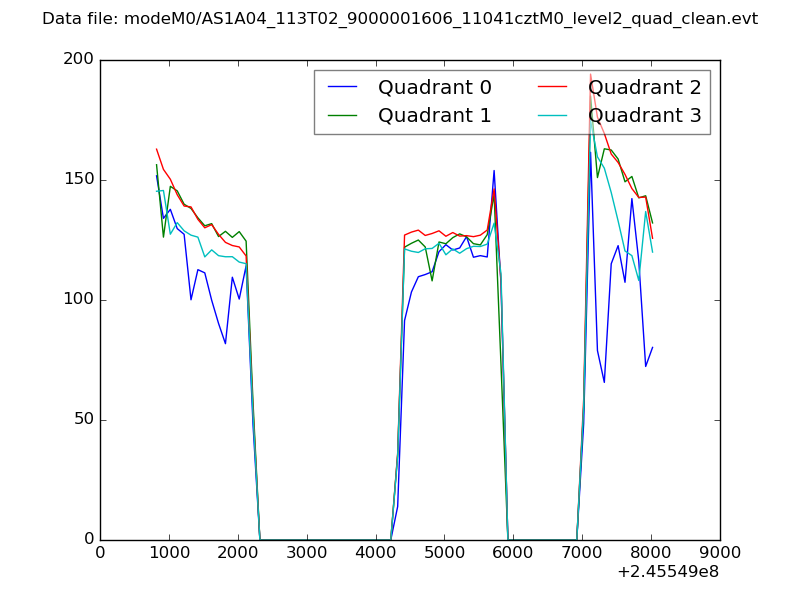
| Quadrant-wise count rates Data is divided into 100 sec bins |
 |
|
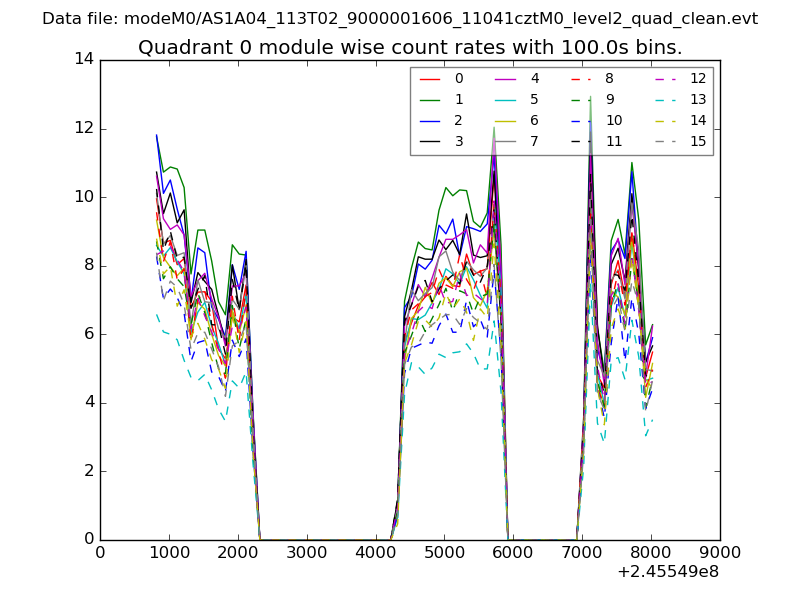
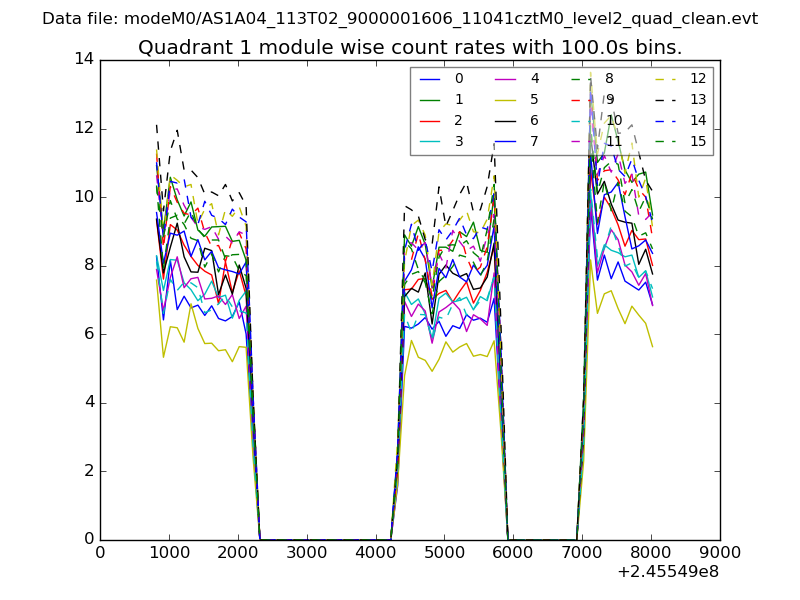
| Module-wise count rates for Quadrant A Data is divided into 100 sec bins |
 |
 |
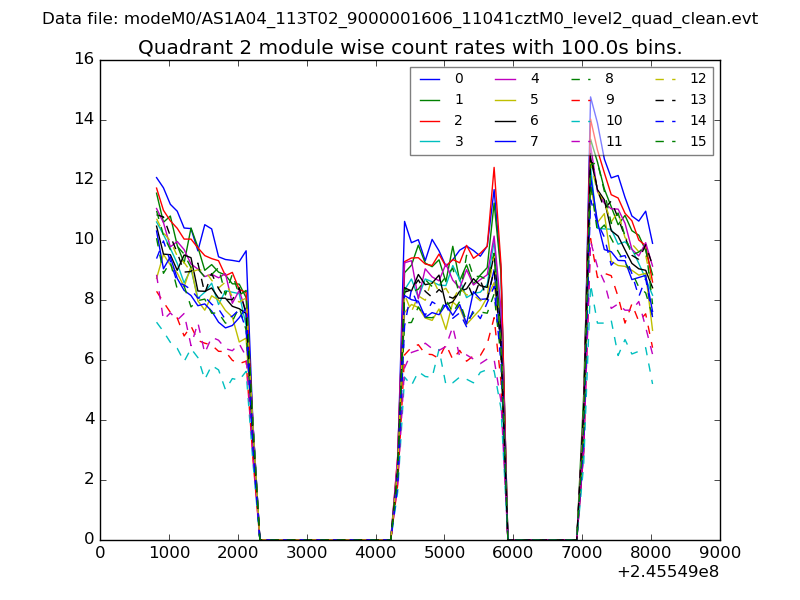
| Module-wise count rates for Quadrant B Data is divided into 100 sec bins |
 |
 |
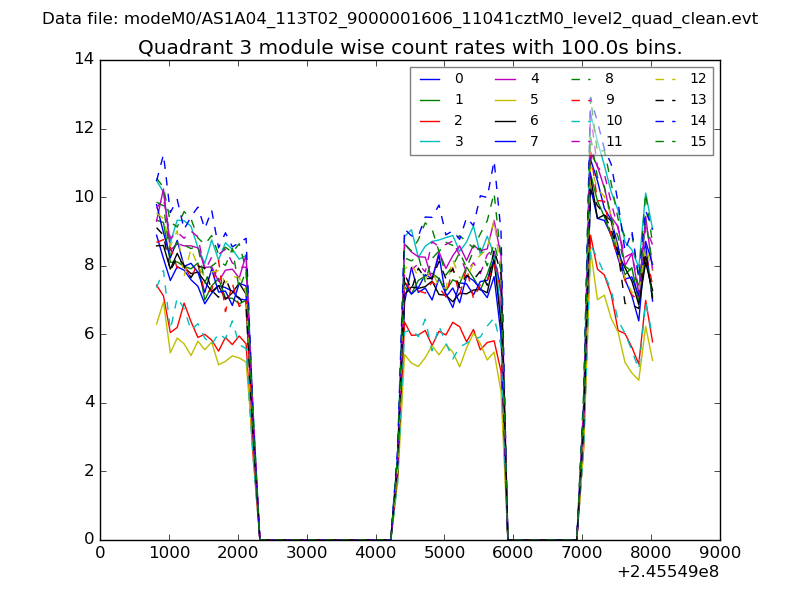
| Module-wise count rates for Quadrant C Data is divided into 100 sec bins |
 |
 |
| Module-wise count rates for Quadrant D Data is divided into 100 sec bins |
 |
 |
| Parameter | Plot |
|---|---|
| CZT HV Monitor | 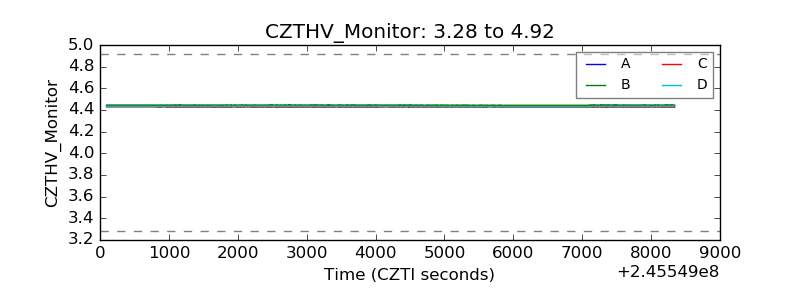 |
| D_VDD | 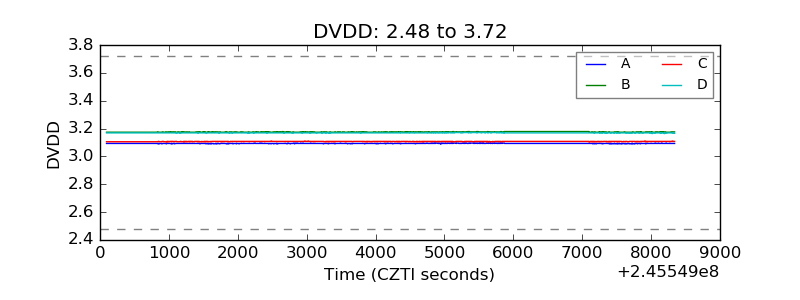 |
| Temperature 1 | 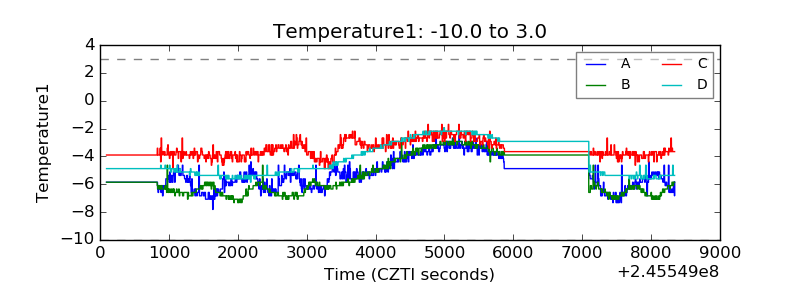 |
| Veto HV Monitor | 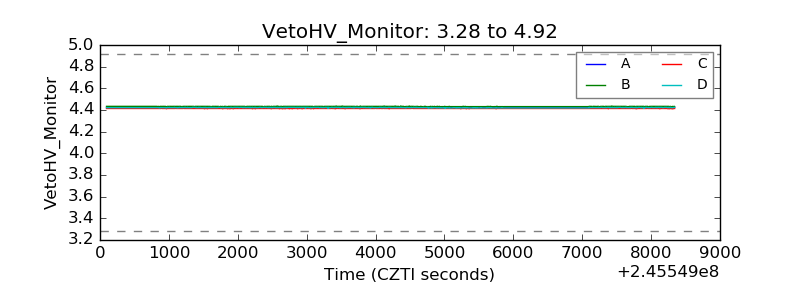 |
| Veto LLD | 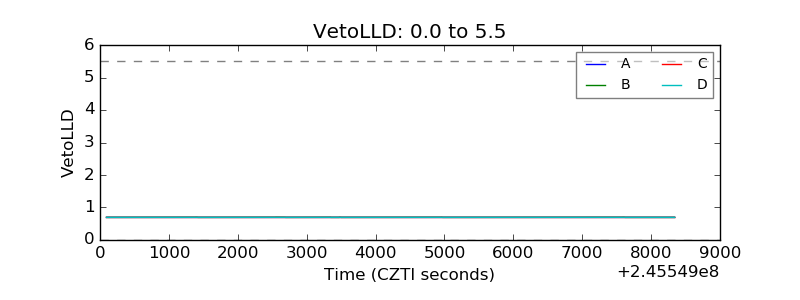 |
| Alpha Counter | 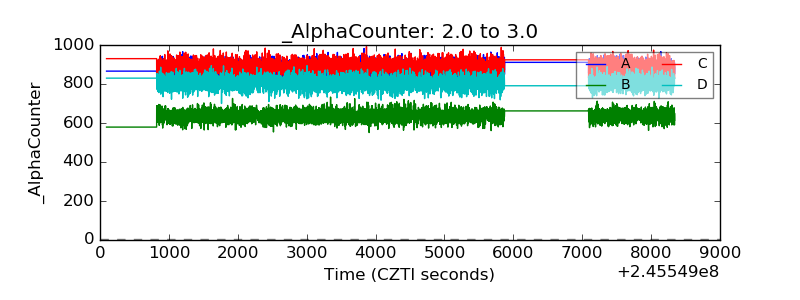 |
| _CPM_Rate | 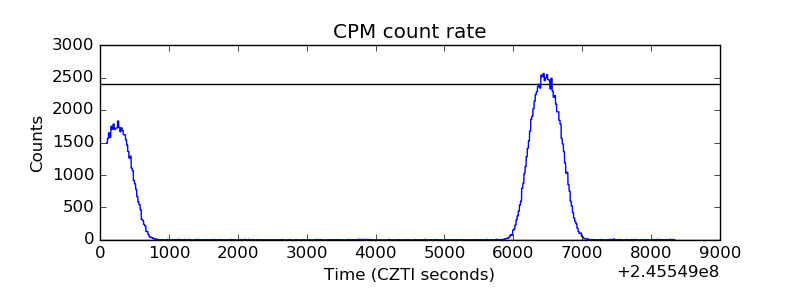 |
| CZT Counter | 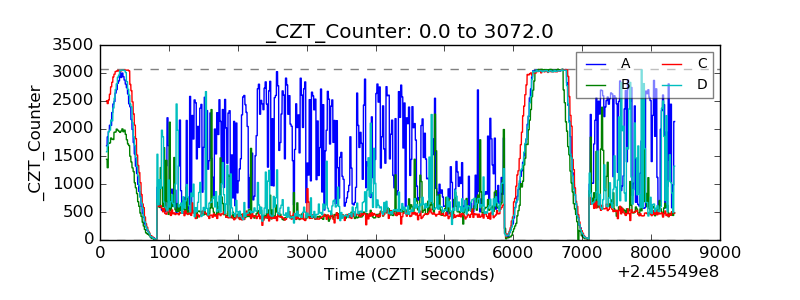 |
| +2.5 Volts monitor |  |
| +5 Volts monitor |  |
| _ROLL_ROT | 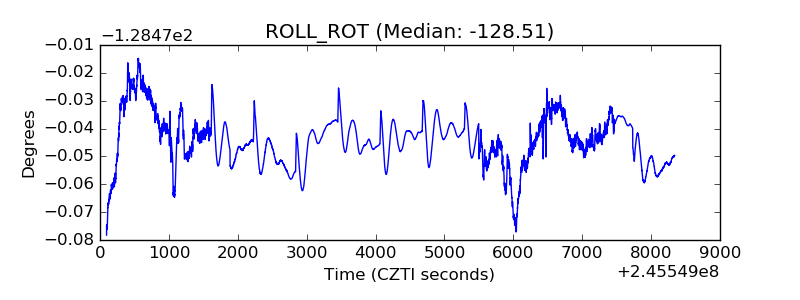 |
| _Roll_DEC | 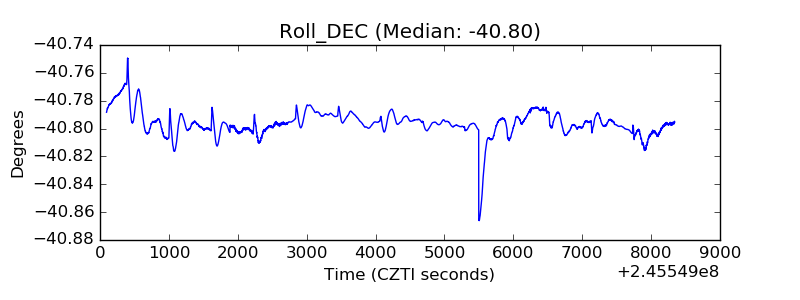 |
| _Roll_RA | 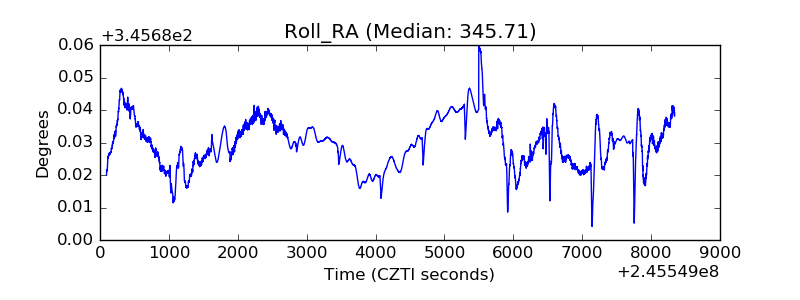 |
| Veto Counter | 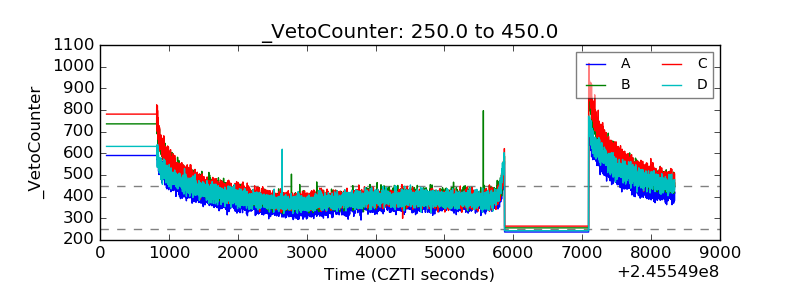 |