| Param | Original file | Final file |
|---|---|---|
| Filename | modeM0/AS1A04_113T02_9000001606_11042cztM0_level2.evt | modeM0/AS1A04_113T02_9000001606_11042cztM0_level2_quad_clean.evt |
| Size (bytes) | 693,184,320 | 76,861,440 |
| Size | 661.1 MB | 73.3 MB |
| Events in quadrant A | 8,469,841 | 398,740 |
| Events in quadrant B | 4,087,529 | 505,208 |
| Events in quadrant C | 3,070,183 | 513,124 |
| Events in quadrant D | 4,941,091 | 471,192 |
| Mode SS | |||
|---|---|---|---|
| Quadrant | BADHDUFLAG | Total packets | Discarded packets |
| A | 0 | 128 | 0 |
| B | 0 | 128 | 0 |
| C | 0 | 128 | 0 |
| D | 0 | 128 | 0 |
| Mode M0 | |||
|---|---|---|---|
| Quadrant | BADHDUFLAG | Total packets | Discarded packets |
| A | 0 | 29510 | 3 |
| B | 0 | 16043 | 2 |
| C | 0 | 13076 | 2 |
| D | 0 | 18969 | 2 |
| Mode M9 | |||
|---|---|---|---|
| Quadrant | BADHDUFLAG | Total packets | Discarded packets |
| A | 0 | 21 | 0 |
| B | 0 | 21 | 0 |
| C | 0 | 21 | 0 |
| D | 0 | 22 | 0 |
| Quadrant | Total seconds | Saturated seconds | Saturation percentage |
|---|---|---|---|
| A | 6281 | 1861 | 29.629040% |
| B | 6281 | 236 | 3.757363% |
| C | 6281 | 7 | 0.111447% |
| D | 6281 | 284 | 4.521573% |
Noise dominated data is calculated using 1-second bins in cleaned event files. If a bin has >2000 counts, and if more than 50% of those come from <1% of pixels, then it is considered to be noise-dominated and hence unusable.
| Quadrant | # 1 sec bins | Bins with >0 counts | Bins with >2000 counts | High rate bins dominated by noise | Noise dominated (total time) | Noise dominated (detector-on time) | Marked lightcurve |
|---|---|---|---|---|---|---|---|
| A | 7581 | 6282 | 1606 | 1606 | 21.18% | 25.57% |  |
| B | 7581 | 6282 | 146 | 146 | 1.93% | 2.32% |  |
| C | 7581 | 6282 | 0 | 0 | 0.00% | 0.00% | 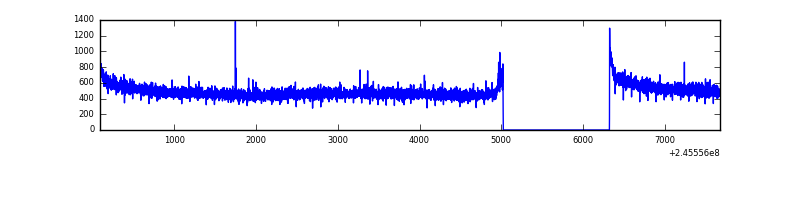 |
| D | 7581 | 6282 | 271 | 271 | 3.57% | 4.31% | 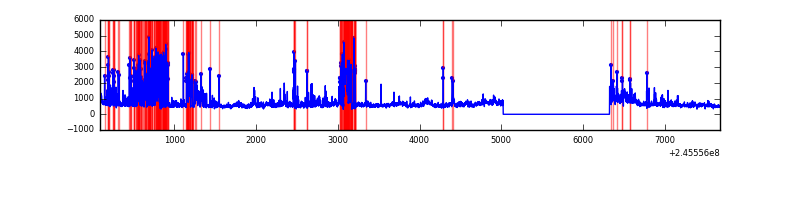 |
Top three noisy pixels from each quadrant. If the there are fewer than three noisy pixels in the level2.evt file, extra rows are filled as -1
| Pixel properties | Quadrant properties | ||||||
|---|---|---|---|---|---|---|---|
| Quadrant | DetID | PixID | Counts | Sigma | Mean | Median | Sigma |
| A | 8 | 5 | 4755045 | 34685.46 | 679 | 666 | 137.1 |
| A | 14 | 238 | 1078106 | 7860.44 | 679 | 666 | 137.1 |
| A | 0 | 12 | 14986 | 104.47 | 679 | 666 | 137.1 |
| B | 4 | 239 | 887718 | 6039.32 | 788 | 769 | 146.9 |
| B | 4 | 81 | 37758 | 251.86 | 788 | 769 | 146.9 |
| B | 0 | 187 | 35960 | 239.62 | 788 | 769 | 146.9 |
| C | 13 | 61 | 5660 | 27.18 | 786 | 794 | 179.0 |
| C | 12 | 4 | 4939 | 23.15 | 786 | 794 | 179.0 |
| C | 3 | 202 | 2115 | 7.38 | 786 | 794 | 179.0 |
| D | 14 | 34 | 494733 | 2758.9 | 757 | 738 | 179.1 |
| D | 1 | 52 | 467886 | 2608.97 | 757 | 738 | 179.1 |
| D | 11 | 129 | 323190 | 1800.86 | 757 | 738 | 179.1 |
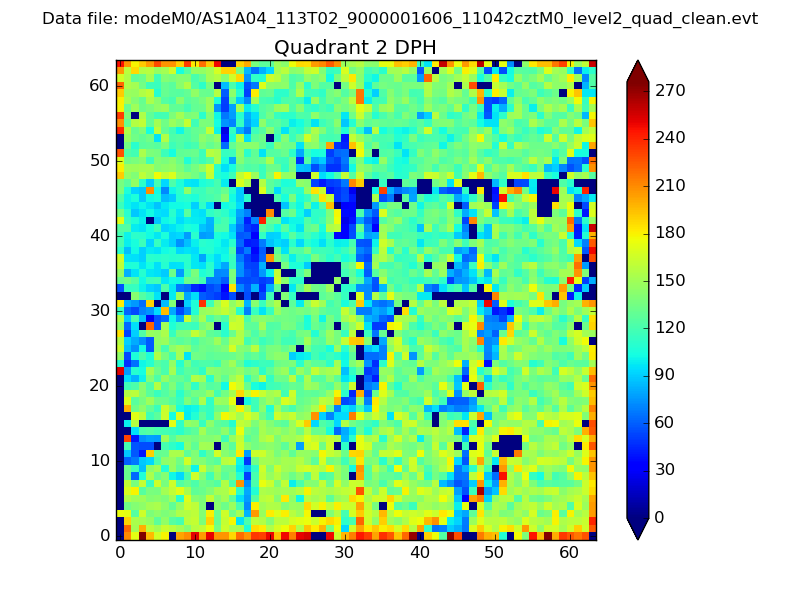
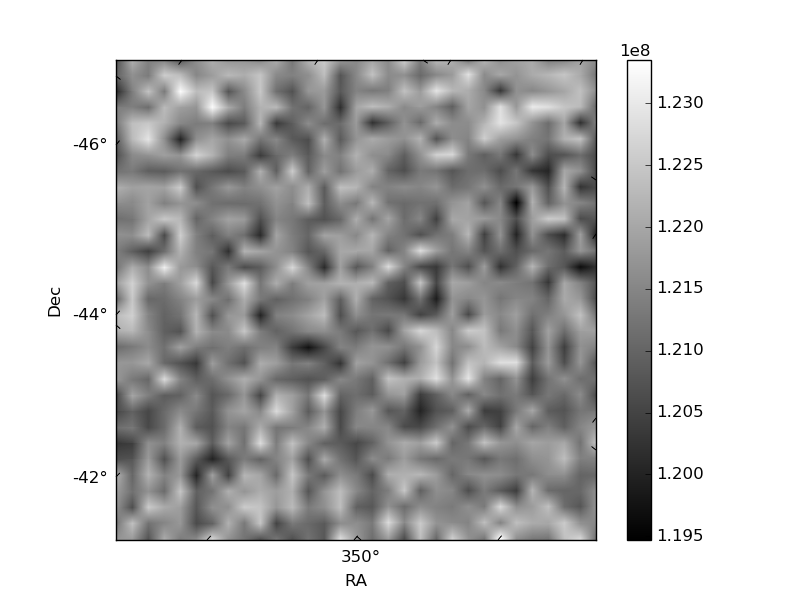
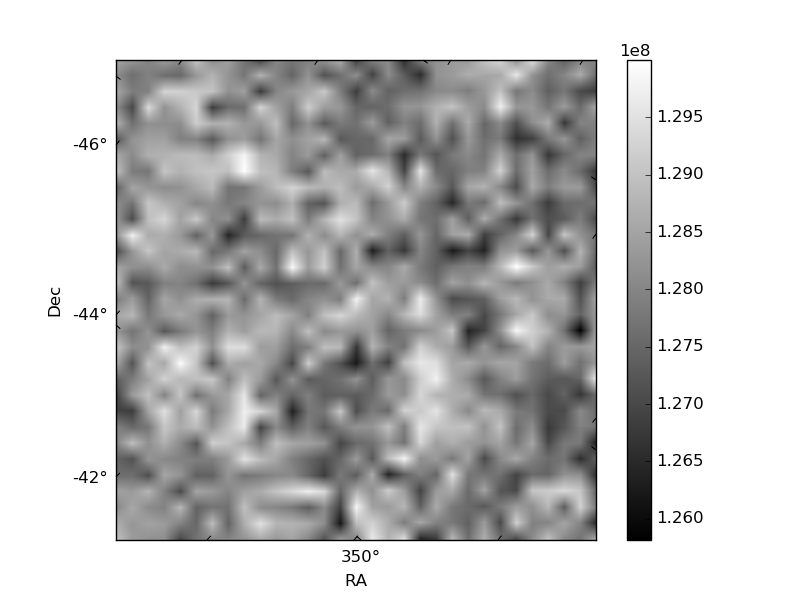
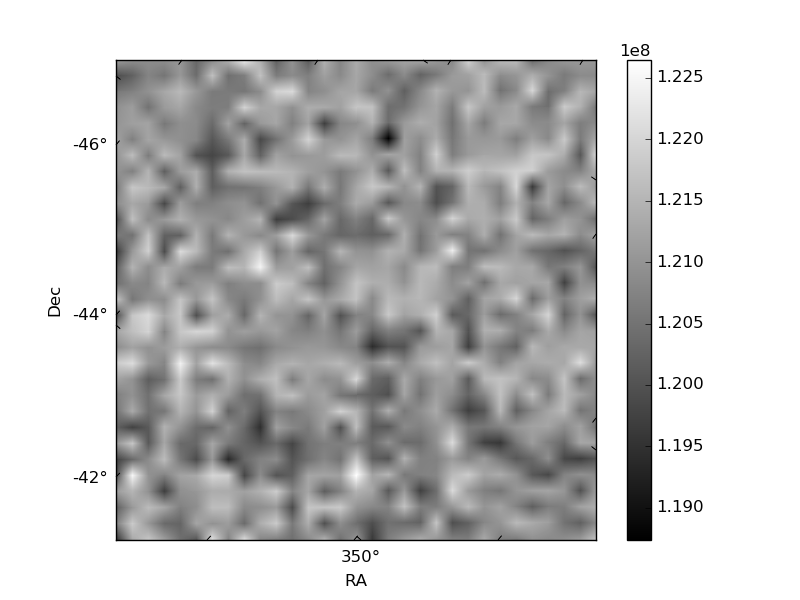
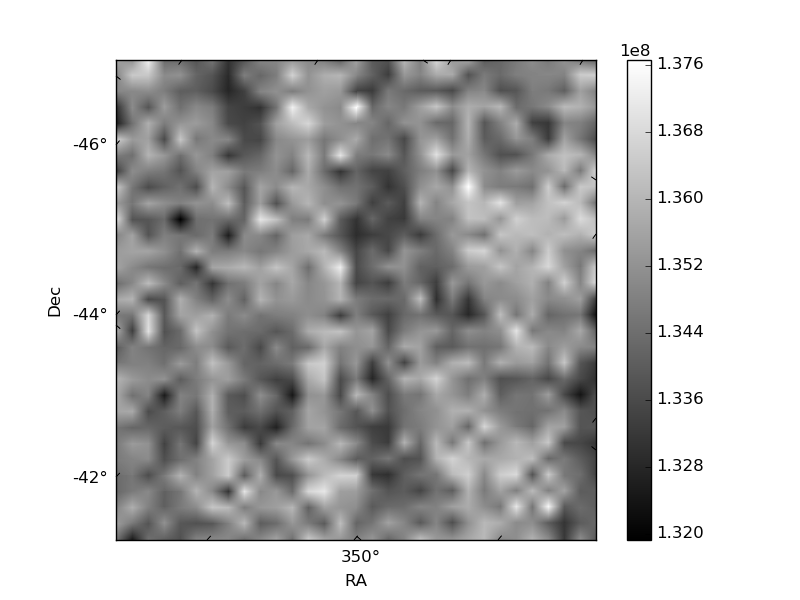
Histogram calculated using DETX and DETY for each event in the final _common_clean file
| Quadrant A | 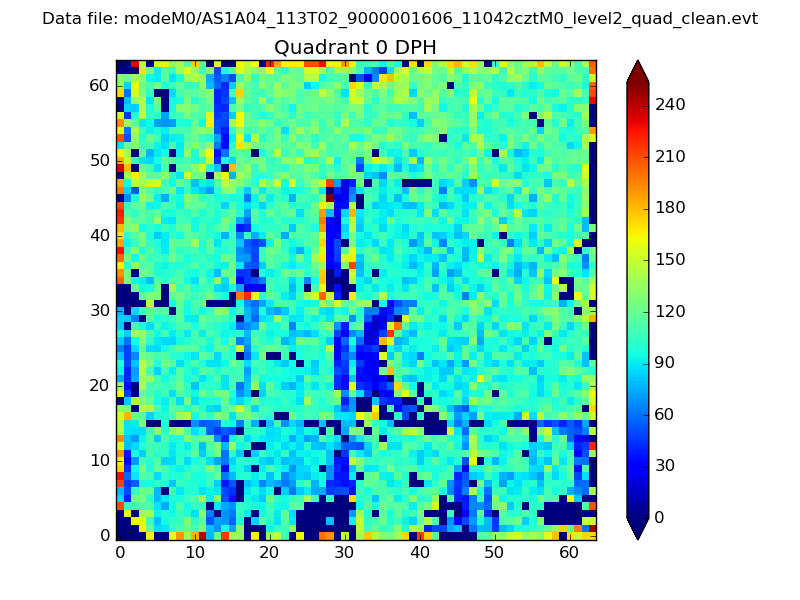 |
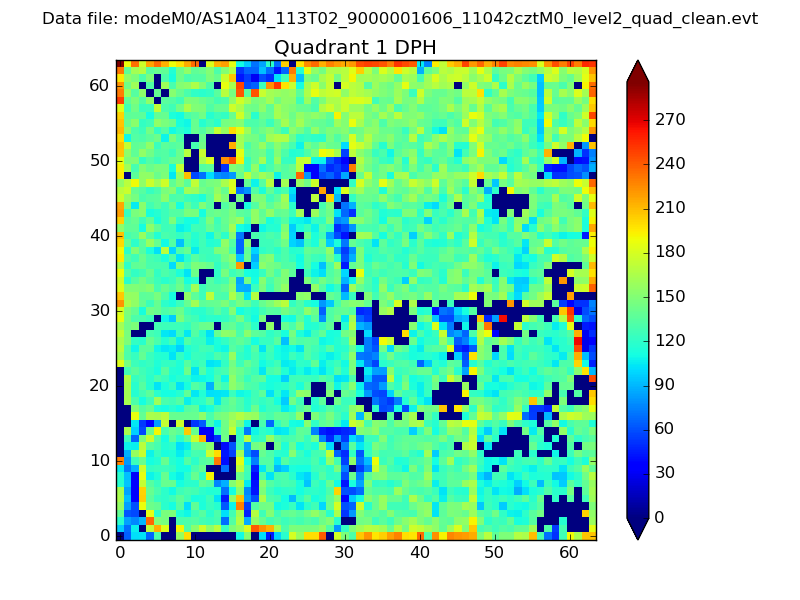 |
Quadrant B |
|---|---|---|---|
| Quadrant D | 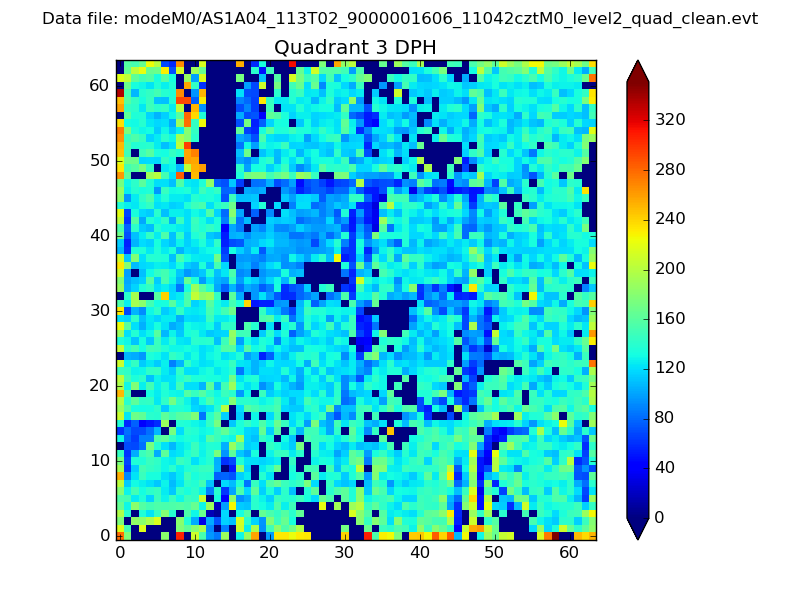 |
 |
Quadrant C |
| Plot type | Count rate plots | Images |
|---|---|---|
| Comparison with Poisson distribution Blue bars denote a histogram of data divided into 1 sec bins. Red curve is a Poisson curve with rate = median count rate of data. |
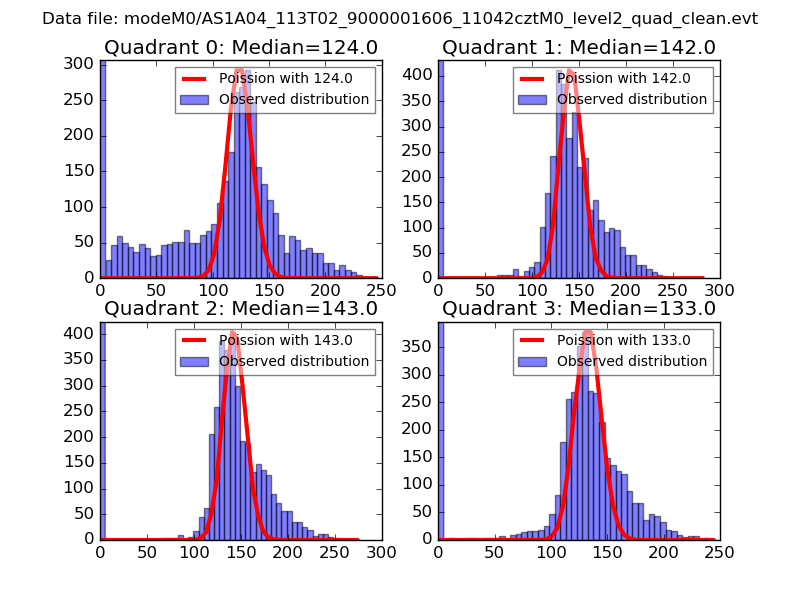 |
 |
| Quadrant-wise count rates Data is divided into 100 sec bins |
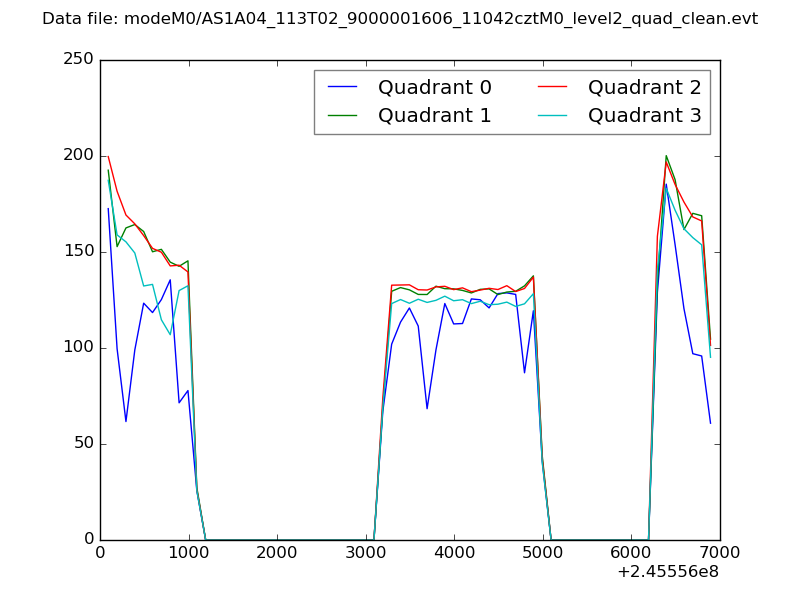 |
|
| Module-wise count rates for Quadrant A Data is divided into 100 sec bins |
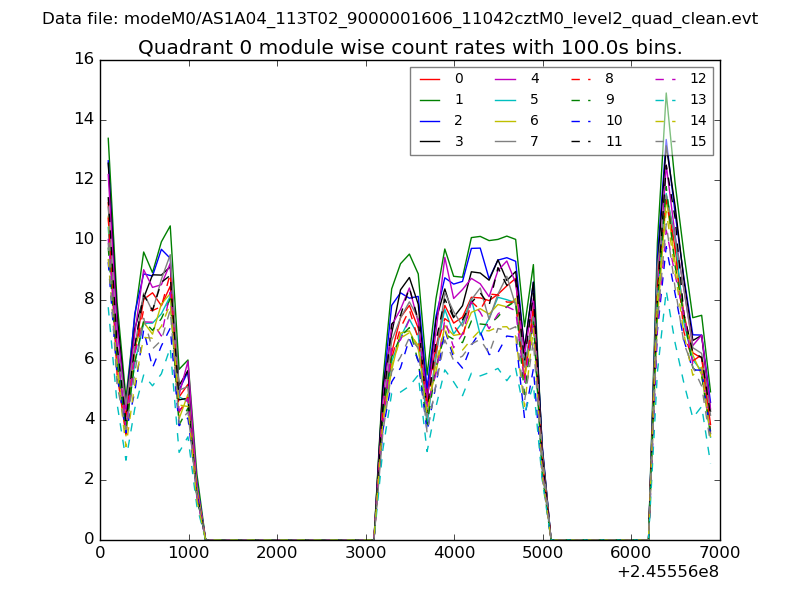 |
 |
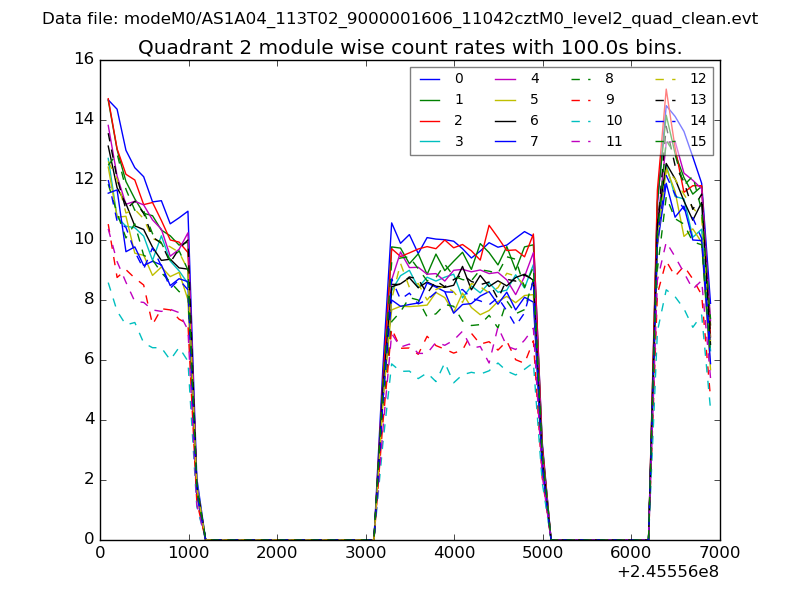
| Module-wise count rates for Quadrant B Data is divided into 100 sec bins |
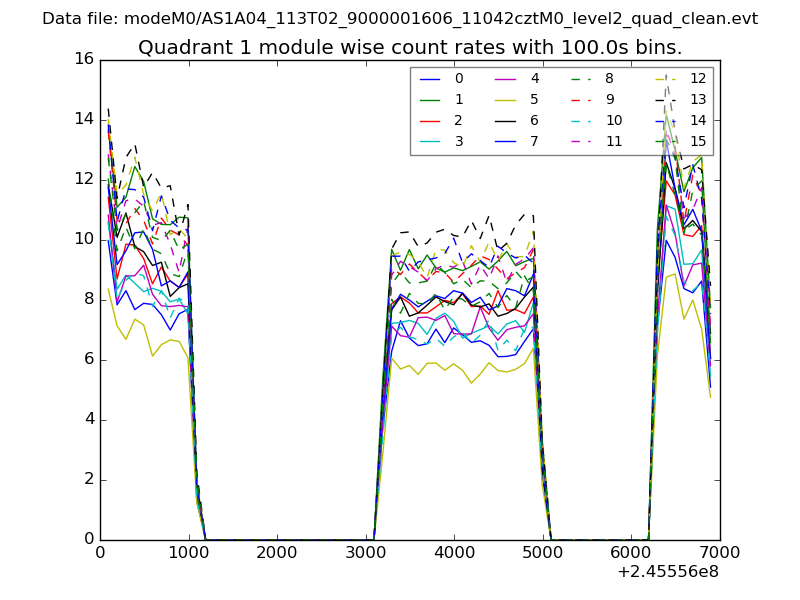 |
 |
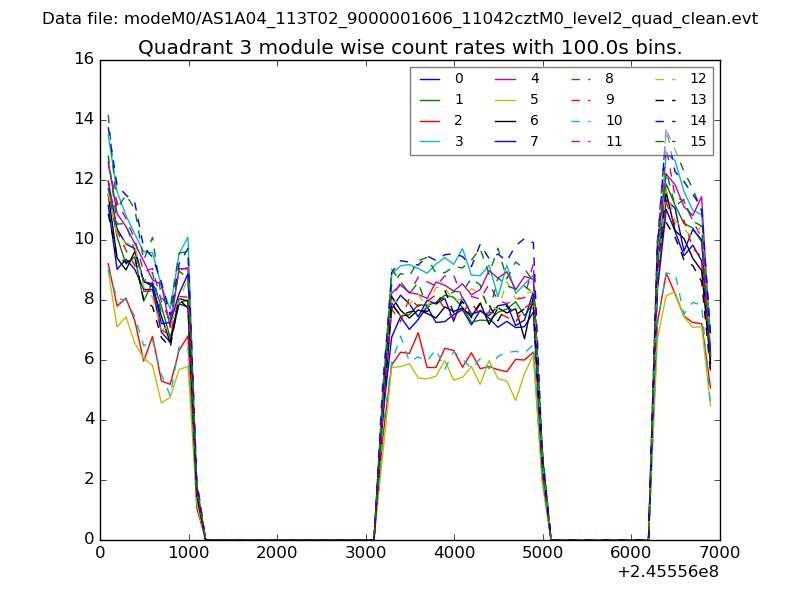
| Module-wise count rates for Quadrant C Data is divided into 100 sec bins |
 |
 |
| Module-wise count rates for Quadrant D Data is divided into 100 sec bins |
 |
 |
| Parameter | Plot |
|---|---|
| CZT HV Monitor | 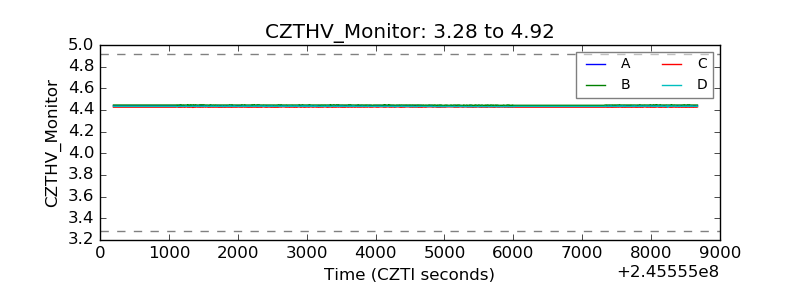 |
| D_VDD | 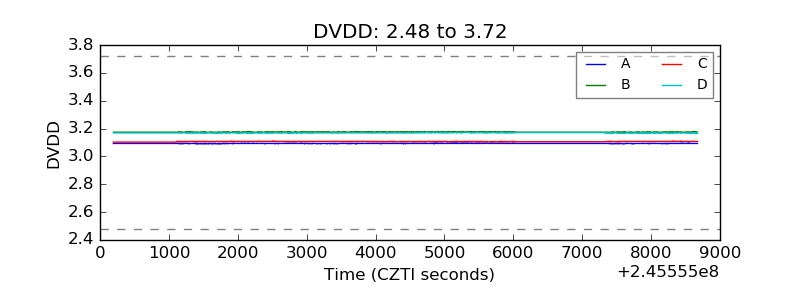 |
| Temperature 1 | 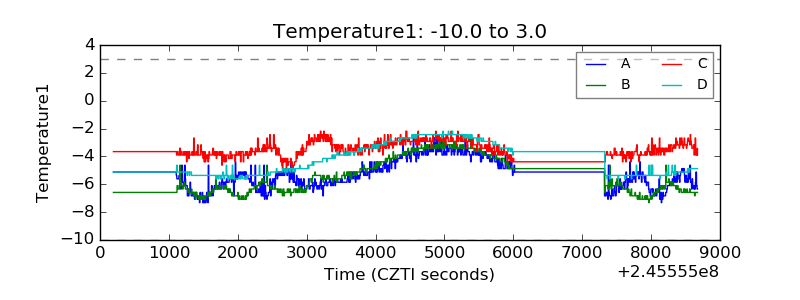 |
| Veto HV Monitor | 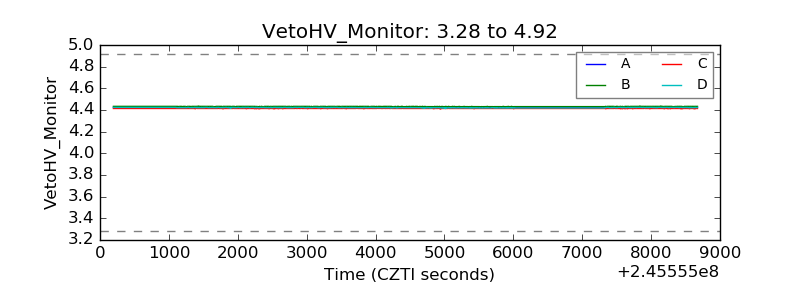 |
| Veto LLD | 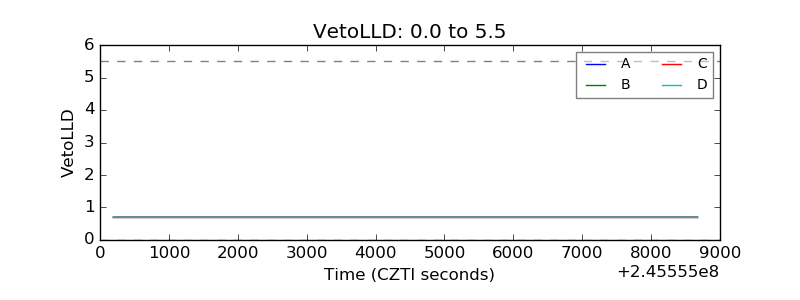 |
| Alpha Counter | 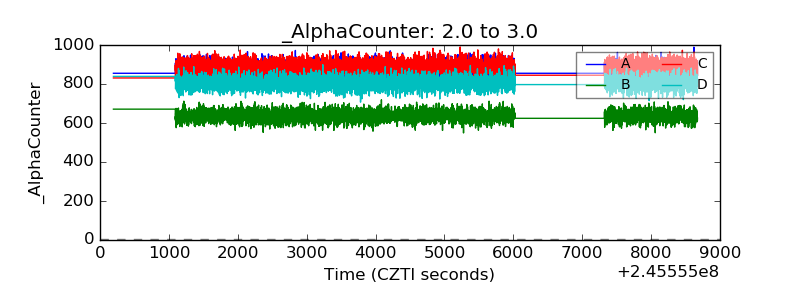 |
| _CPM_Rate | 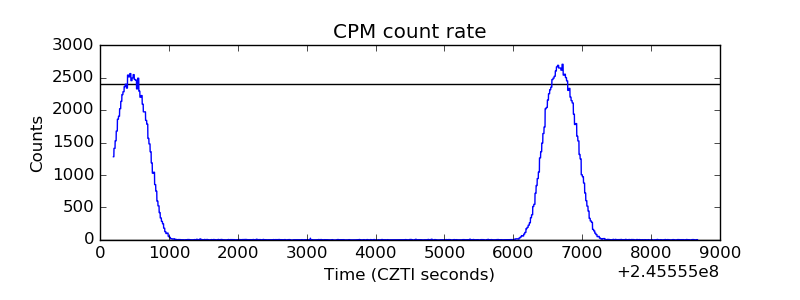 |
| CZT Counter | 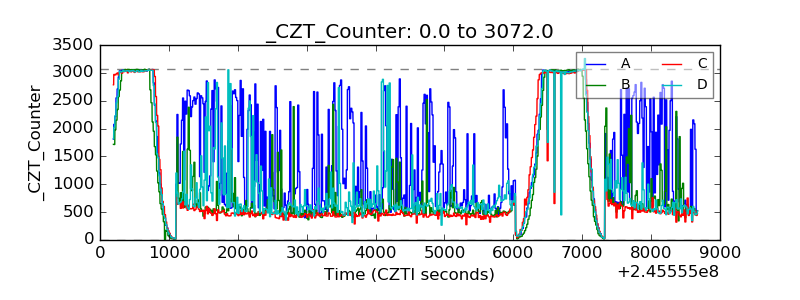 |
| +2.5 Volts monitor | 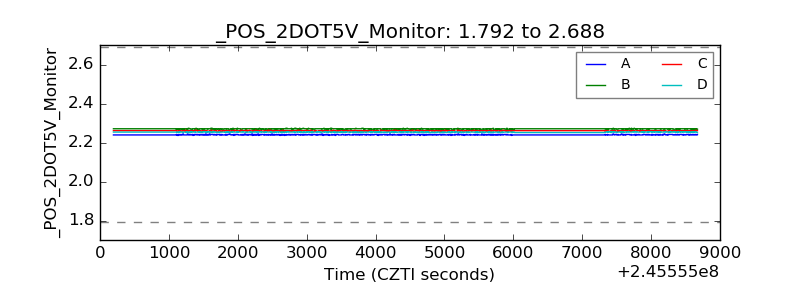 |
| +5 Volts monitor |  |
| _ROLL_ROT | 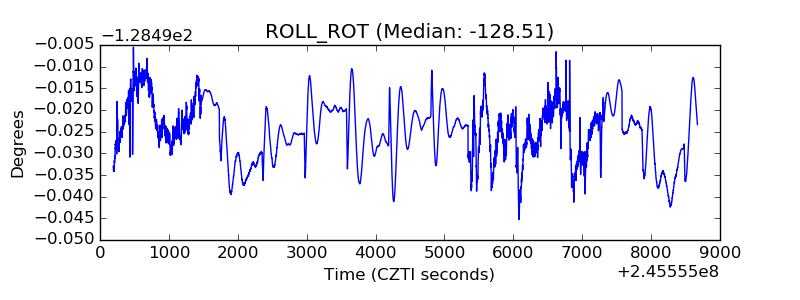 |
| _Roll_DEC | 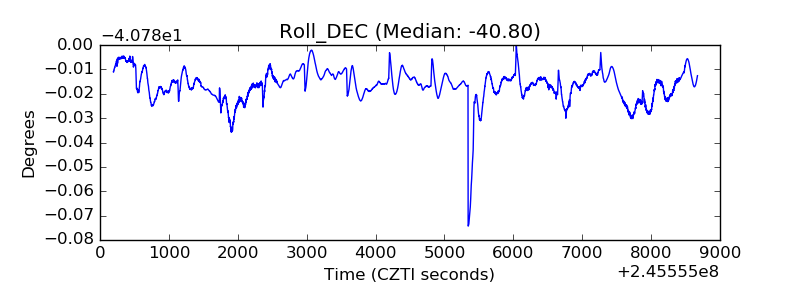 |
| _Roll_RA | 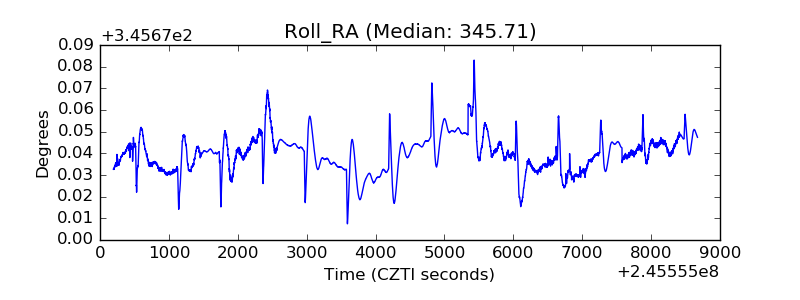 |
| Veto Counter | 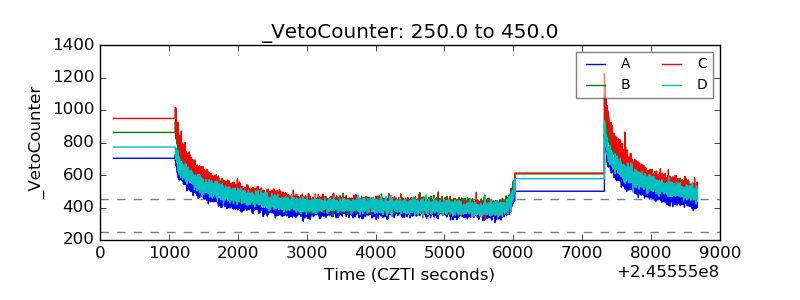 |