| Param | Original file | Final file |
|---|---|---|
| Filename | modeM0/AS1A04_113T02_9000001606_11044cztM0_level2.evt | modeM0/AS1A04_113T02_9000001606_11044cztM0_level2_quad_clean.evt |
| Size (bytes) | 1,105,646,400 | 119,675,520 |
| Size | 1.0 GB | 114.1 MB |
| Events in quadrant A | 12,794,784 | 650,050 |
| Events in quadrant B | 7,178,440 | 743,492 |
| Events in quadrant C | 5,459,444 | 760,646 |
| Events in quadrant D | 7,310,428 | 707,812 |
| Mode SS | |||
|---|---|---|---|
| Quadrant | BADHDUFLAG | Total packets | Discarded packets |
| A | 0 | 226 | 0 |
| B | 0 | 226 | 0 |
| C | 0 | 226 | 0 |
| D | 0 | 226 | 0 |
| Mode M0 | |||
|---|---|---|---|
| Quadrant | BADHDUFLAG | Total packets | Discarded packets |
| A | 0 | 45584 | 3 |
| B | 0 | 28119 | 2 |
| C | 0 | 22862 | 2 |
| D | 0 | 28819 | 2 |
| Mode M9 | |||
|---|---|---|---|
| Quadrant | BADHDUFLAG | Total packets | Discarded packets |
| A | 0 | 25 | 0 |
| B | 0 | 25 | 0 |
| C | 0 | 25 | 0 |
| D | 0 | 25 | 0 |
| Quadrant | Total seconds | Saturated seconds | Saturation percentage |
|---|---|---|---|
| A | 10992 | 2272 | 20.669578% |
| B | 10992 | 551 | 5.012737% |
| C | 10992 | 110 | 1.000728% |
| D | 10992 | 342 | 3.111354% |
Noise dominated data is calculated using 1-second bins in cleaned event files. If a bin has >2000 counts, and if more than 50% of those come from <1% of pixels, then it is considered to be noise-dominated and hence unusable.
| Quadrant | # 1 sec bins | Bins with >0 counts | Bins with >2000 counts | High rate bins dominated by noise | Noise dominated (total time) | Noise dominated (detector-on time) | Marked lightcurve |
|---|---|---|---|---|---|---|---|
| A | 13617 | 10993 | 1759 | 1759 | 12.92% | 16.00% |  |
| B | 13617 | 10993 | 247 | 247 | 1.81% | 2.25% |  |
| C | 13617 | 10994 | 0 | 0 | 0.00% | 0.00% | 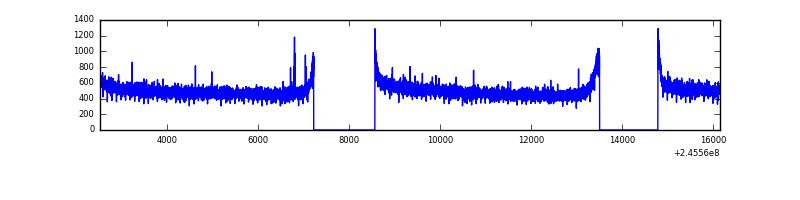 |
| D | 13617 | 10994 | 214 | 214 | 1.57% | 1.95% |  |
Top three noisy pixels from each quadrant. If the there are fewer than three noisy pixels in the level2.evt file, extra rows are filled as -1
| Pixel properties | Quadrant properties | ||||||
|---|---|---|---|---|---|---|---|
| Quadrant | DetID | PixID | Counts | Sigma | Mean | Median | Sigma |
| A | 14 | 238 | 4130024 | 16144.06 | 1289 | 1266 | 255.7 |
| A | 8 | 5 | 3461103 | 13528.48 | 1289 | 1266 | 255.7 |
| A | 15 | 174 | 203000 | 788.81 | 1289 | 1266 | 255.7 |
| B | 4 | 239 | 1428767 | 5481.8 | 1403 | 1371 | 260.4 |
| B | 4 | 81 | 243770 | 930.91 | 1403 | 1371 | 260.4 |
| B | 0 | 187 | 38128 | 141.16 | 1403 | 1371 | 260.4 |
| C | 13 | 61 | 10280 | 28.09 | 1397 | 1409 | 315.8 |
| C | 12 | 4 | 8391 | 22.11 | 1397 | 1409 | 315.8 |
| C | 8 | 222 | 3934 | 8.0 | 1397 | 1409 | 315.8 |
| D | 11 | 129 | 575997 | 1798.98 | 1365 | 1332 | 319.4 |
| D | 8 | 195 | 358053 | 1116.71 | 1365 | 1332 | 319.4 |
| D | 14 | 34 | 277377 | 864.15 | 1365 | 1332 | 319.4 |
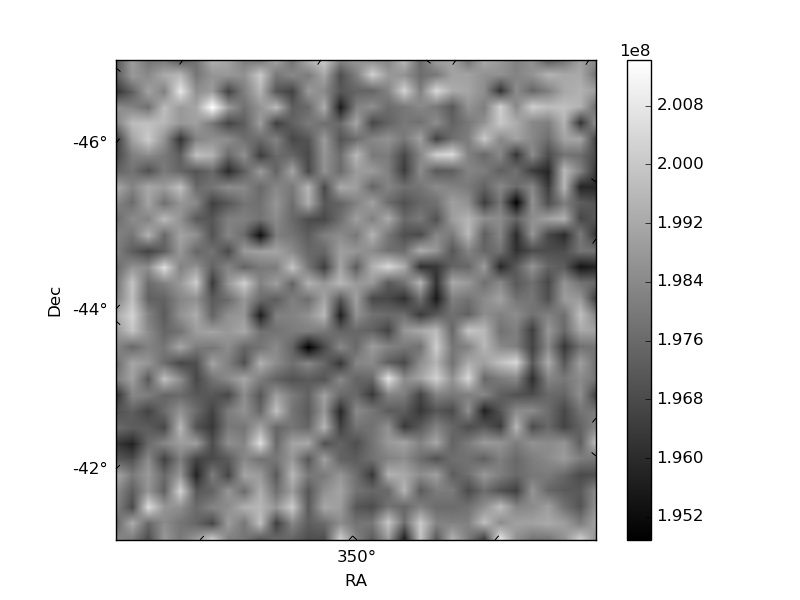
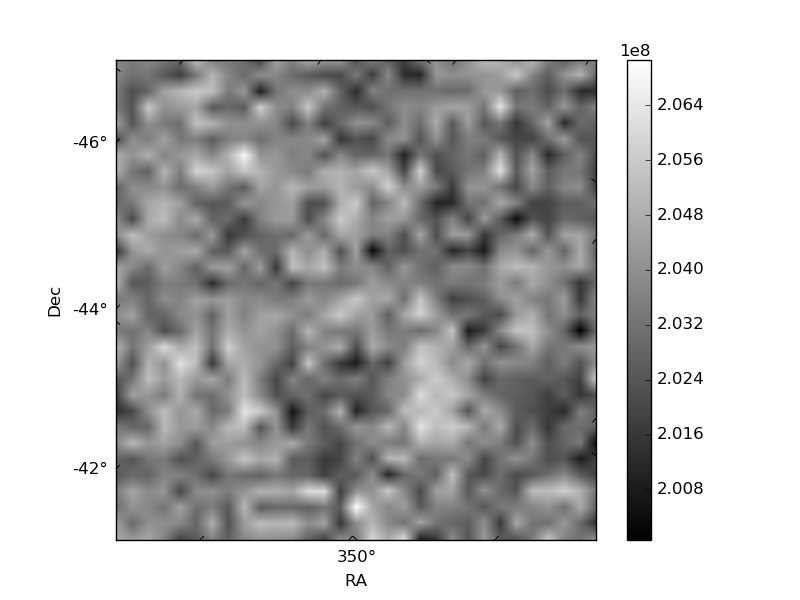
Histogram calculated using DETX and DETY for each event in the final _common_clean file
| Quadrant A | 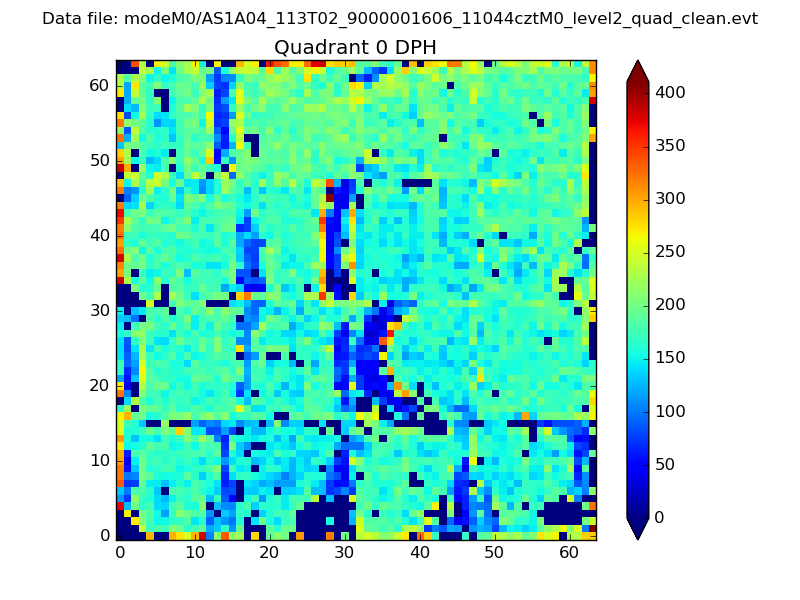 |
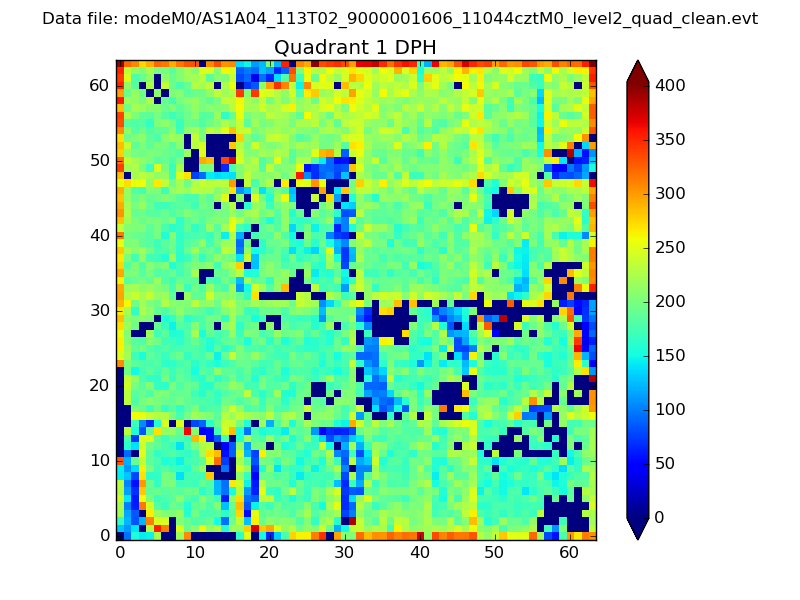 |
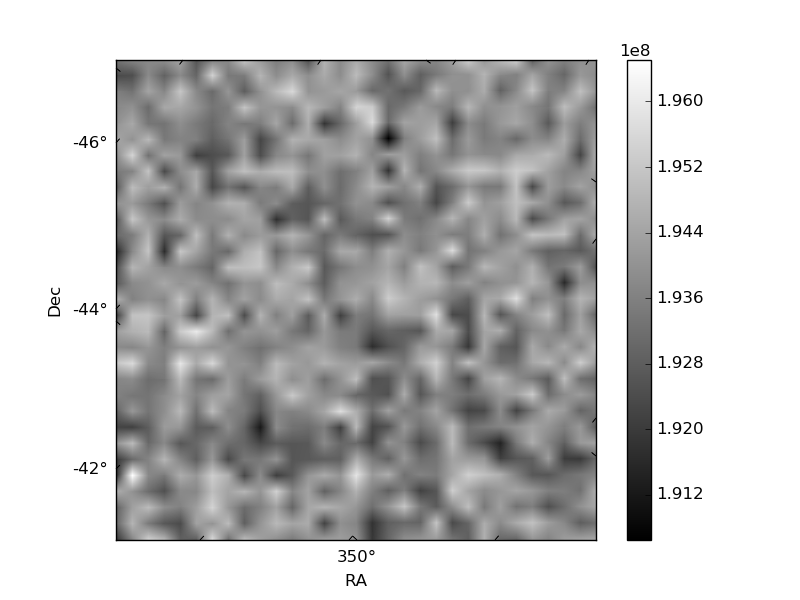
Quadrant B |
|---|---|---|---|
| Quadrant D | 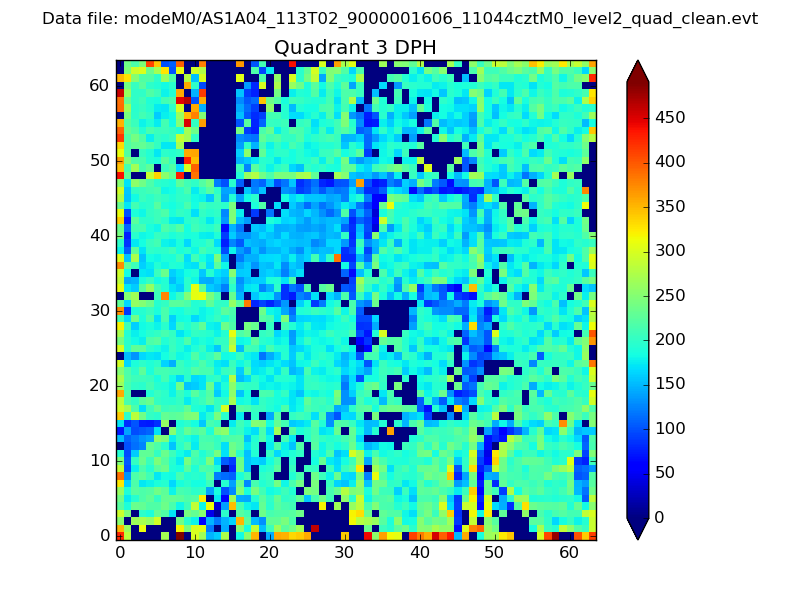 |
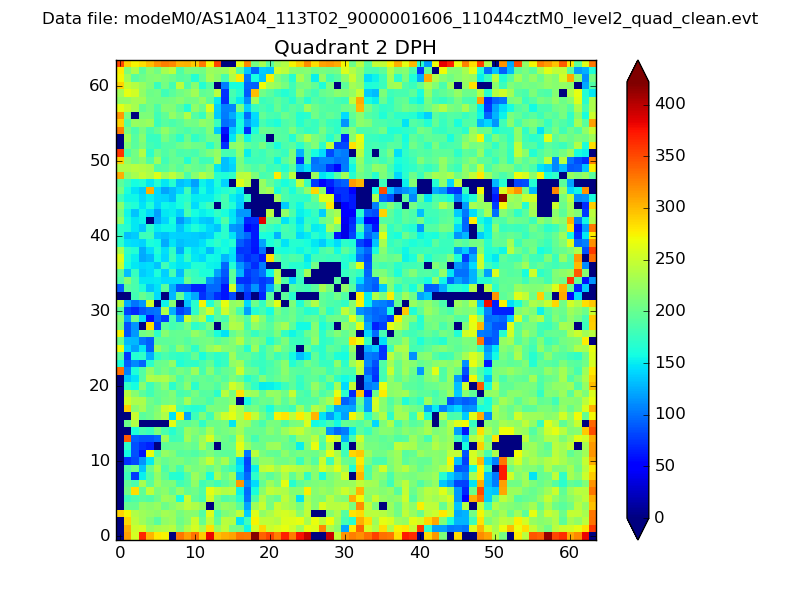 |
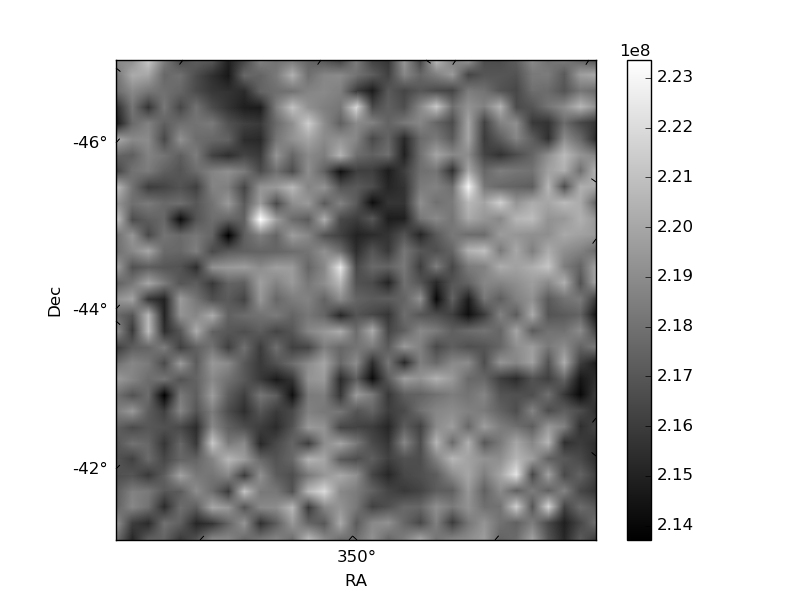
Quadrant C |
| Plot type | Count rate plots | Images |
|---|---|---|
| Comparison with Poisson distribution Blue bars denote a histogram of data divided into 1 sec bins. Red curve is a Poisson curve with rate = median count rate of data. |
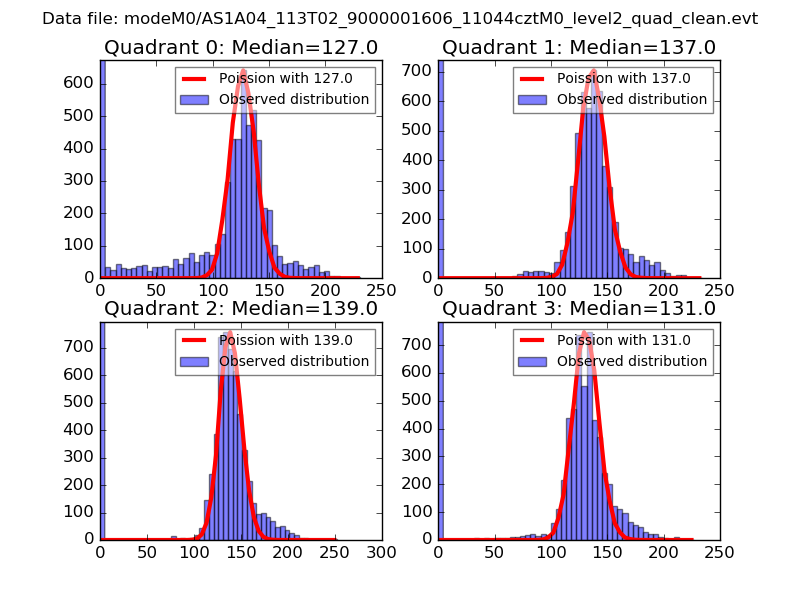 |
 |
| Quadrant-wise count rates Data is divided into 100 sec bins |
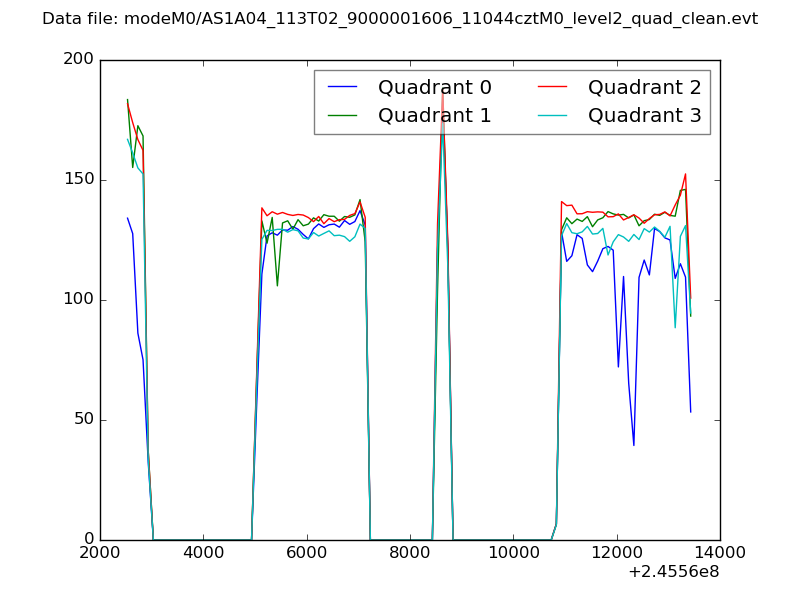 |
|
| Module-wise count rates for Quadrant A Data is divided into 100 sec bins |
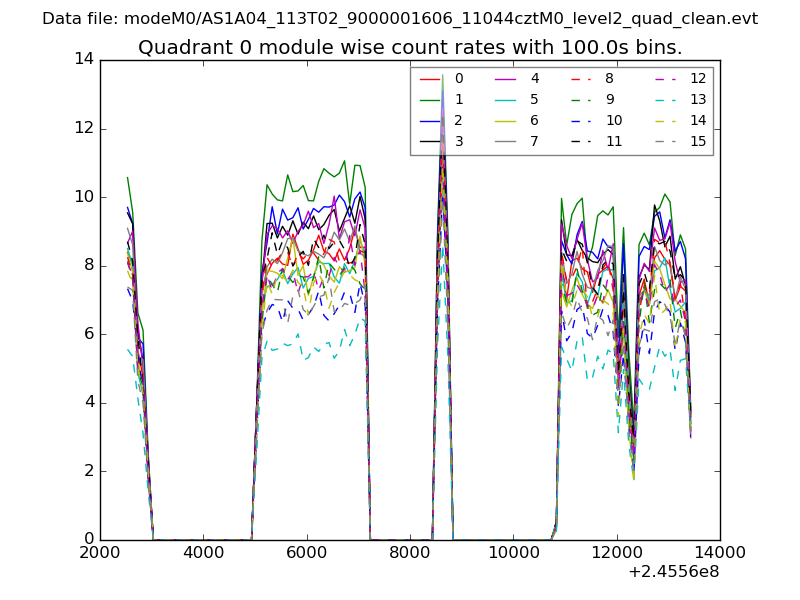 |
 |
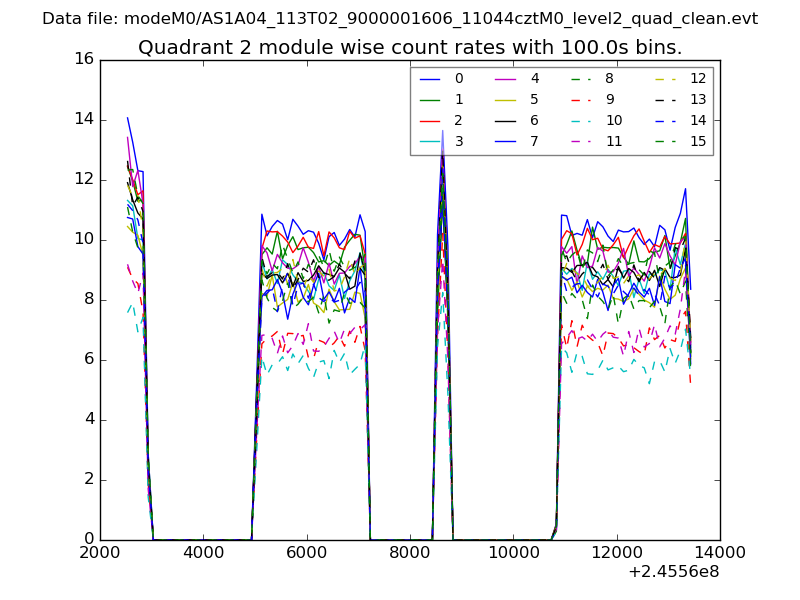
| Module-wise count rates for Quadrant B Data is divided into 100 sec bins |
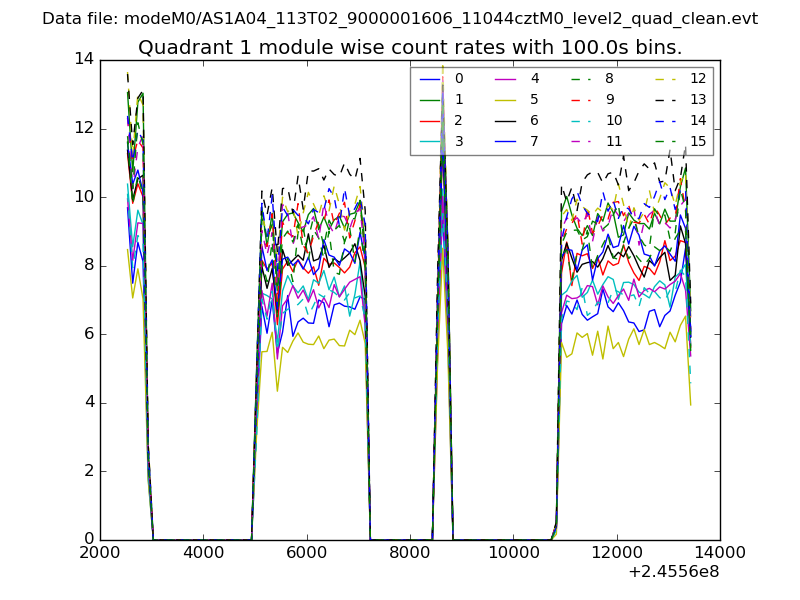 |
 |
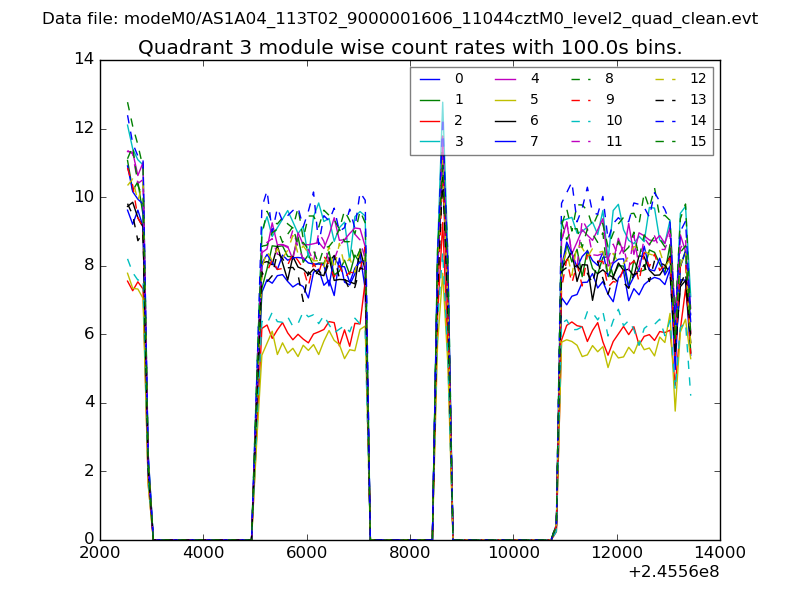
| Module-wise count rates for Quadrant C Data is divided into 100 sec bins |
 |
 |
| Module-wise count rates for Quadrant D Data is divided into 100 sec bins |
 |
 |
| Parameter | Plot |
|---|---|
| CZT HV Monitor | 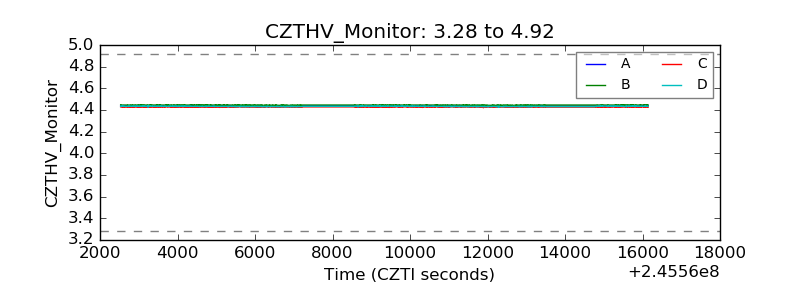 |
| D_VDD | 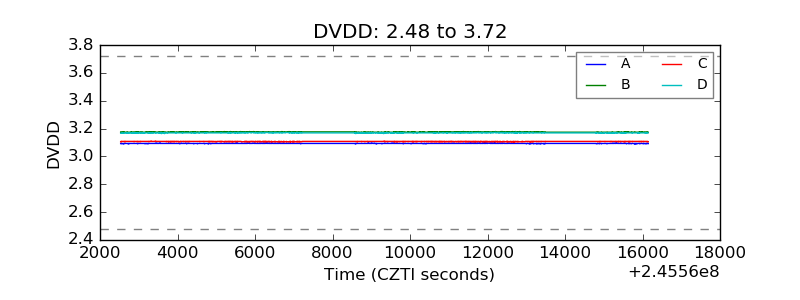 |
| Temperature 1 | 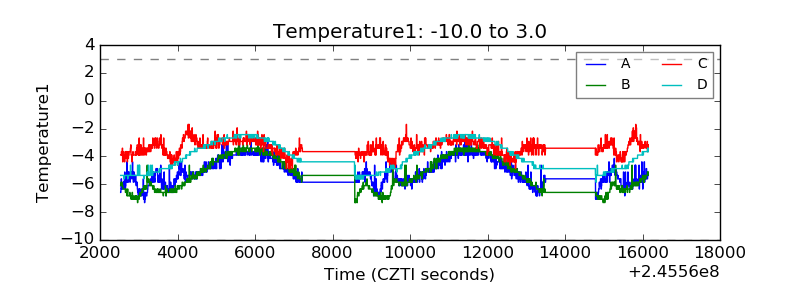 |
| Veto HV Monitor | 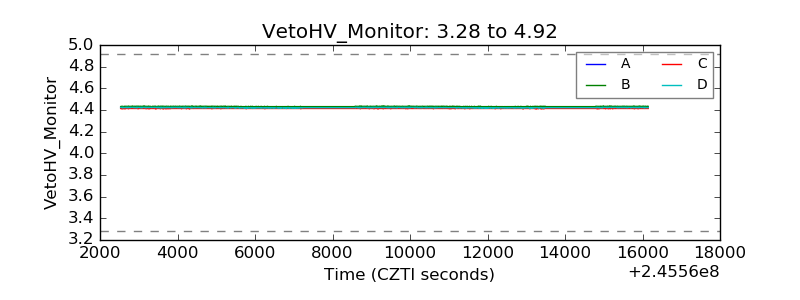 |
| Veto LLD | 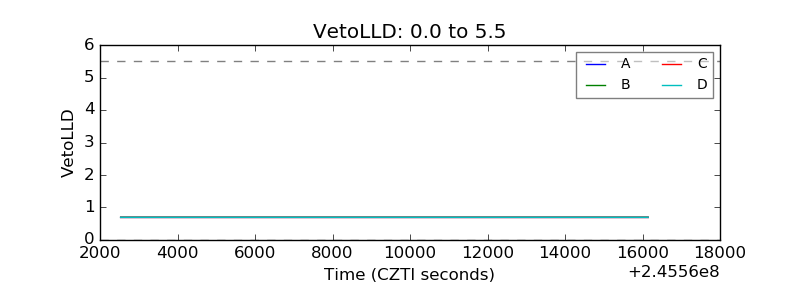 |
| Alpha Counter | 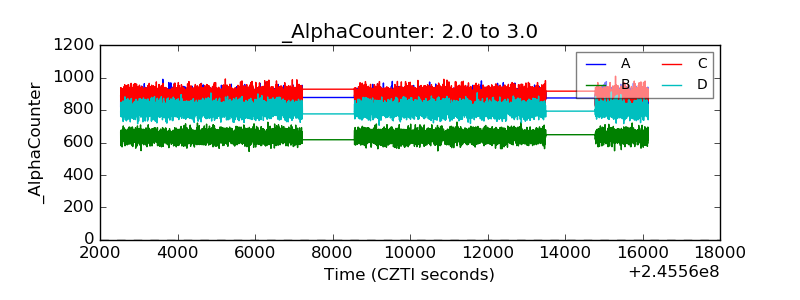 |
| _CPM_Rate | 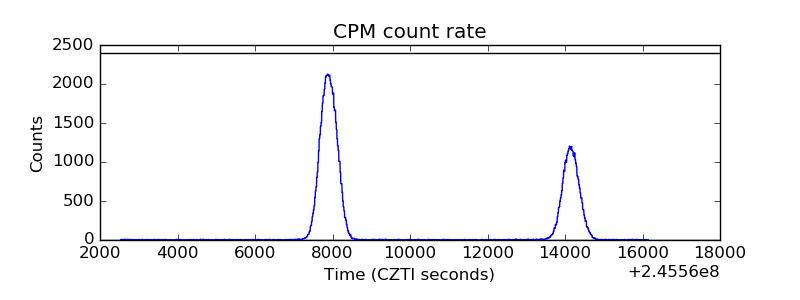 |
| CZT Counter | 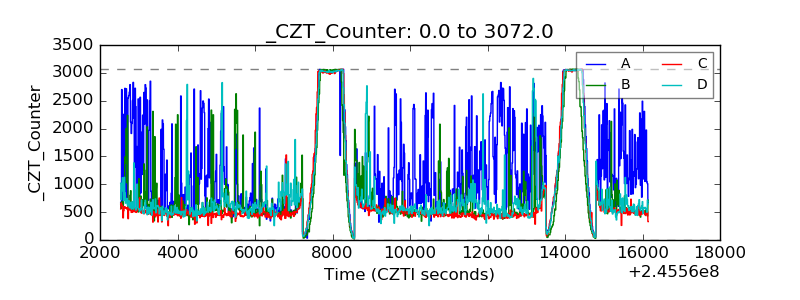 |
| +2.5 Volts monitor |  |
| +5 Volts monitor |  |
| _ROLL_ROT | 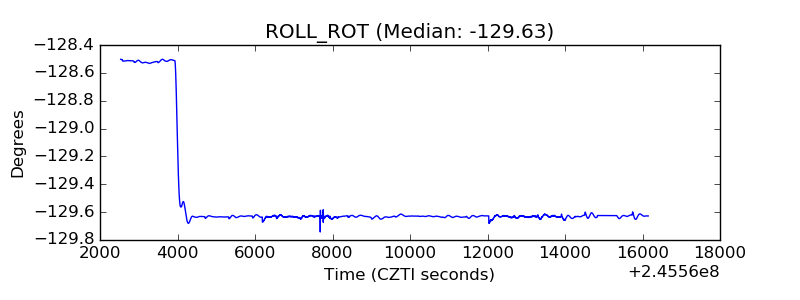 |
| _Roll_DEC | 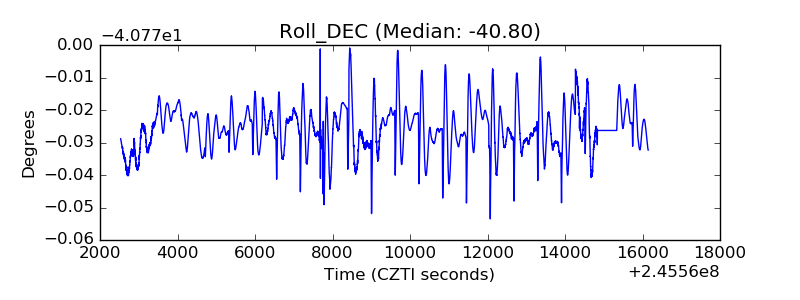 |
| _Roll_RA | 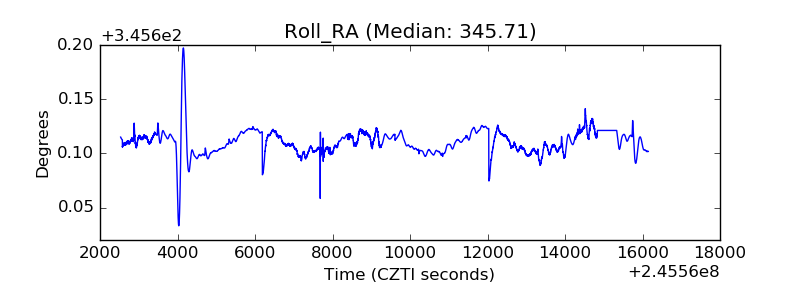 |
| Veto Counter | 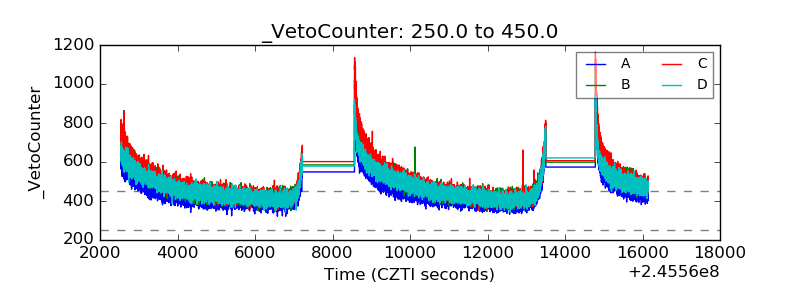 |