| Param | Original file | Final file |
|---|---|---|
| Filename | modeM0/AS1A04_113T02_9000001606_11045cztM0_level2.evt | modeM0/AS1A04_113T02_9000001606_11045cztM0_level2_quad_clean.evt |
| Size (bytes) | 740,191,680 | 67,173,120 |
| Size | 705.9 MB | 64.1 MB |
| Events in quadrant A | 10,240,945 | 348,039 |
| Events in quadrant B | 4,443,011 | 410,445 |
| Events in quadrant C | 3,217,514 | 419,122 |
| Events in quadrant D | 4,074,029 | 400,296 |
| Mode SS | |||
|---|---|---|---|
| Quadrant | BADHDUFLAG | Total packets | Discarded packets |
| A | 0 | 136 | 0 |
| B | 0 | 136 | 0 |
| C | 0 | 136 | 0 |
| D | 0 | 136 | 0 |
| Mode M0 | |||
|---|---|---|---|
| Quadrant | BADHDUFLAG | Total packets | Discarded packets |
| A | 0 | 34973 | 3 |
| B | 0 | 17311 | 2 |
| C | 0 | 13700 | 2 |
| D | 0 | 16326 | 2 |
| Mode M9 | |||
|---|---|---|---|
| Quadrant | BADHDUFLAG | Total packets | Discarded packets |
| A | 0 | 24 | 0 |
| B | 0 | 24 | 0 |
| C | 0 | 24 | 0 |
| D | 0 | 24 | 0 |
| Quadrant | Total seconds | Saturated seconds | Saturation percentage |
|---|---|---|---|
| A | 6523 | 2536 | 38.877817% |
| B | 6523 | 454 | 6.959988% |
| C | 6523 | 169 | 2.590832% |
| D | 6523 | 228 | 3.495324% |
Noise dominated data is calculated using 1-second bins in cleaned event files. If a bin has >2000 counts, and if more than 50% of those come from <1% of pixels, then it is considered to be noise-dominated and hence unusable.
| Quadrant | # 1 sec bins | Bins with >0 counts | Bins with >2000 counts | High rate bins dominated by noise | Noise dominated (total time) | Noise dominated (detector-on time) | Marked lightcurve |
|---|---|---|---|---|---|---|---|
| A | 8938 | 6523 | 1835 | 1835 | 20.53% | 28.13% |  |
| B | 8938 | 6523 | 178 | 178 | 1.99% | 2.73% |  |
| C | 8938 | 6524 | 0 | 0 | 0.00% | 0.00% | 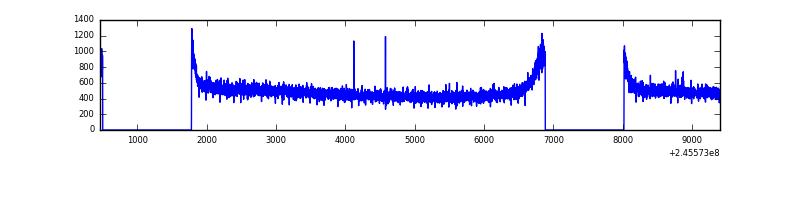 |
| D | 8938 | 6524 | 52 | 52 | 0.58% | 0.80% |  |
Top three noisy pixels from each quadrant. If the there are fewer than three noisy pixels in the level2.evt file, extra rows are filled as -1
| Pixel properties | Quadrant properties | ||||||
|---|---|---|---|---|---|---|---|
| Quadrant | DetID | PixID | Counts | Sigma | Mean | Median | Sigma |
| A | 14 | 238 | 4831932 | 33821.76 | 711 | 696 | 142.8 |
| A | 8 | 5 | 2377681 | 16640.43 | 711 | 696 | 142.8 |
| A | 15 | 174 | 264982 | 1850.17 | 711 | 696 | 142.8 |
| B | 4 | 239 | 1121680 | 7145.25 | 827 | 807 | 156.9 |
| B | 15 | 255 | 31946 | 198.5 | 827 | 807 | 156.9 |
| B | 0 | 187 | 29883 | 185.35 | 827 | 807 | 156.9 |
| C | 13 | 61 | 6015 | 27.56 | 824 | 829 | 188.2 |
| C | 14 | 67 | 5090 | 22.64 | 824 | 829 | 188.2 |
| C | 3 | 202 | 2073 | 6.61 | 824 | 829 | 188.2 |
| D | 11 | 129 | 368321 | 1920.37 | 814 | 794 | 191.4 |
| D | 14 | 34 | 179867 | 935.68 | 814 | 794 | 191.4 |
| D | 1 | 52 | 153777 | 799.35 | 814 | 794 | 191.4 |
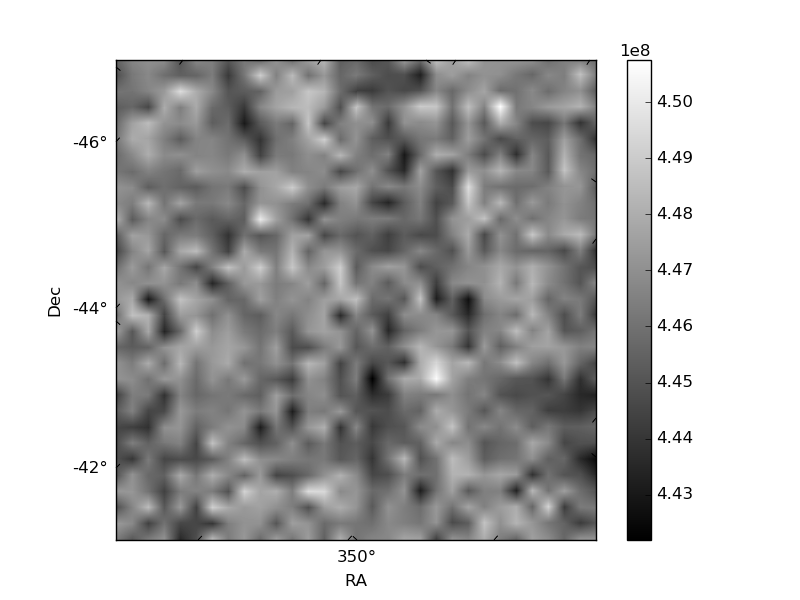
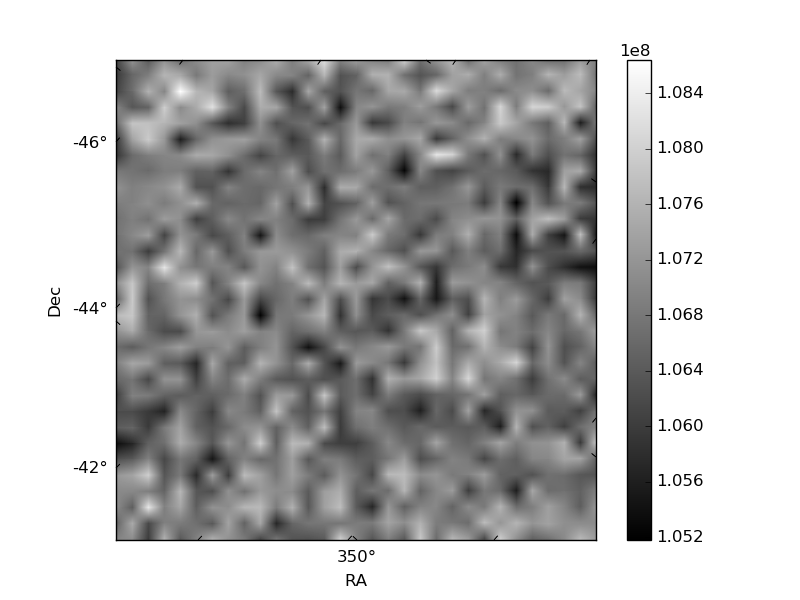
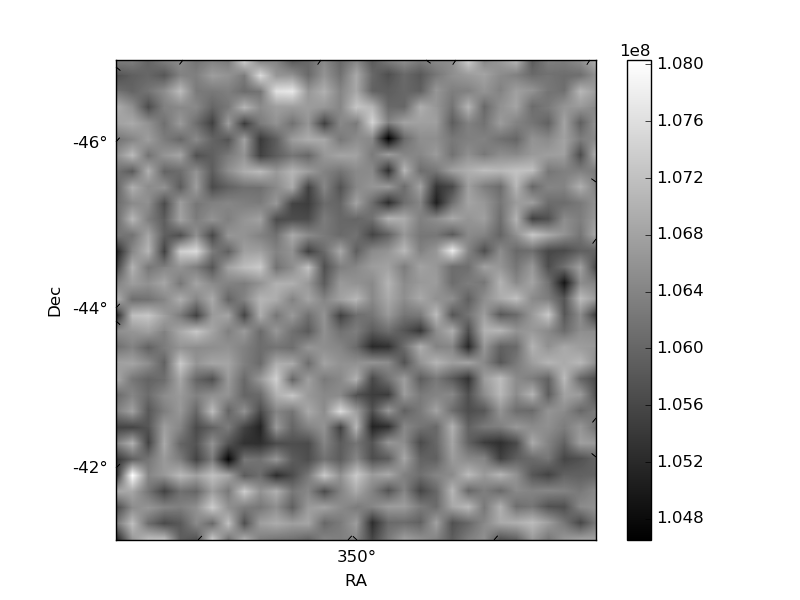
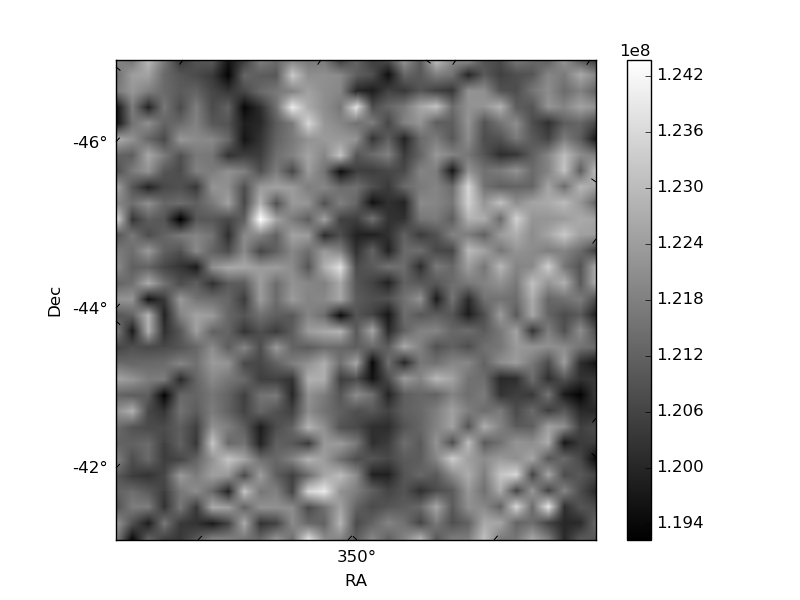
Histogram calculated using DETX and DETY for each event in the final _common_clean file
| Quadrant A | 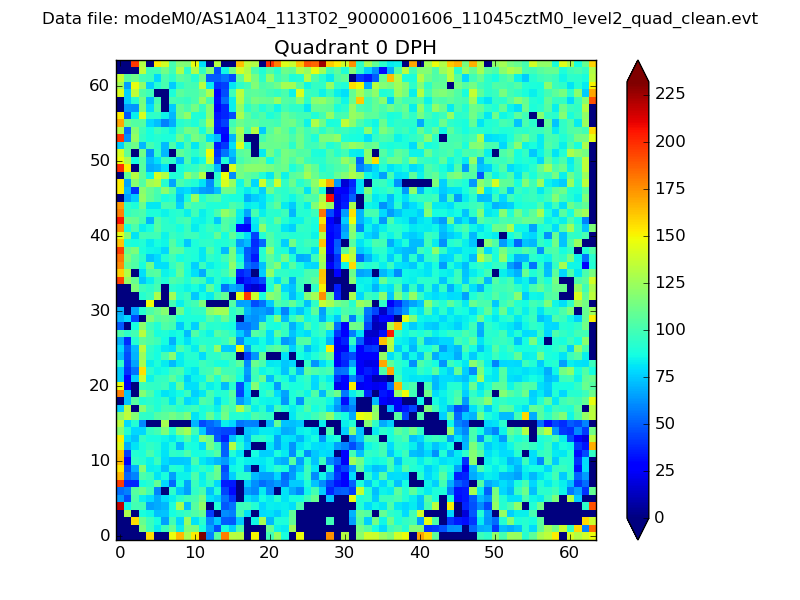 |
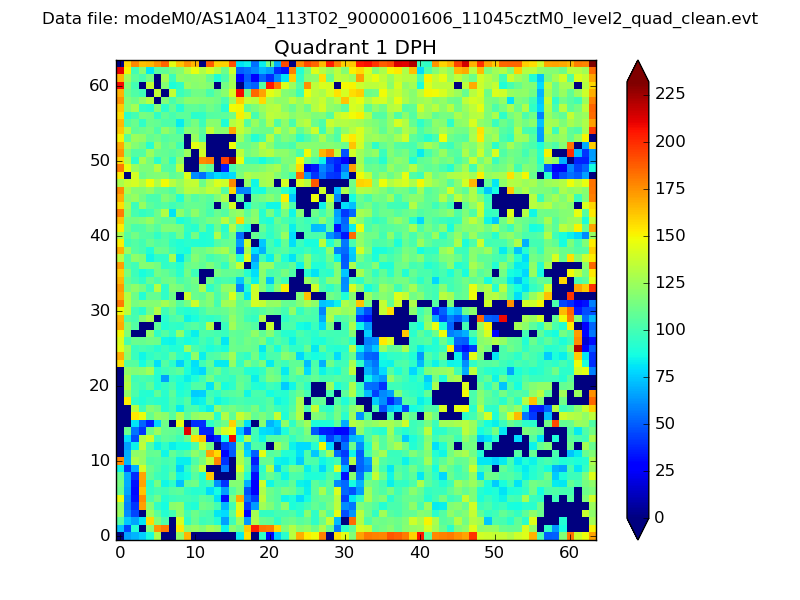 |
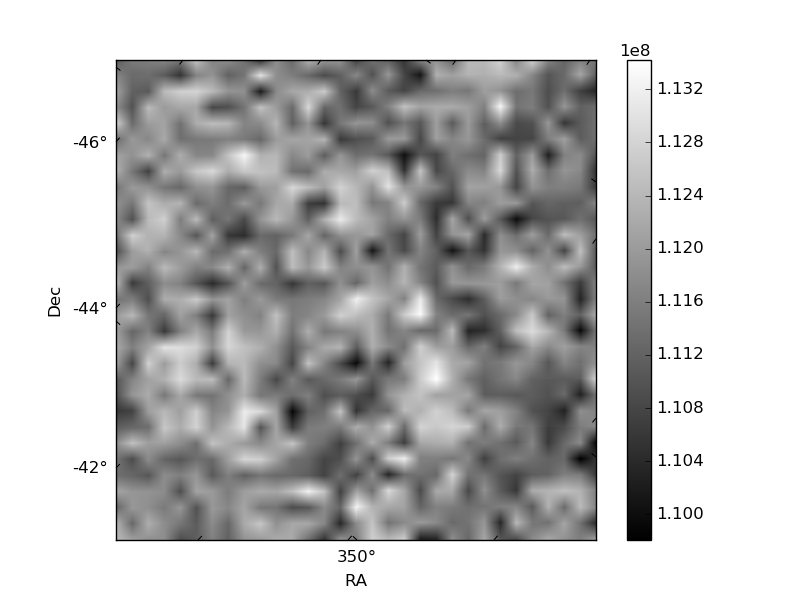
Quadrant B |
|---|---|---|---|
| Quadrant D |  |
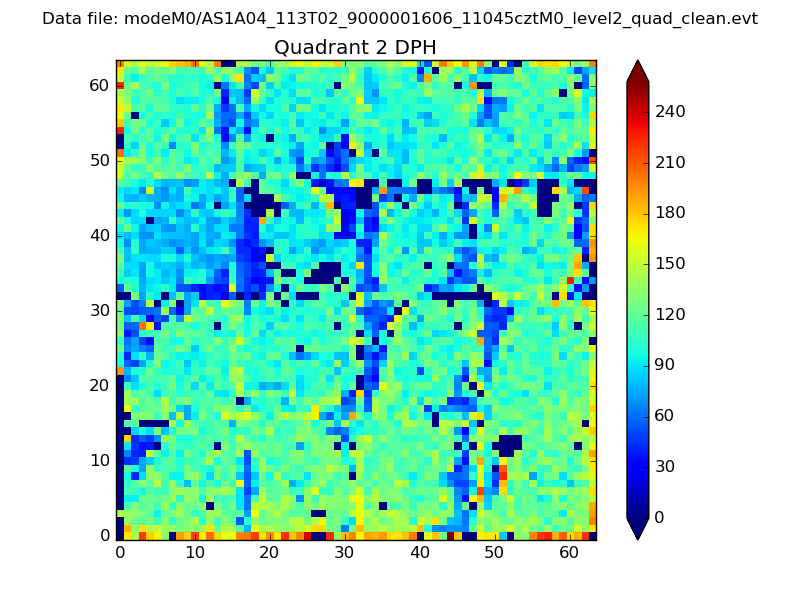 |
Quadrant C |
| Plot type | Count rate plots | Images |
|---|---|---|
| Comparison with Poisson distribution Blue bars denote a histogram of data divided into 1 sec bins. Red curve is a Poisson curve with rate = median count rate of data. |
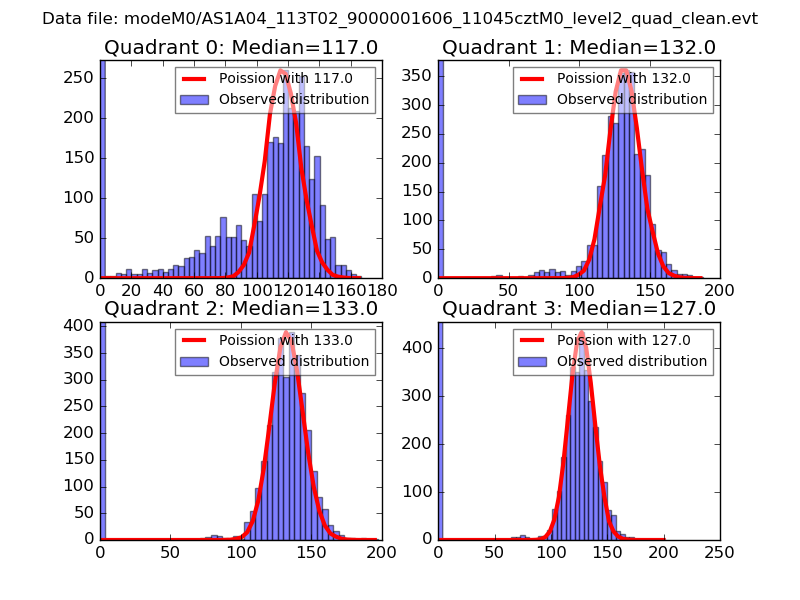 |
 |
| Quadrant-wise count rates Data is divided into 100 sec bins |
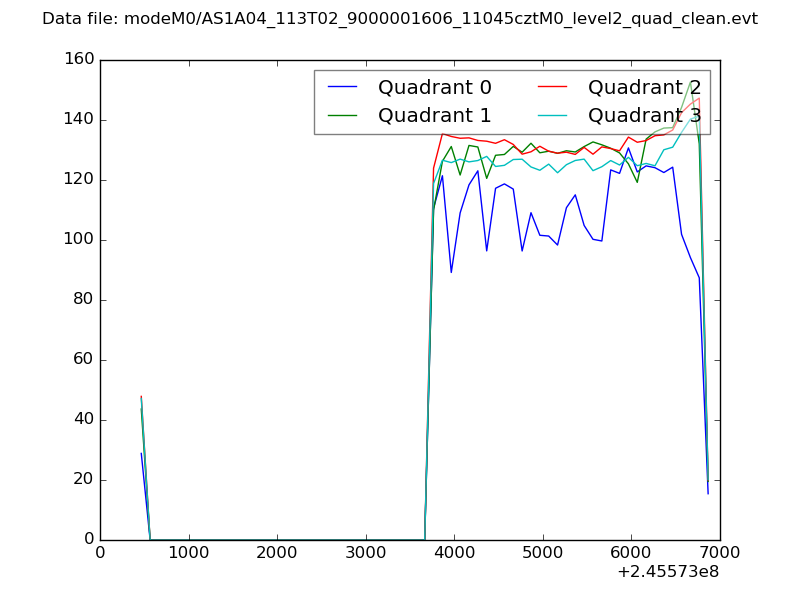 |
|
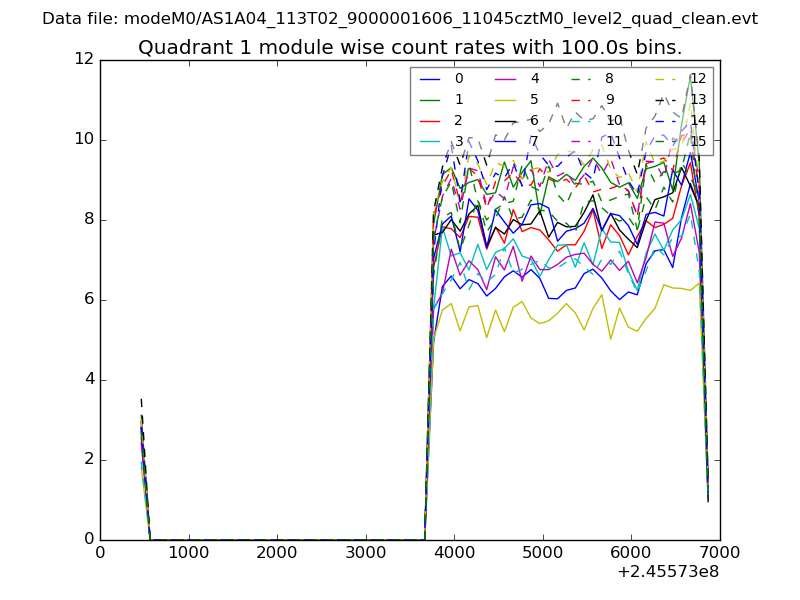
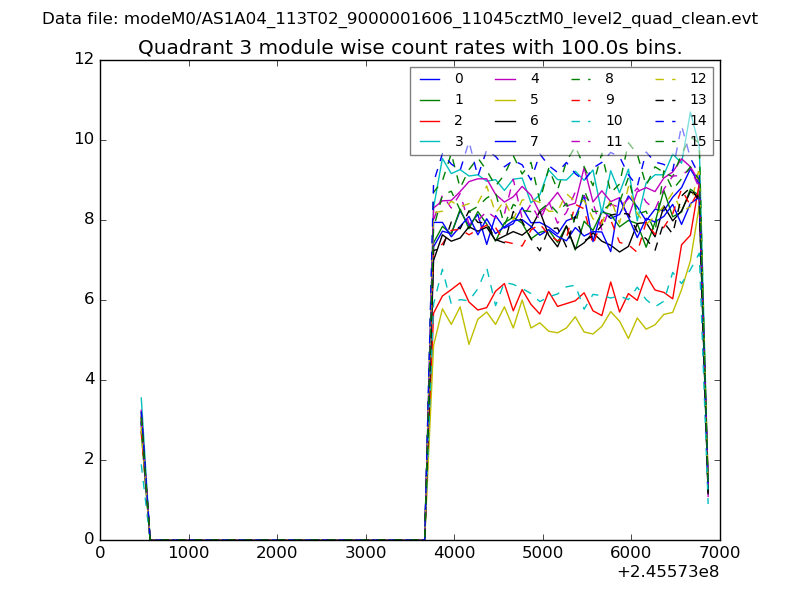
| Module-wise count rates for Quadrant A Data is divided into 100 sec bins |
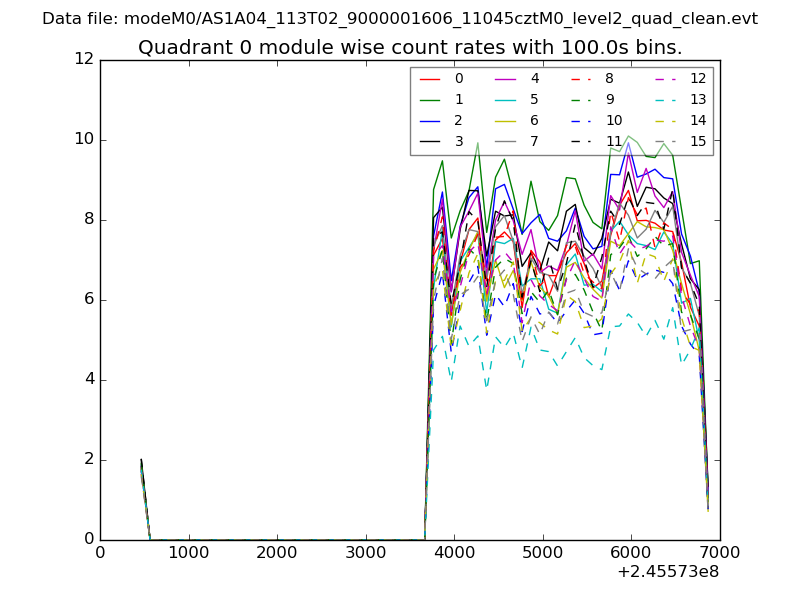 |
 |
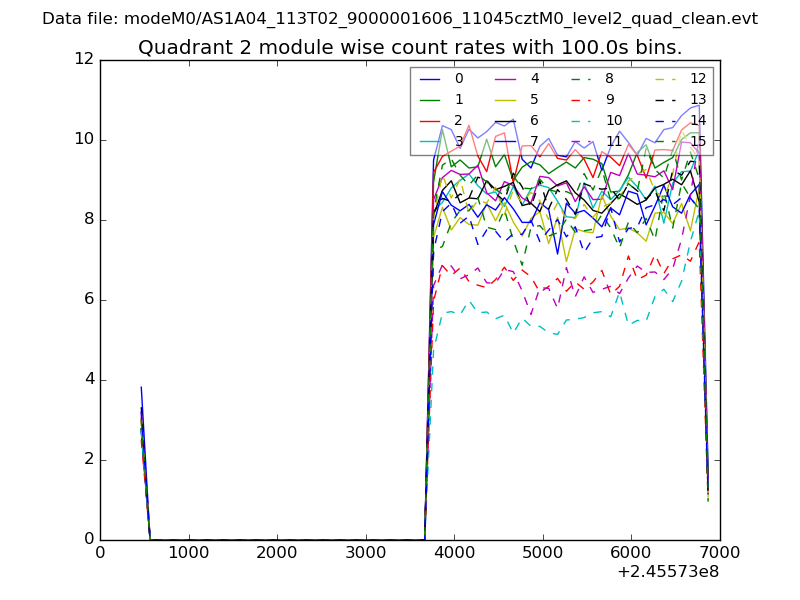
| Module-wise count rates for Quadrant B Data is divided into 100 sec bins |
 |
 |
| Module-wise count rates for Quadrant C Data is divided into 100 sec bins |
 |
 |
| Module-wise count rates for Quadrant D Data is divided into 100 sec bins |
 |
 |
| Parameter | Plot |
|---|---|
| CZT HV Monitor | 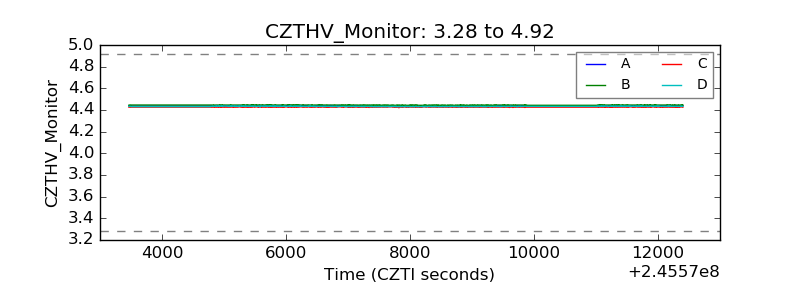 |
| D_VDD | 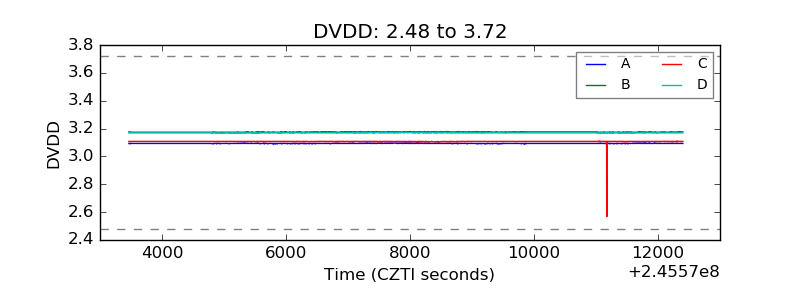 |
| Temperature 1 | 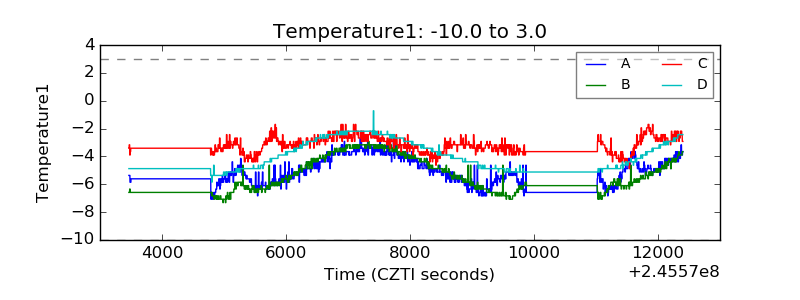 |
| Veto HV Monitor | 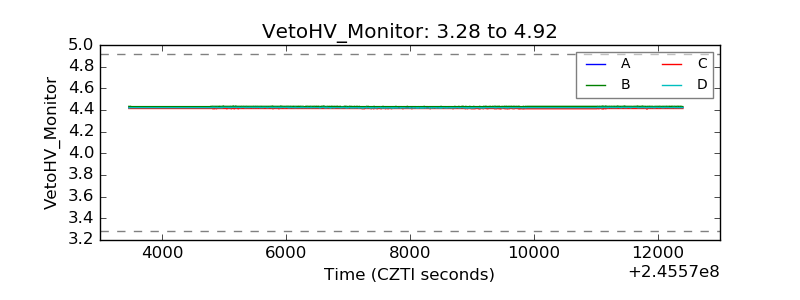 |
| Veto LLD | 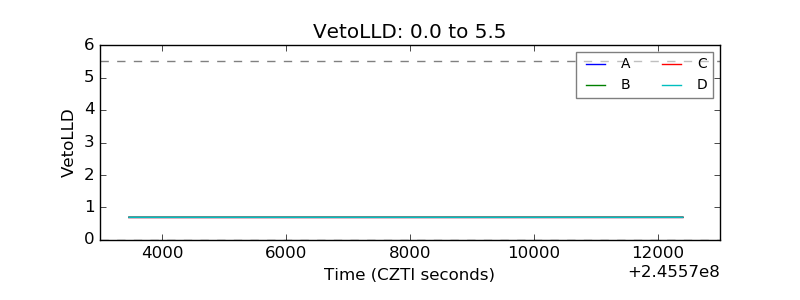 |
| Alpha Counter | 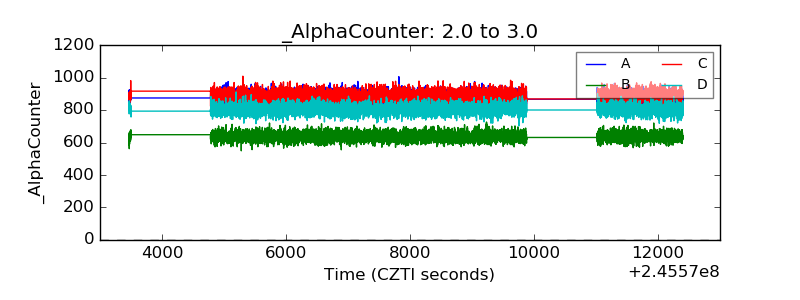 |
| _CPM_Rate | 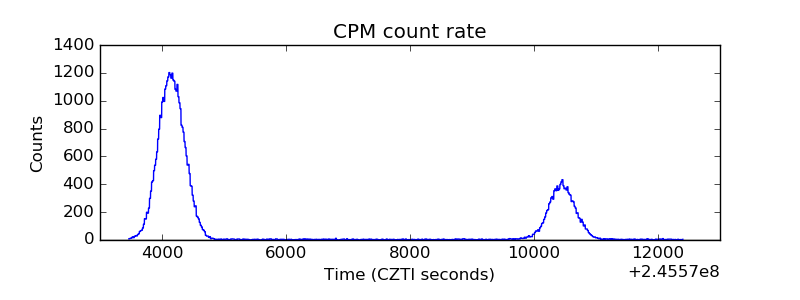 |
| CZT Counter | 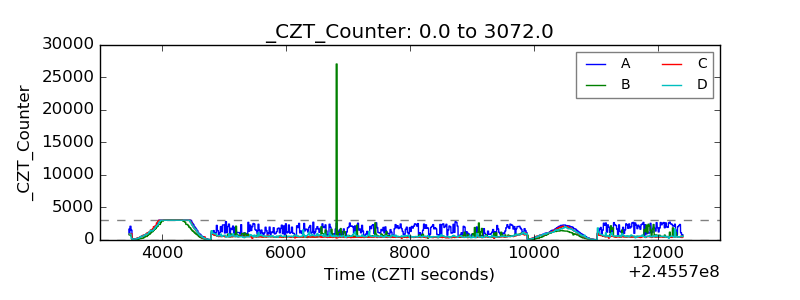 |
| +2.5 Volts monitor | 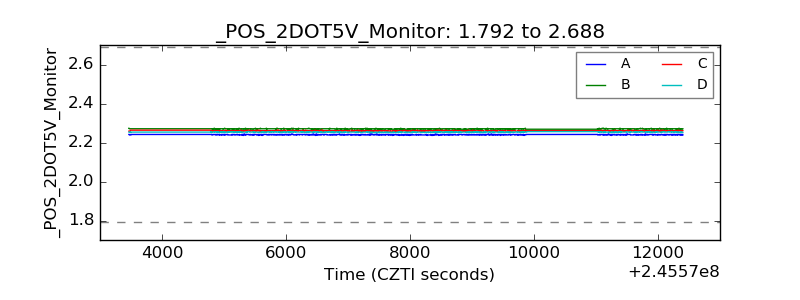 |
| +5 Volts monitor |  |
| _ROLL_ROT | 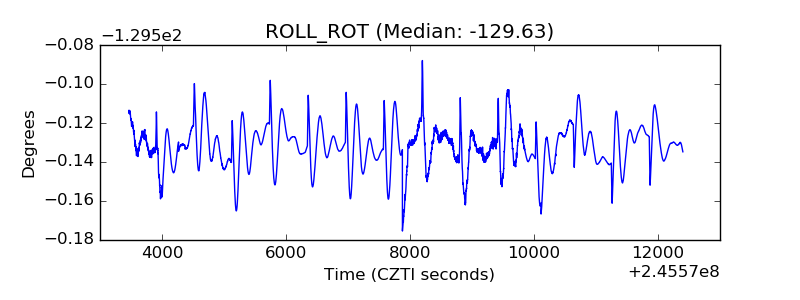 |
| _Roll_DEC | 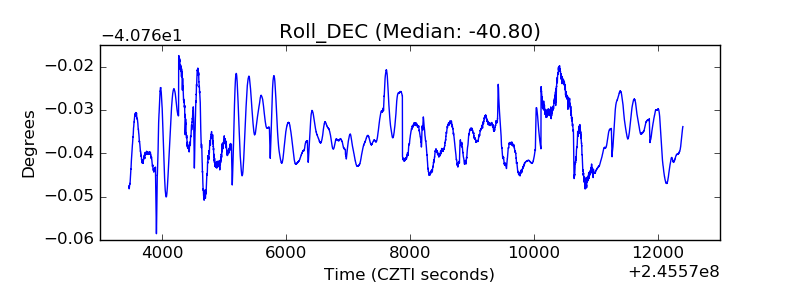 |
| _Roll_RA | 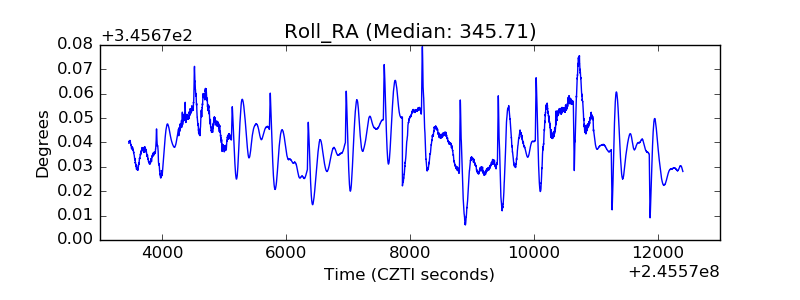 |
| Veto Counter | 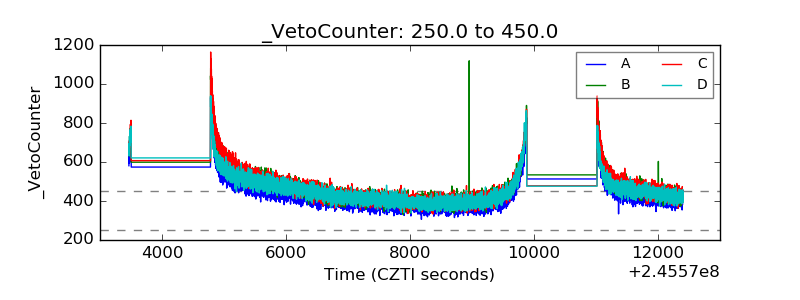 |