| Param | Original file | Final file |
|---|---|---|
| Filename | modeM0/AS1A04_113T02_9000001606_11047cztM0_level2.evt | modeM0/AS1A04_113T02_9000001606_11047cztM0_level2_quad_clean.evt |
| Size (bytes) | 845,974,080 | 96,776,640 |
| Size | 806.8 MB | 92.3 MB |
| Events in quadrant A | 10,492,481 | 558,587 |
| Events in quadrant B | 5,620,021 | 600,426 |
| Events in quadrant C | 3,924,817 | 614,197 |
| Events in quadrant D | 5,030,500 | 588,409 |
| Mode SS | |||
|---|---|---|---|
| Quadrant | BADHDUFLAG | Total packets | Discarded packets |
| A | 0 | 170 | 0 |
| B | 0 | 170 | 0 |
| C | 0 | 170 | 0 |
| D | 0 | 170 | 0 |
| Mode M0 | |||
|---|---|---|---|
| Quadrant | BADHDUFLAG | Total packets | Discarded packets |
| A | 0 | 36965 | 3 |
| B | 0 | 21998 | 2 |
| C | 0 | 17334 | 2 |
| D | 0 | 19840 | 2 |
| Mode M9 | |||
|---|---|---|---|
| Quadrant | BADHDUFLAG | Total packets | Discarded packets |
| A | 0 | 10 | 0 |
| B | 0 | 10 | 0 |
| C | 0 | 10 | 0 |
| D | 0 | 10 | 0 |
| Quadrant | Total seconds | Saturated seconds | Saturation percentage |
|---|---|---|---|
| A | 8180 | 1917 | 23.435208% |
| B | 8180 | 768 | 9.388753% |
| C | 8180 | 252 | 3.080685% |
| D | 8180 | 407 | 4.975550% |
Noise dominated data is calculated using 1-second bins in cleaned event files. If a bin has >2000 counts, and if more than 50% of those come from <1% of pixels, then it is considered to be noise-dominated and hence unusable.
| Quadrant | # 1 sec bins | Bins with >0 counts | Bins with >2000 counts | High rate bins dominated by noise | Noise dominated (total time) | Noise dominated (detector-on time) | Marked lightcurve |
|---|---|---|---|---|---|---|---|
| A | 9184 | 8179 | 1014 | 1014 | 11.04% | 12.40% | 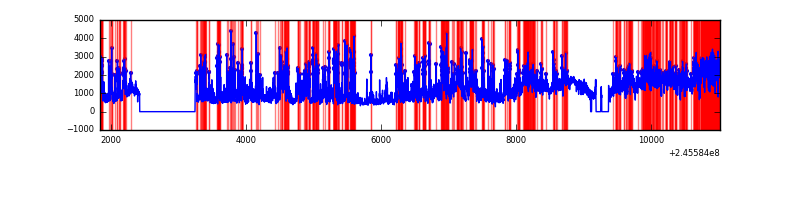 |
| B | 9185 | 8182 | 240 | 240 | 2.61% | 2.93% | 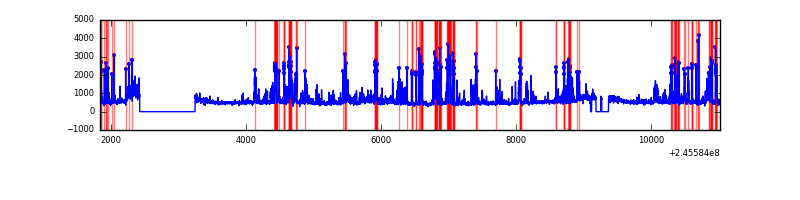 |
| C | 9185 | 8183 | 0 | 0 | 0.00% | 0.00% | 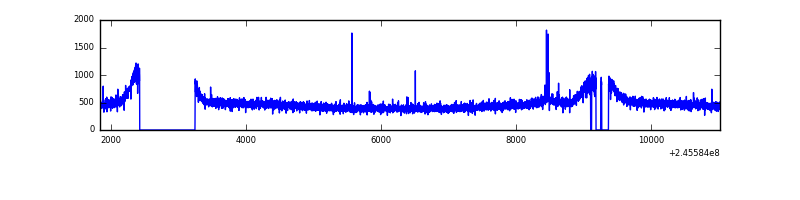 |
| D | 9185 | 8182 | 97 | 97 | 1.06% | 1.19% |  |
Top three noisy pixels from each quadrant. If the there are fewer than three noisy pixels in the level2.evt file, extra rows are filled as -1
| Pixel properties | Quadrant properties | ||||||
|---|---|---|---|---|---|---|---|
| Quadrant | DetID | PixID | Counts | Sigma | Mean | Median | Sigma |
| A | 15 | 174 | 2952707 | 15037.61 | 955 | 931 | 196.3 |
| A | 14 | 238 | 2797808 | 14248.49 | 955 | 931 | 196.3 |
| A | 8 | 5 | 1037942 | 5282.98 | 955 | 931 | 196.3 |
| B | 4 | 239 | 1535139 | 7941.0 | 1000 | 974 | 193.2 |
| B | 10 | 244 | 61580 | 313.7 | 1000 | 974 | 193.2 |
| B | 11 | 51 | 31264 | 156.78 | 1000 | 974 | 193.2 |
| C | 9 | 54 | 13942 | 55.75 | 1000 | 1002 | 232.1 |
| C | 13 | 61 | 7352 | 27.36 | 1000 | 1002 | 232.1 |
| C | 8 | 128 | 5127 | 17.77 | 1000 | 1002 | 232.1 |
| D | 8 | 195 | 632292 | 2622.95 | 998 | 970 | 240.7 |
| D | 7 | 71 | 165907 | 685.26 | 998 | 970 | 240.7 |
| D | 11 | 129 | 86223 | 354.2 | 998 | 970 | 240.7 |
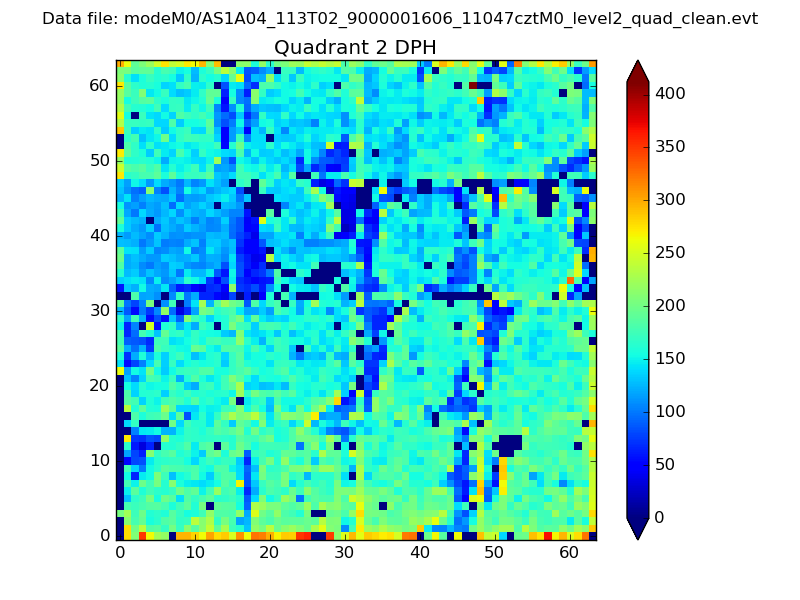
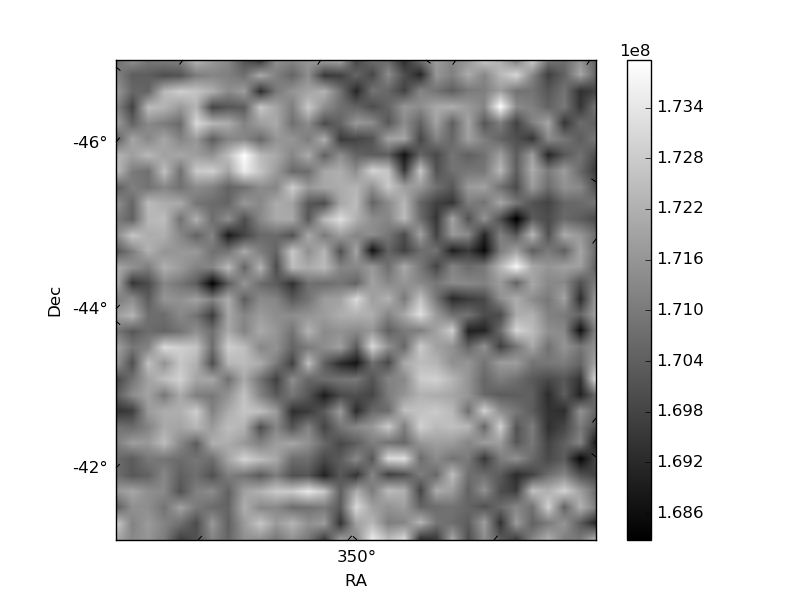
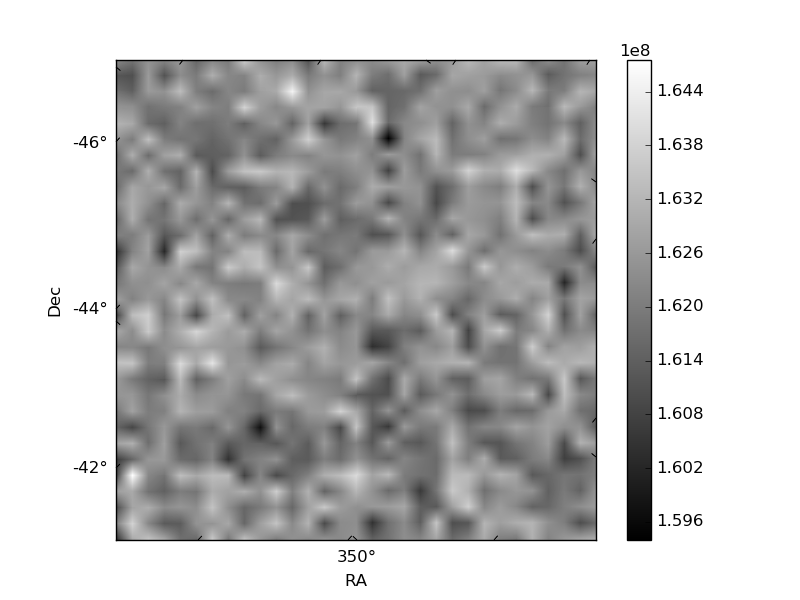
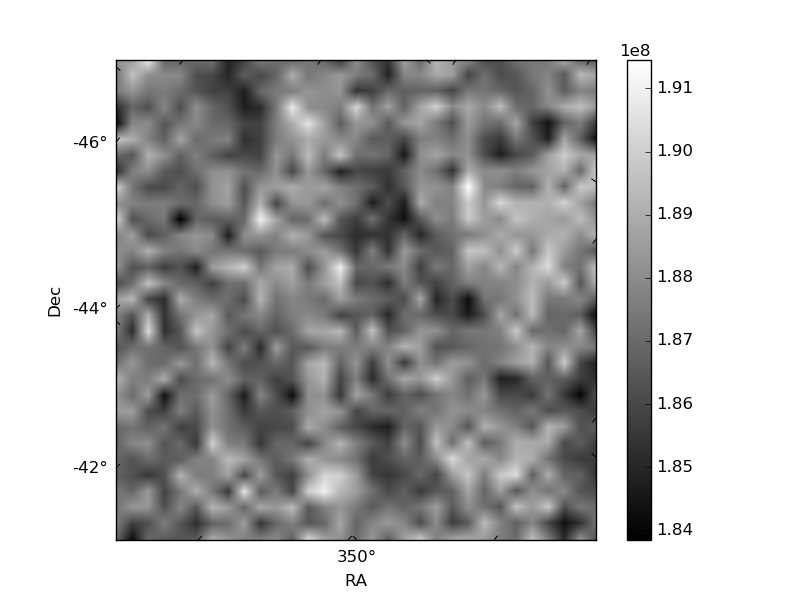
Histogram calculated using DETX and DETY for each event in the final _common_clean file
| Quadrant A |  |
 |
Quadrant B |
|---|---|---|---|
| Quadrant D | 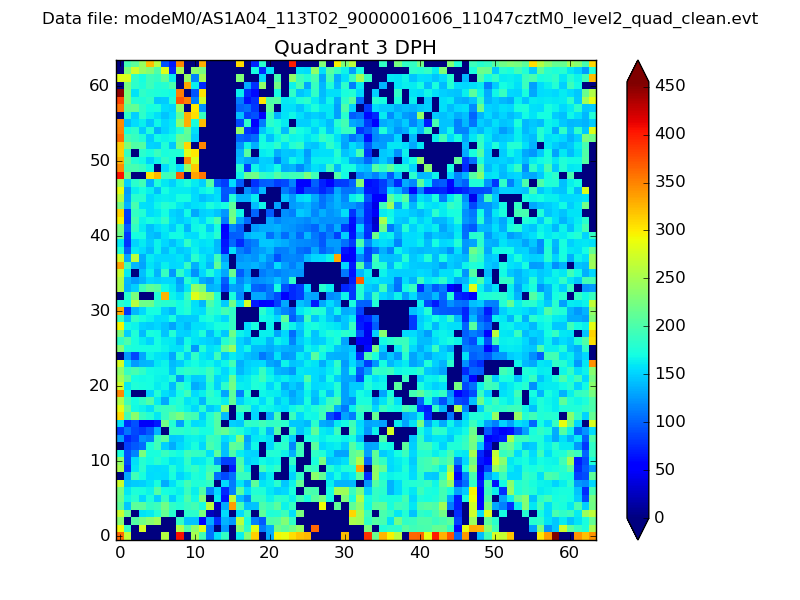 |
 |
Quadrant C |
| Plot type | Count rate plots | Images |
|---|---|---|
| Comparison with Poisson distribution Blue bars denote a histogram of data divided into 1 sec bins. Red curve is a Poisson curve with rate = median count rate of data. |
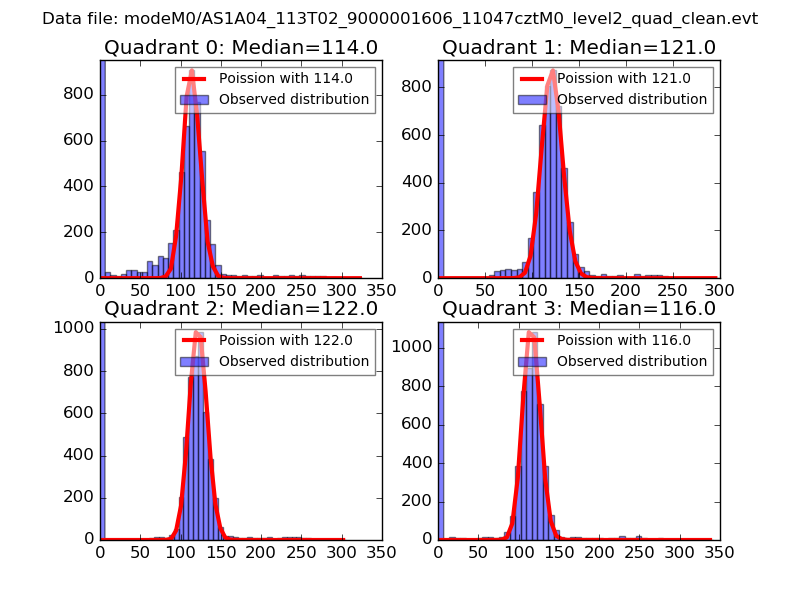 |
 |
| Quadrant-wise count rates Data is divided into 100 sec bins |
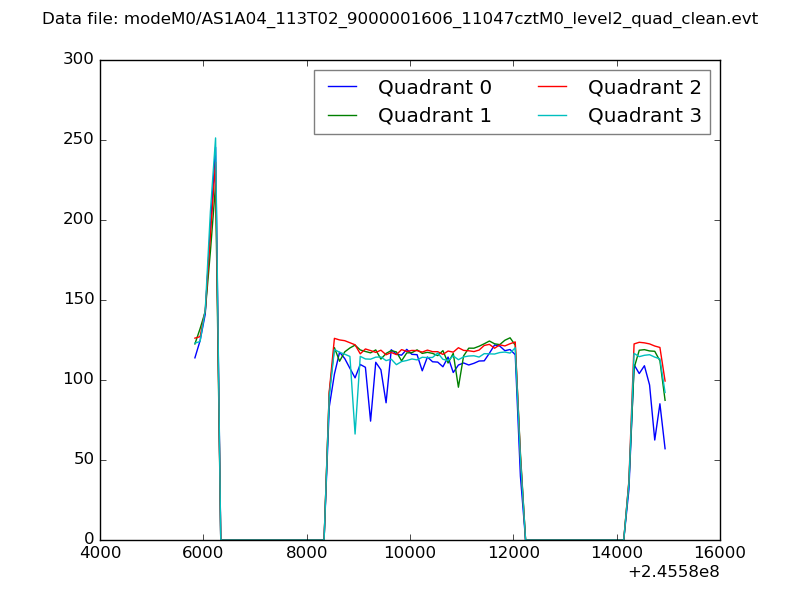 |
|
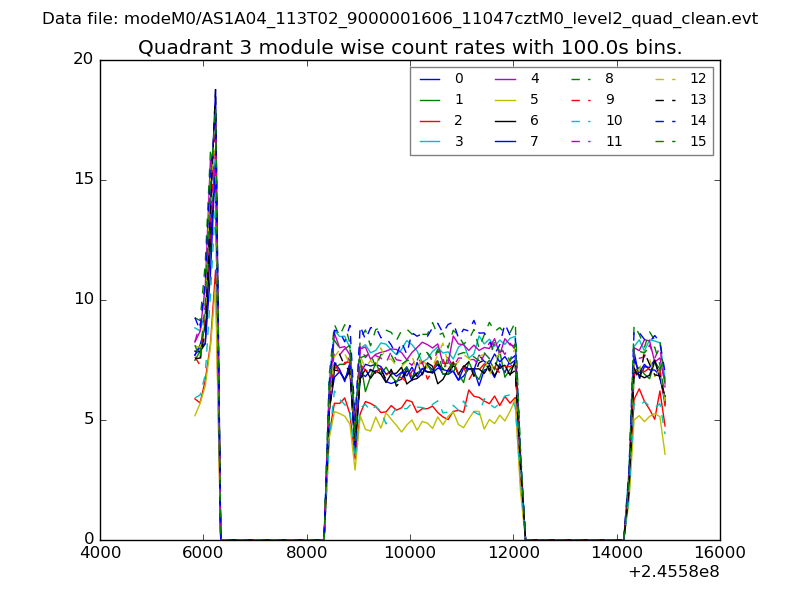
| Module-wise count rates for Quadrant A Data is divided into 100 sec bins |
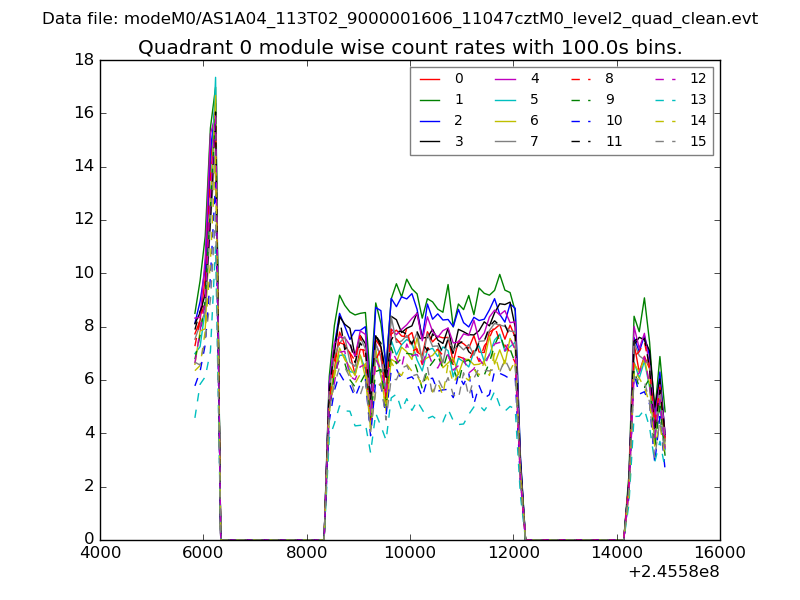 |
 |
| Module-wise count rates for Quadrant B Data is divided into 100 sec bins |
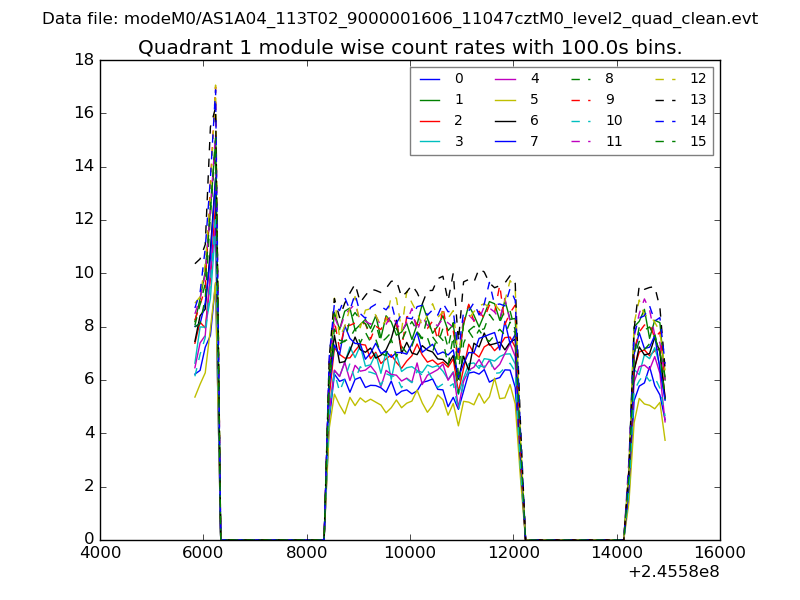 |
 |
| Module-wise count rates for Quadrant C Data is divided into 100 sec bins |
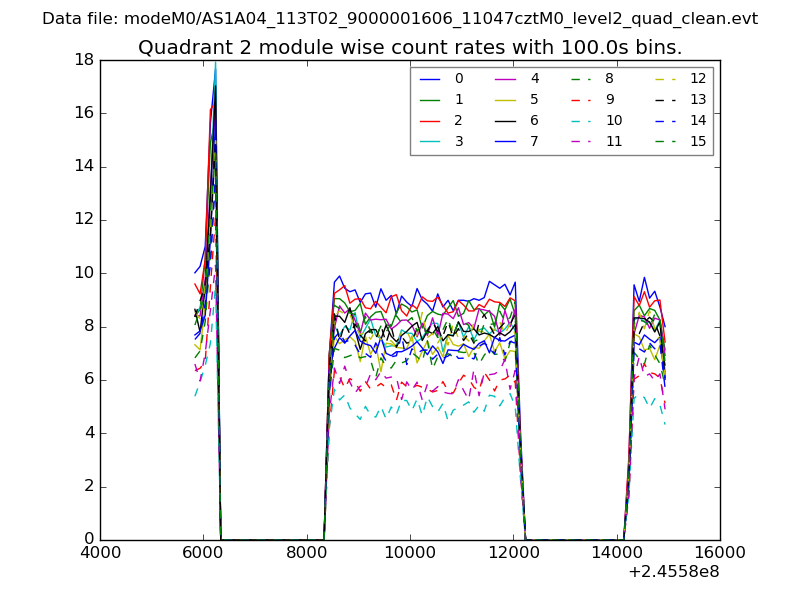 |
 |
| Module-wise count rates for Quadrant D Data is divided into 100 sec bins |
 |
 |
| Parameter | Plot |
|---|---|
| CZT HV Monitor | 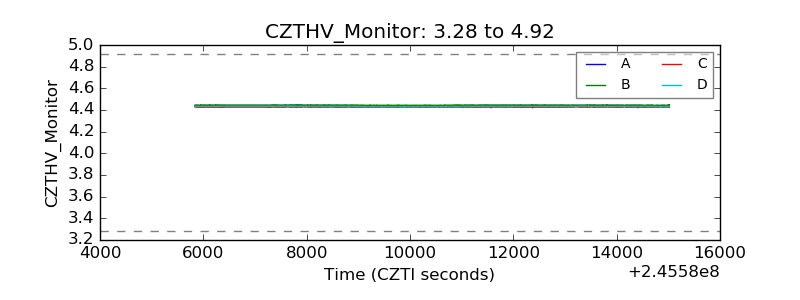 |
| D_VDD | 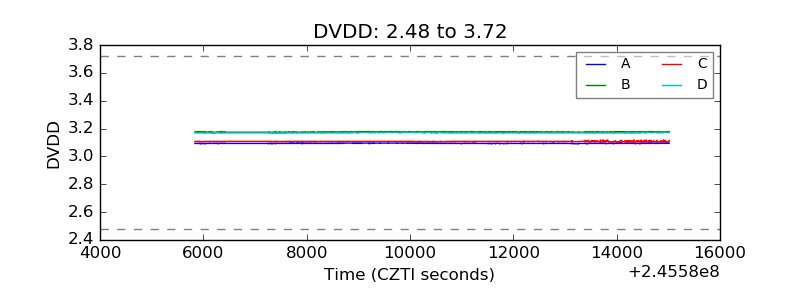 |
| Temperature 1 | 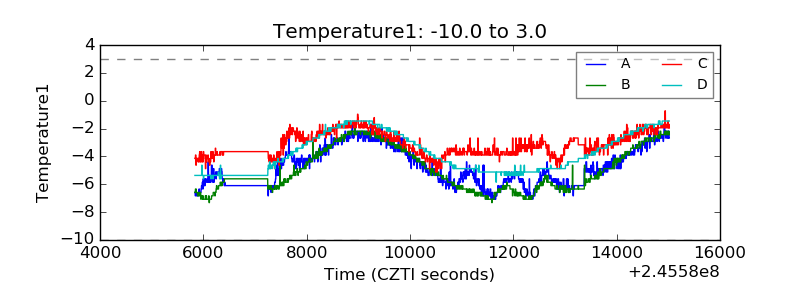 |
| Veto HV Monitor | 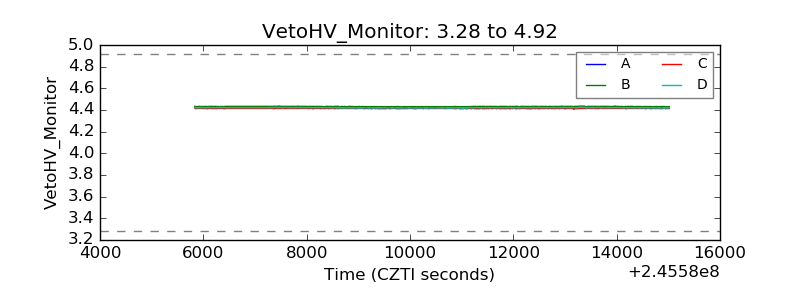 |
| Veto LLD |  |
| Alpha Counter | 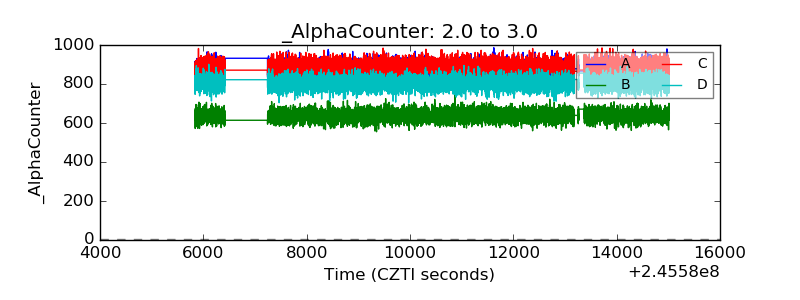 |
| _CPM_Rate | 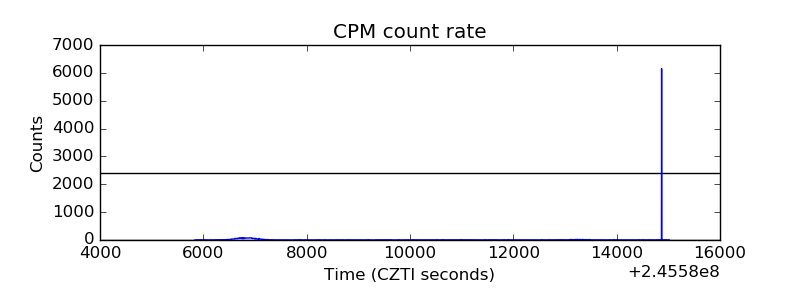 |
| CZT Counter | 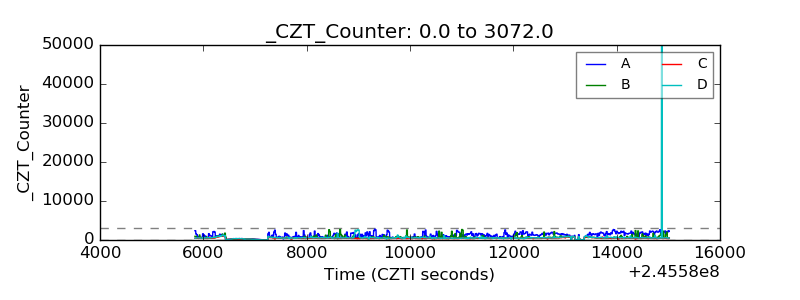 |
| +2.5 Volts monitor | 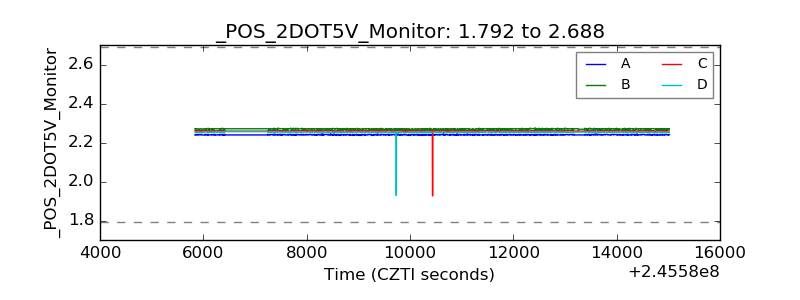 |
| +5 Volts monitor |  |
| _ROLL_ROT | 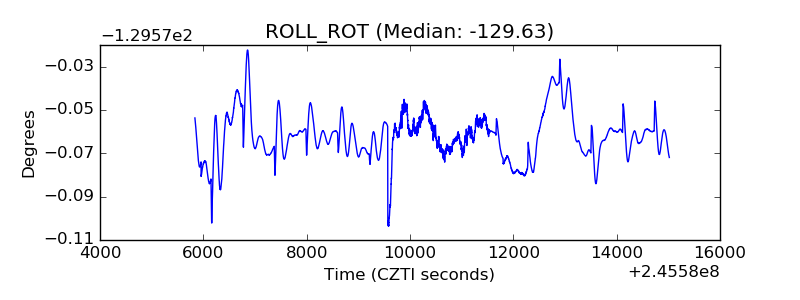 |
| _Roll_DEC | 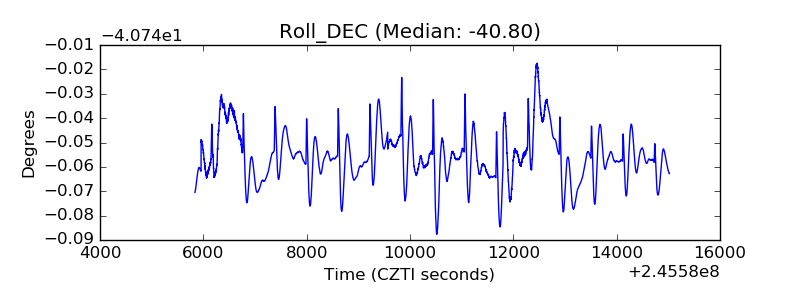 |
| _Roll_RA | 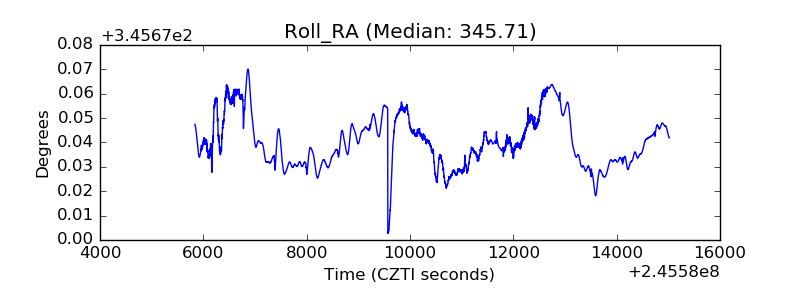 |
| Veto Counter | 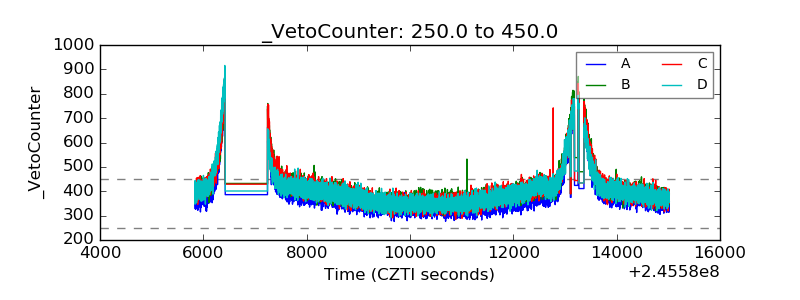 |