| Param | Original file | Final file |
|---|---|---|
| Filename | modeM0/AS1A04_113T02_9000001606_11048cztM0_level2.evt | modeM0/AS1A04_113T02_9000001606_11048cztM0_level2_quad_clean.evt |
| Size (bytes) | 811,146,240 | 87,984,000 |
| Size | 773.6 MB | 83.9 MB |
| Events in quadrant A | 11,070,548 | 472,440 |
| Events in quadrant B | 5,047,121 | 559,576 |
| Events in quadrant C | 3,368,906 | 571,837 |
| Events in quadrant D | 4,579,351 | 544,834 |
| Mode SS | |||
|---|---|---|---|
| Quadrant | BADHDUFLAG | Total packets | Discarded packets |
| A | 0 | 148 | 0 |
| B | 0 | 148 | 0 |
| C | 0 | 148 | 0 |
| D | 0 | 148 | 0 |
| Mode M0 | |||
|---|---|---|---|
| Quadrant | BADHDUFLAG | Total packets | Discarded packets |
| A | 0 | 38007 | 1 |
| B | 0 | 19906 | 0 |
| C | 0 | 15258 | 0 |
| D | 0 | 18144 | 0 |
| Quadrant | Total seconds | Saturated seconds | Saturation percentage |
|---|---|---|---|
| A | 7395 | 2695 | 36.443543% |
| B | 7395 | 435 | 5.882353% |
| C | 7395 | 30 | 0.405680% |
| D | 7395 | 146 | 1.974307% |
Noise dominated data is calculated using 1-second bins in cleaned event files. If a bin has >2000 counts, and if more than 50% of those come from <1% of pixels, then it is considered to be noise-dominated and hence unusable.
| Quadrant | # 1 sec bins | Bins with >0 counts | Bins with >2000 counts | High rate bins dominated by noise | Noise dominated (total time) | Noise dominated (detector-on time) | Marked lightcurve |
|---|---|---|---|---|---|---|---|
| A | 7394 | 7394 | 1988 | 1988 | 26.89% | 26.89% | 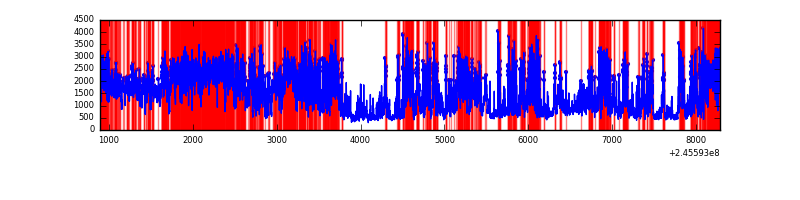 |
| B | 7395 | 7395 | 211 | 211 | 2.85% | 2.85% | 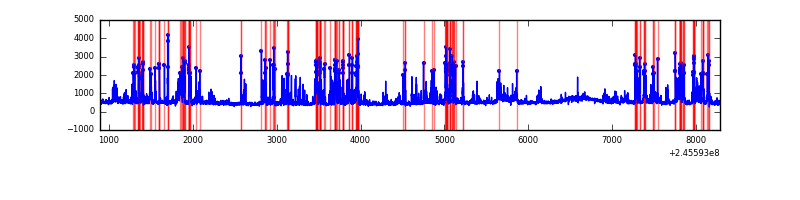 |
| C | 7395 | 7395 | 0 | 0 | 0.00% | 0.00% | 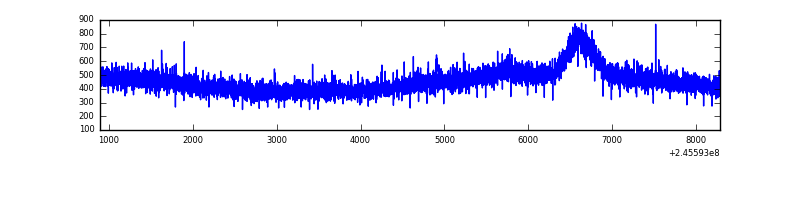 |
| D | 7395 | 7395 | 88 | 88 | 1.19% | 1.19% | 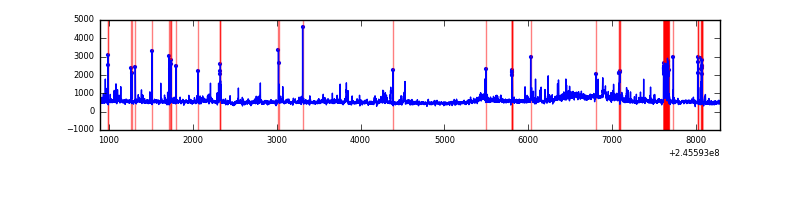 |
Top three noisy pixels from each quadrant. If the there are fewer than three noisy pixels in the level2.evt file, extra rows are filled as -1
| Pixel properties | Quadrant properties | ||||||
|---|---|---|---|---|---|---|---|
| Quadrant | DetID | PixID | Counts | Sigma | Mean | Median | Sigma |
| A | 14 | 238 | 5984460 | 37188.88 | 781 | 763 | 160.9 |
| A | 15 | 174 | 2023756 | 12572.97 | 781 | 763 | 160.9 |
| A | 8 | 5 | 43174 | 263.59 | 781 | 763 | 160.9 |
| B | 4 | 239 | 1520423 | 9086.64 | 870 | 846 | 167.2 |
| B | 0 | 214 | 48378 | 284.23 | 870 | 846 | 167.2 |
| B | 15 | 204 | 33394 | 194.63 | 870 | 846 | 167.2 |
| C | 8 | 128 | 14023 | 66.05 | 856 | 858 | 199.3 |
| C | 8 | 112 | 7582 | 33.74 | 856 | 858 | 199.3 |
| C | 9 | 54 | 7135 | 31.49 | 856 | 858 | 199.3 |
| D | 8 | 195 | 607418 | 2963.94 | 850 | 825 | 204.7 |
| D | 1 | 52 | 323307 | 1575.72 | 850 | 825 | 204.7 |
| D | 11 | 129 | 156269 | 759.53 | 850 | 825 | 204.7 |
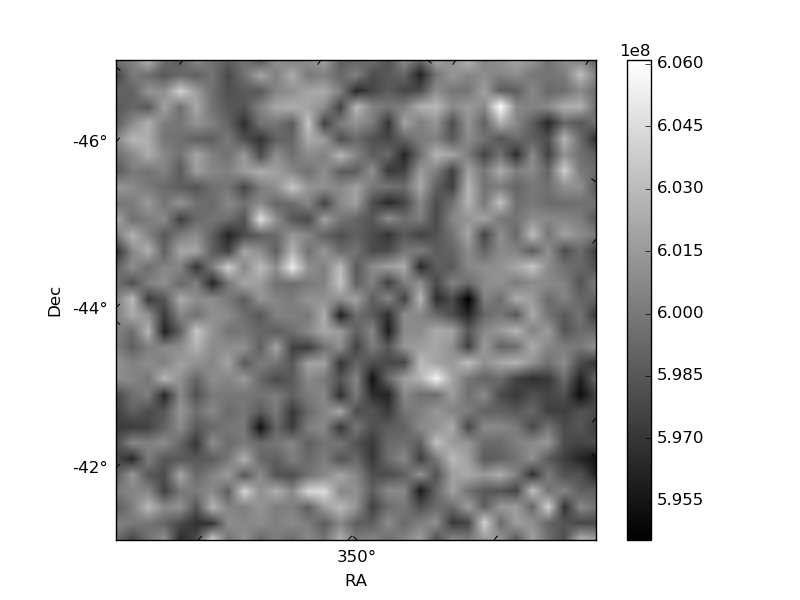
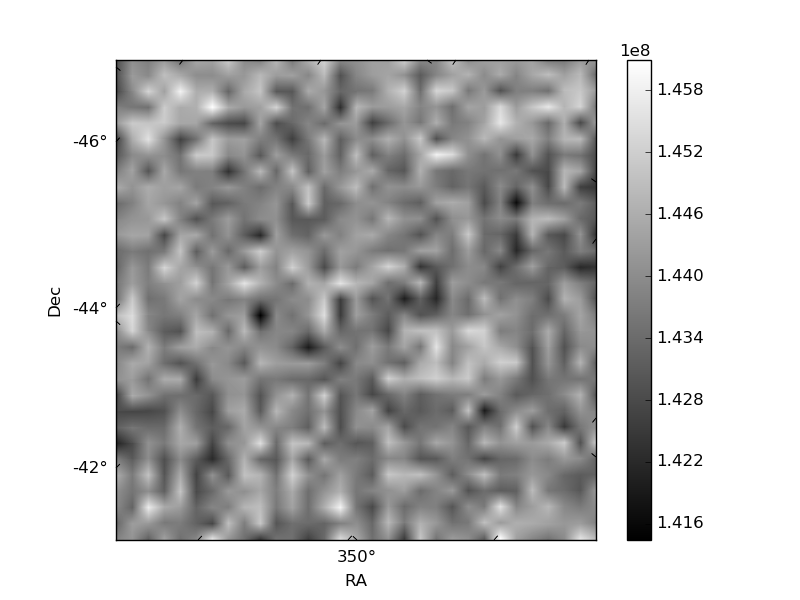
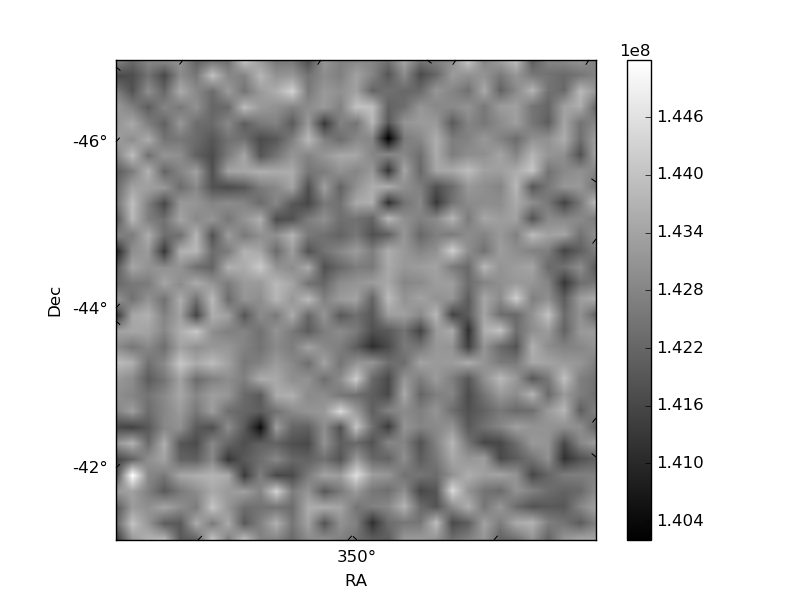
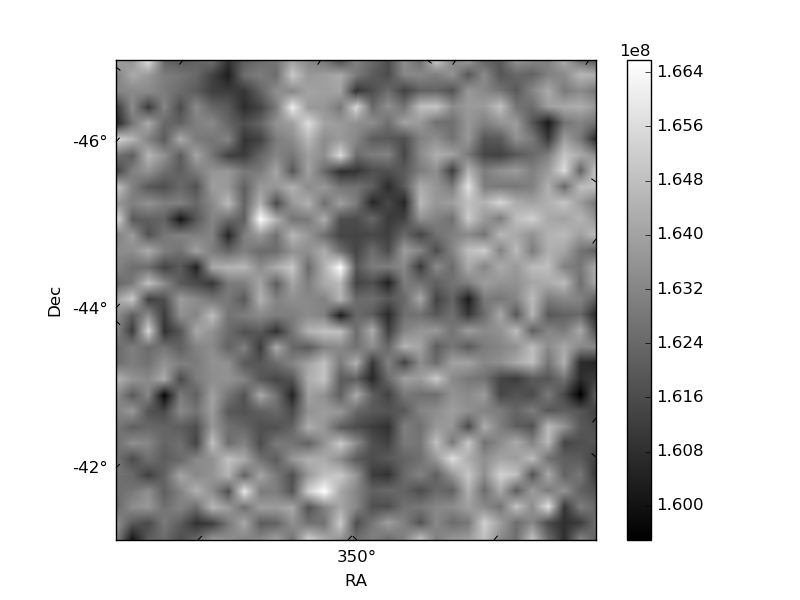
Histogram calculated using DETX and DETY for each event in the final _common_clean file
| Quadrant A | 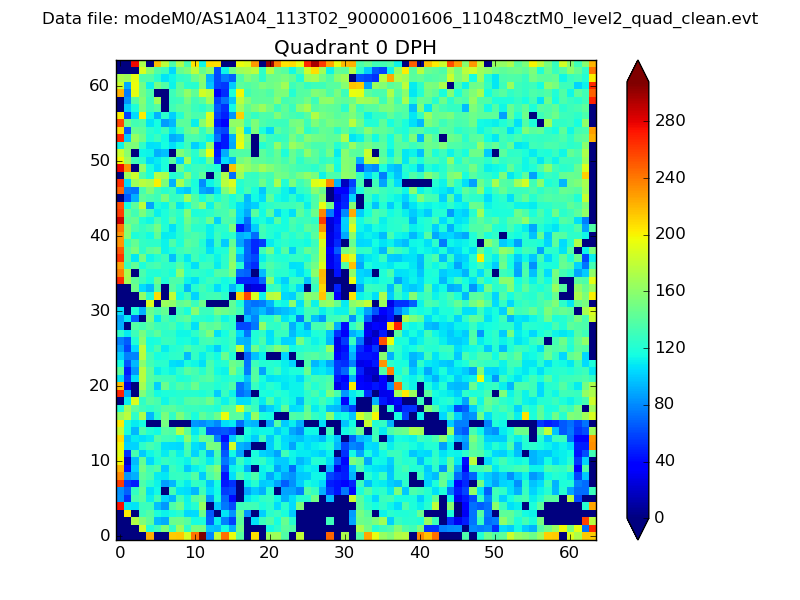 |
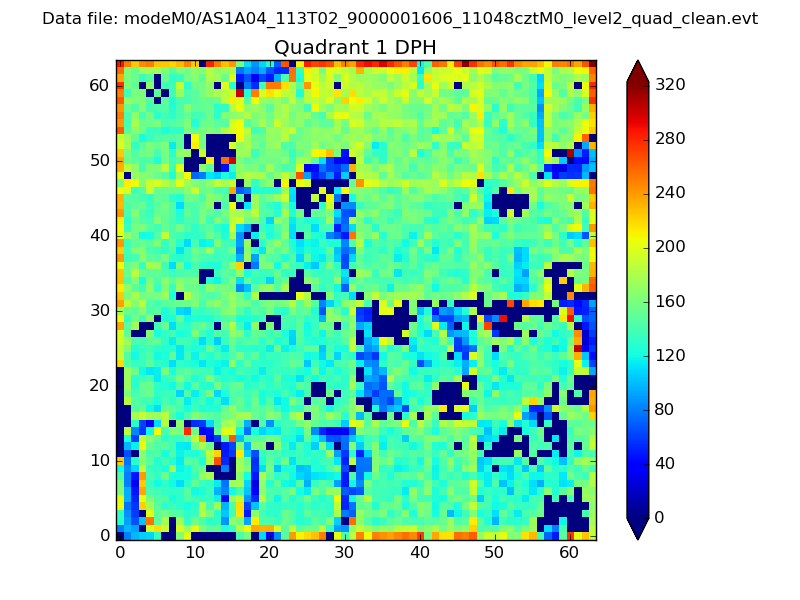 |
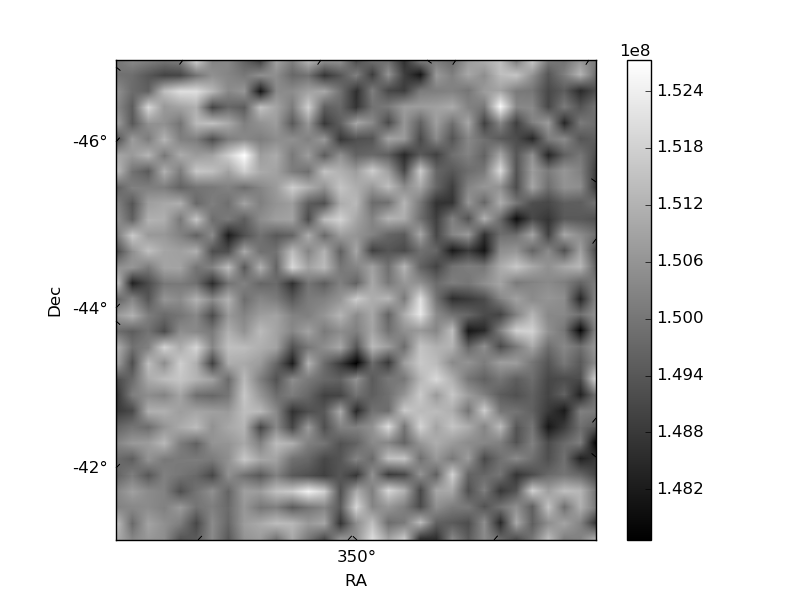
Quadrant B |
|---|---|---|---|
| Quadrant D | 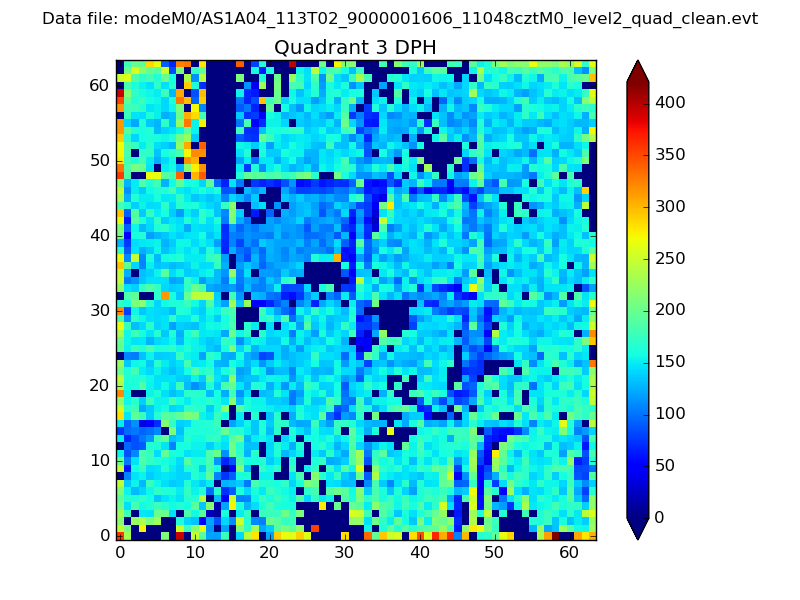 |
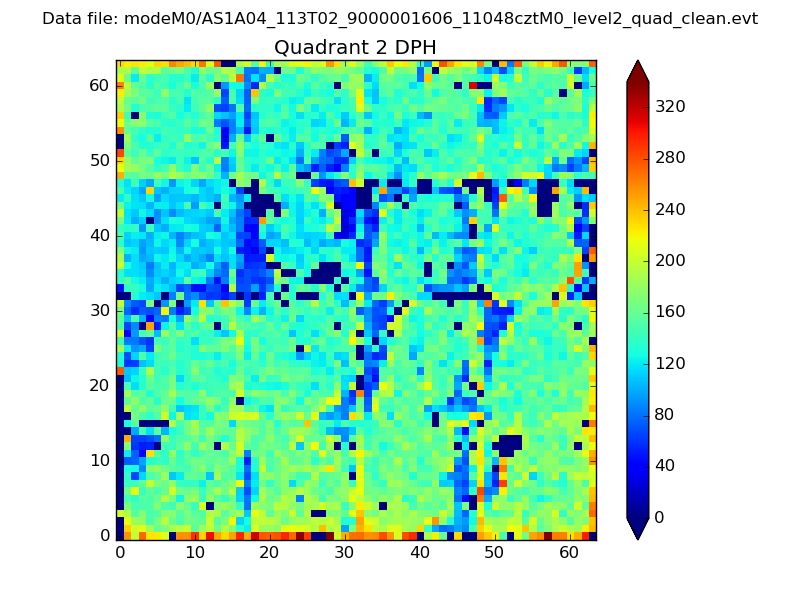 |
Quadrant C |
| Plot type | Count rate plots | Images |
|---|---|---|
| Comparison with Poisson distribution Blue bars denote a histogram of data divided into 1 sec bins. Red curve is a Poisson curve with rate = median count rate of data. |
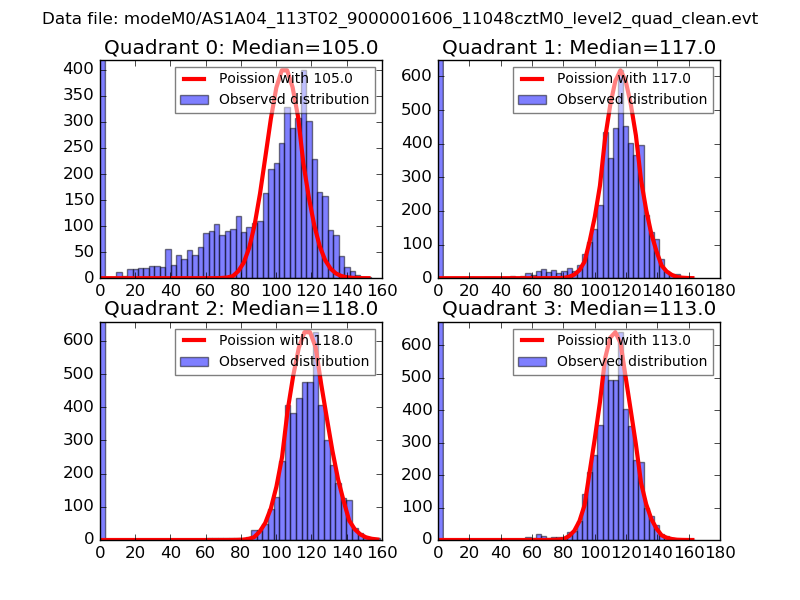 |
 |
| Quadrant-wise count rates Data is divided into 100 sec bins |
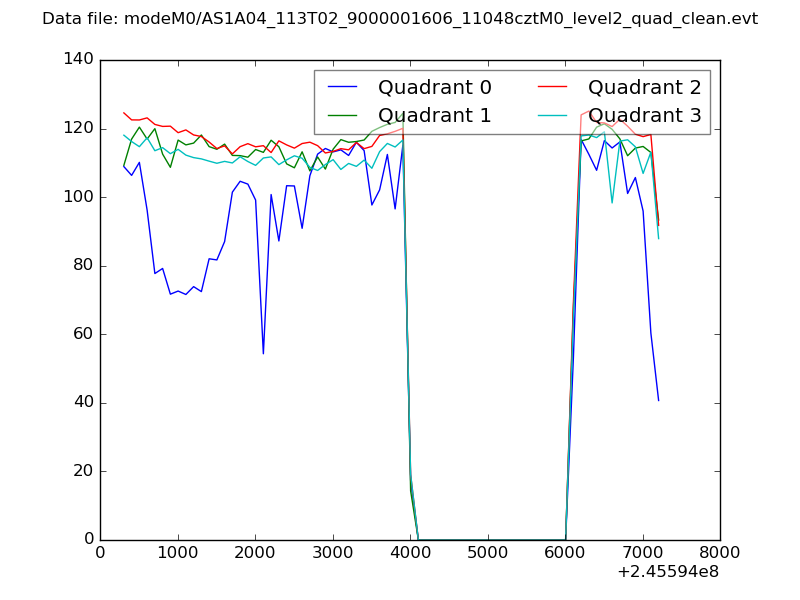 |
|
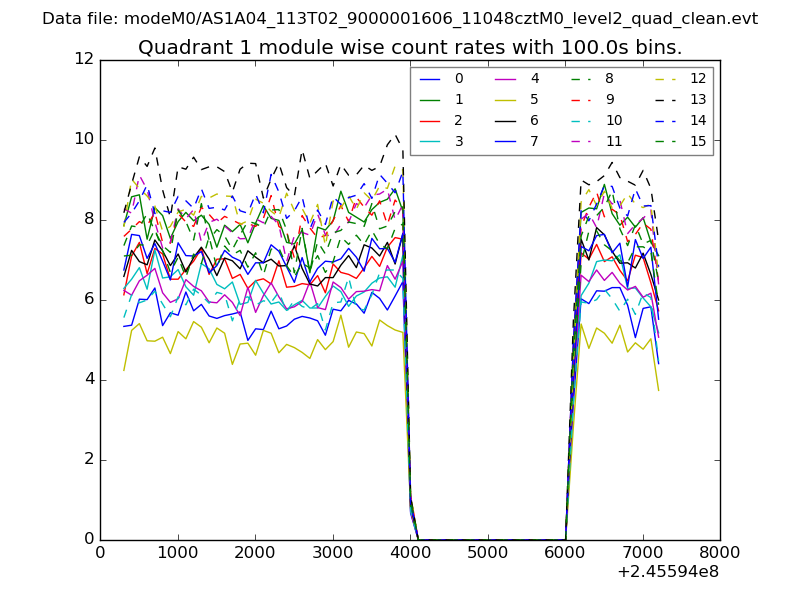
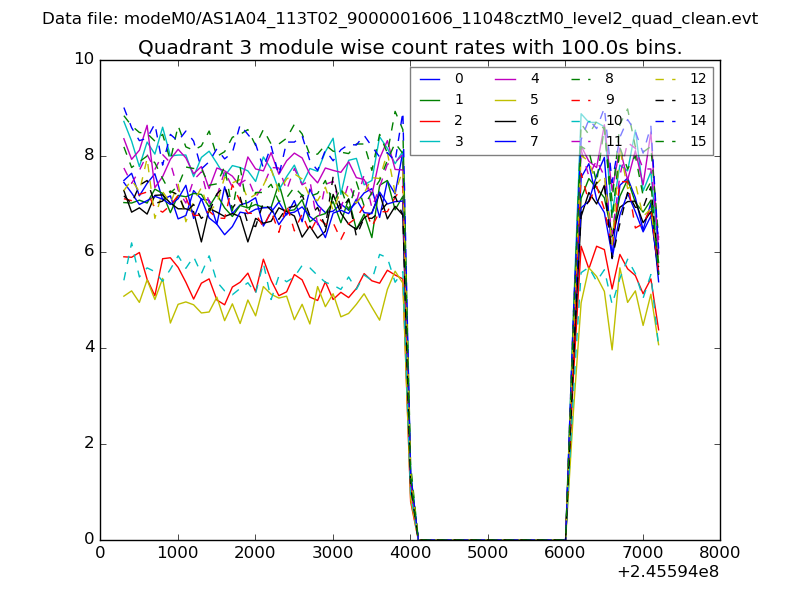
| Module-wise count rates for Quadrant A Data is divided into 100 sec bins |
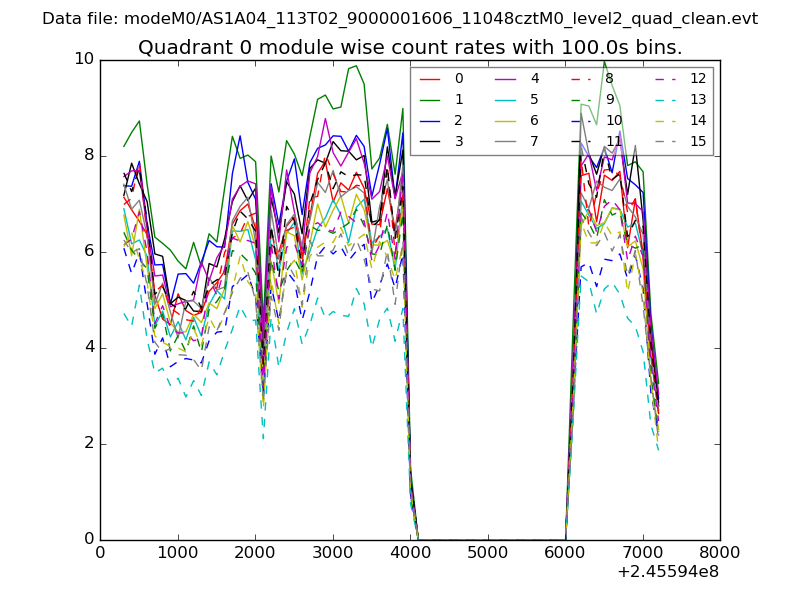 |
 |
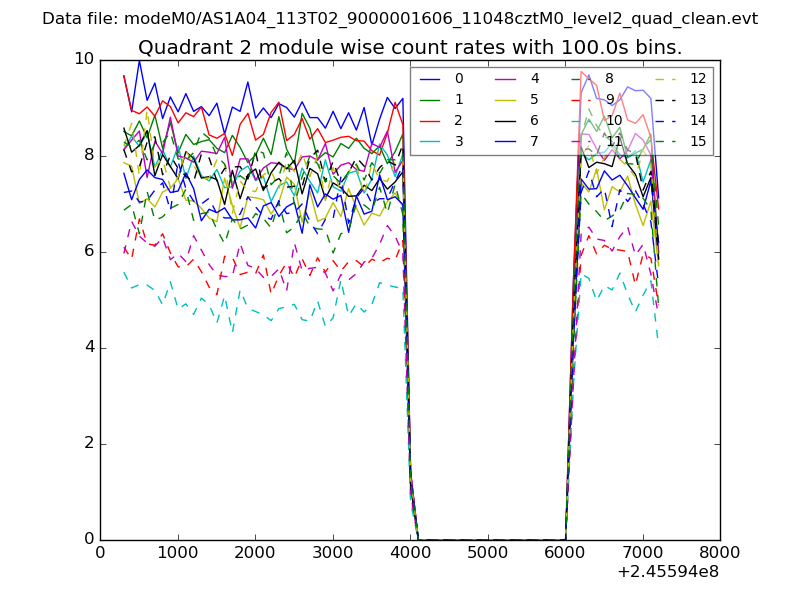
| Module-wise count rates for Quadrant B Data is divided into 100 sec bins |
 |
 |
| Module-wise count rates for Quadrant C Data is divided into 100 sec bins |
 |
 |
| Module-wise count rates for Quadrant D Data is divided into 100 sec bins |
 |
 |
| Parameter | Plot |
|---|---|
| CZT HV Monitor | 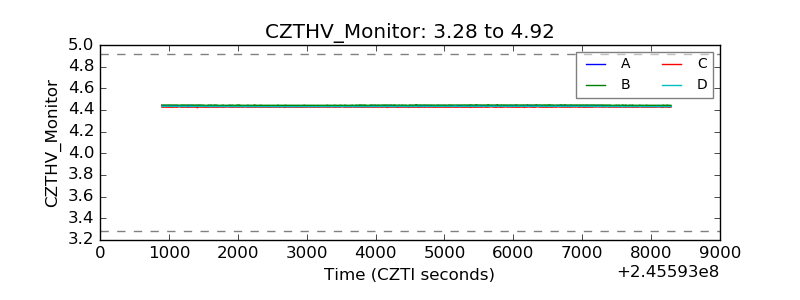 |
| D_VDD | 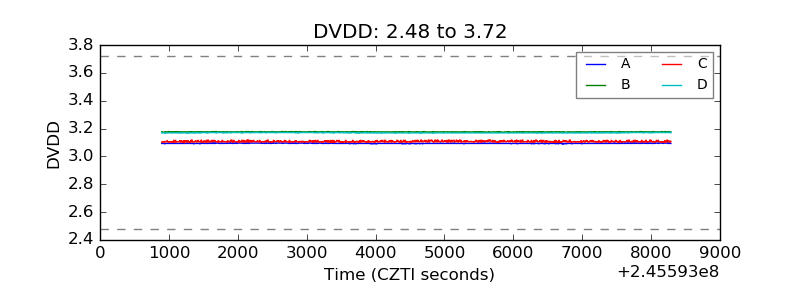 |
| Temperature 1 | 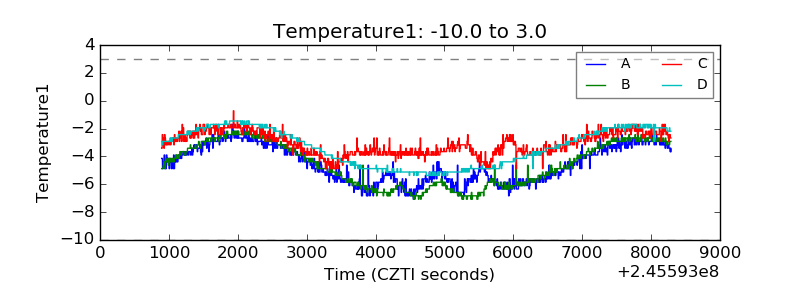 |
| Veto HV Monitor | 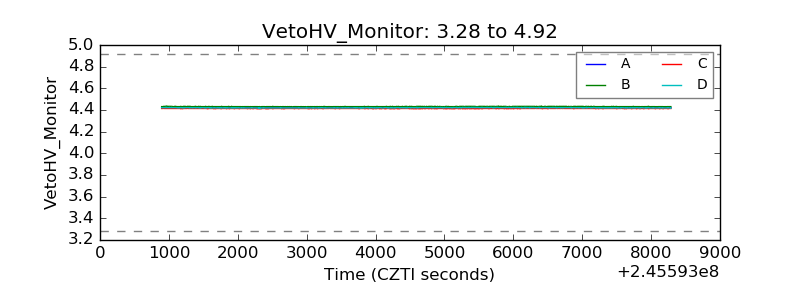 |
| Veto LLD | 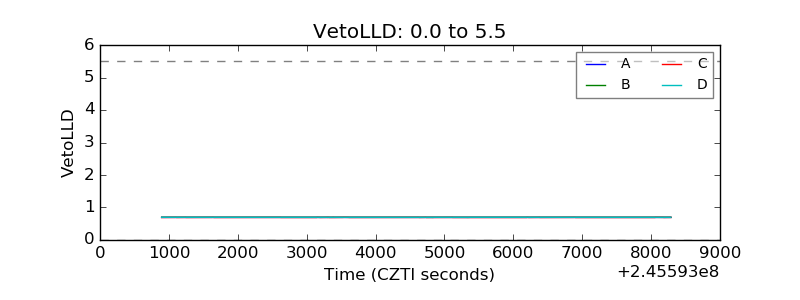 |
| Alpha Counter | 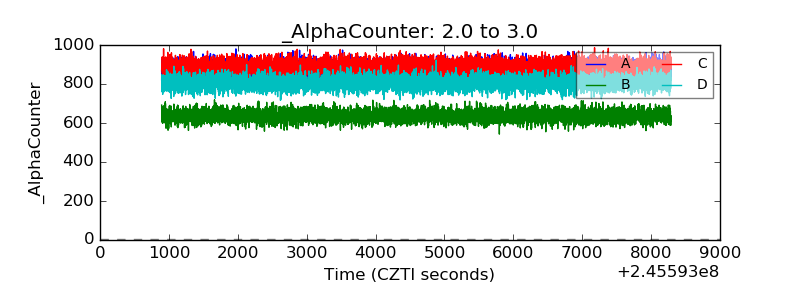 |
| _CPM_Rate | 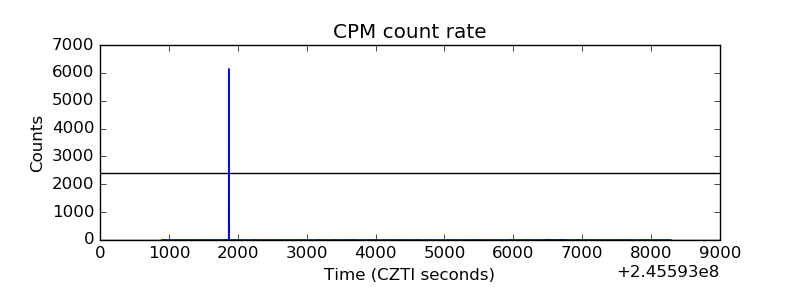 |
| CZT Counter | 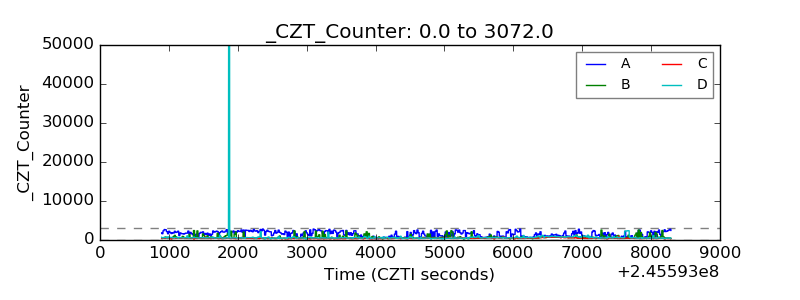 |
| +2.5 Volts monitor |  |
| +5 Volts monitor |  |
| _ROLL_ROT | 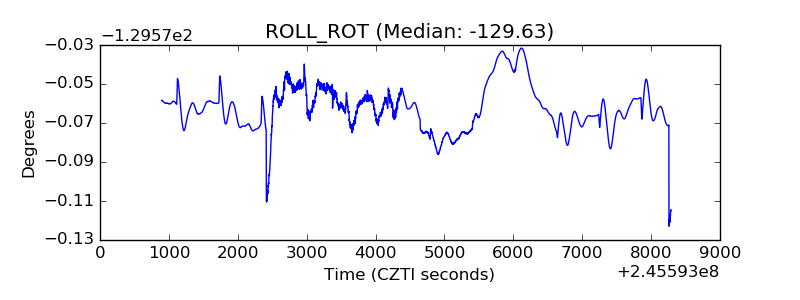 |
| _Roll_DEC | 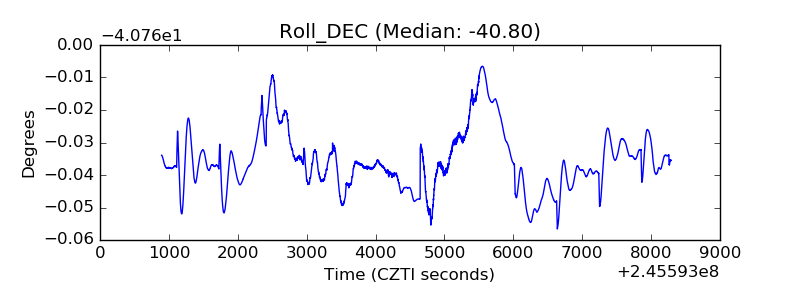 |
| _Roll_RA | 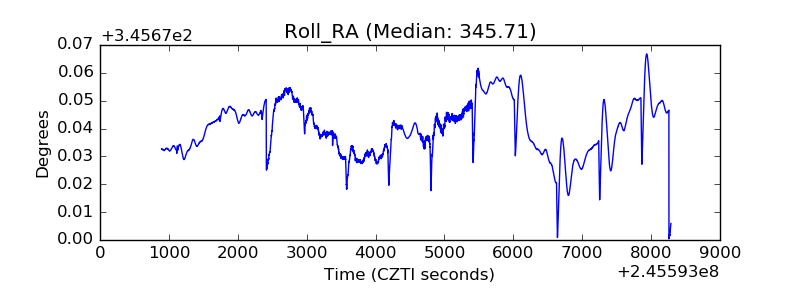 |
| Veto Counter | 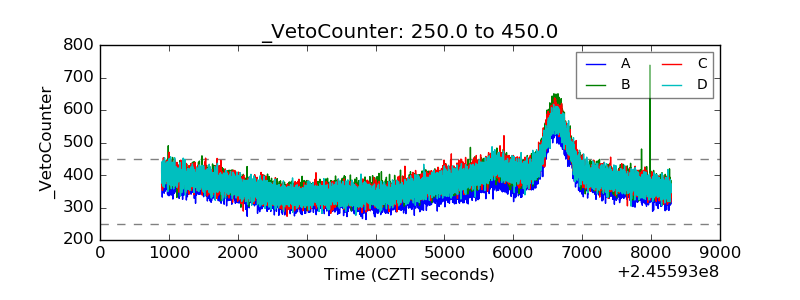 |