| Param | Original file | Final file |
|---|---|---|
| Filename | modeM0/AS1A04_113T02_9000001606_11049cztM0_level2.evt | modeM0/AS1A04_113T02_9000001606_11049cztM0_level2_quad_clean.evt |
| Size (bytes) | 333,789,120 | 50,227,200 |
| Size | 318.3 MB | 47.9 MB |
| Events in quadrant A | 4,312,754 | 298,765 |
| Events in quadrant B | 2,285,854 | 327,890 |
| Events in quadrant C | 1,370,802 | 337,637 |
| Events in quadrant D | 1,917,094 | 324,517 |
| Mode SS | |||
|---|---|---|---|
| Quadrant | BADHDUFLAG | Total packets | Discarded packets |
| A | 0 | 64 | 0 |
| B | 0 | 64 | 0 |
| C | 0 | 64 | 0 |
| D | 0 | 64 | 0 |
| Mode M0 | |||
|---|---|---|---|
| Quadrant | BADHDUFLAG | Total packets | Discarded packets |
| A | 0 | 15053 | 0 |
| B | 0 | 8988 | 0 |
| C | 0 | 6577 | 0 |
| D | 0 | 7747 | 0 |
| Quadrant | Total seconds | Saturated seconds | Saturation percentage |
|---|---|---|---|
| A | 3263 | 732 | 22.433344% |
| B | 3263 | 215 | 6.589029% |
| C | 3263 | 0 | 0.000000% |
| D | 3263 | 66 | 2.022679% |
Noise dominated data is calculated using 1-second bins in cleaned event files. If a bin has >2000 counts, and if more than 50% of those come from <1% of pixels, then it is considered to be noise-dominated and hence unusable.
| Quadrant | # 1 sec bins | Bins with >0 counts | Bins with >2000 counts | High rate bins dominated by noise | Noise dominated (total time) | Noise dominated (detector-on time) | Marked lightcurve |
|---|---|---|---|---|---|---|---|
| A | 3263 | 3263 | 609 | 609 | 18.66% | 18.66% | 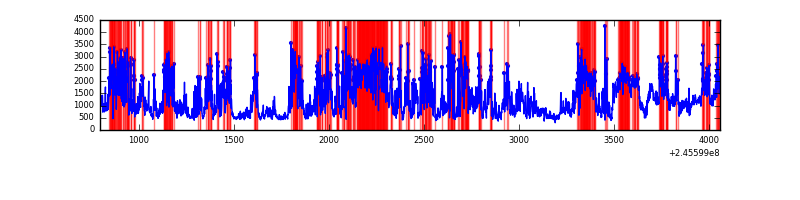 |
| B | 3263 | 3263 | 150 | 150 | 4.60% | 4.60% | 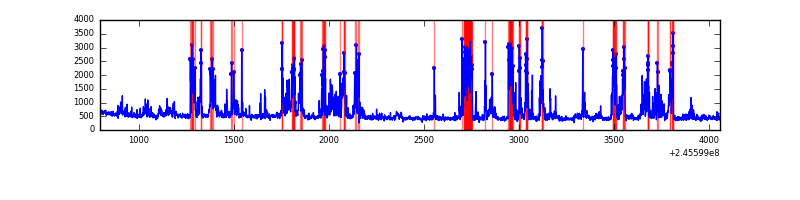 |
| C | 3263 | 3263 | 0 | 0 | 0.00% | 0.00% | 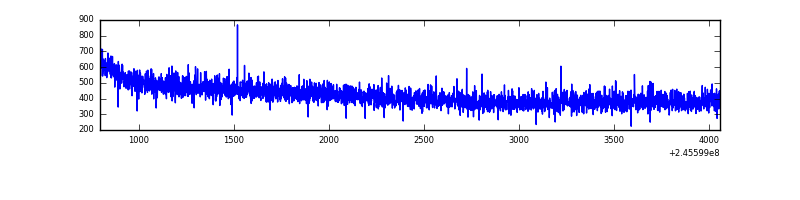 |
| D | 3263 | 3263 | 67 | 67 | 2.05% | 2.05% | 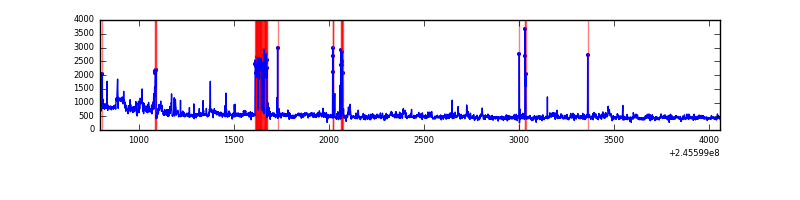 |
Top three noisy pixels from each quadrant. If the there are fewer than three noisy pixels in the level2.evt file, extra rows are filled as -1
| Pixel properties | Quadrant properties | ||||||
|---|---|---|---|---|---|---|---|
| Quadrant | DetID | PixID | Counts | Sigma | Mean | Median | Sigma |
| A | 14 | 238 | 2446608 | 34628.57 | 334 | 327 | 70.6 |
| A | 15 | 174 | 579077 | 8192.55 | 334 | 327 | 70.6 |
| A | 0 | 226 | 2979 | 37.54 | 334 | 327 | 70.6 |
| B | 4 | 239 | 815138 | 11518.86 | 357 | 349 | 70.7 |
| B | 0 | 214 | 29557 | 412.92 | 357 | 349 | 70.7 |
| B | 0 | 187 | 22087 | 307.32 | 357 | 349 | 70.7 |
| C | 8 | 128 | 5887 | 67.52 | 348 | 350 | 82.0 |
| C | 8 | 112 | 3184 | 34.56 | 348 | 350 | 82.0 |
| C | 13 | 61 | 2465 | 25.79 | 348 | 350 | 82.0 |
| D | 8 | 195 | 213957 | 2508.11 | 348 | 338 | 85.2 |
| D | 1 | 52 | 195149 | 2287.28 | 348 | 338 | 85.2 |
| D | 11 | 129 | 95281 | 1114.73 | 348 | 338 | 85.2 |
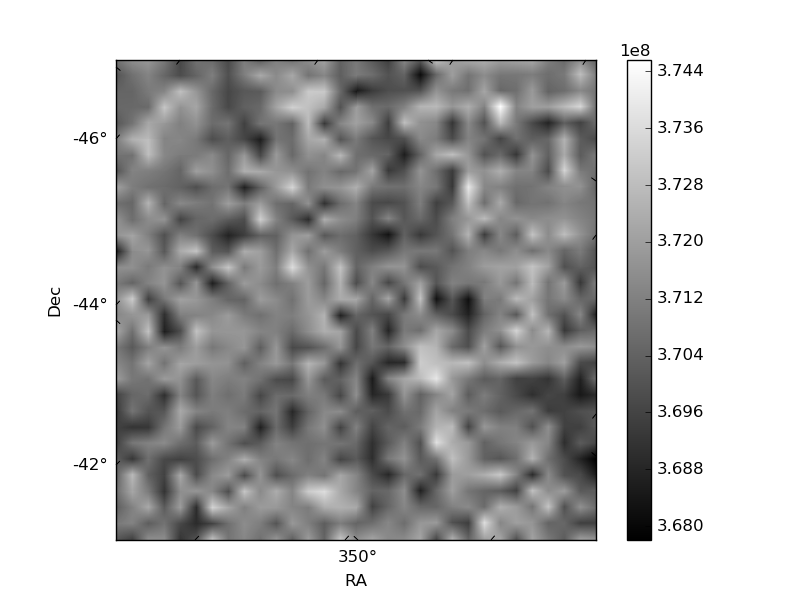
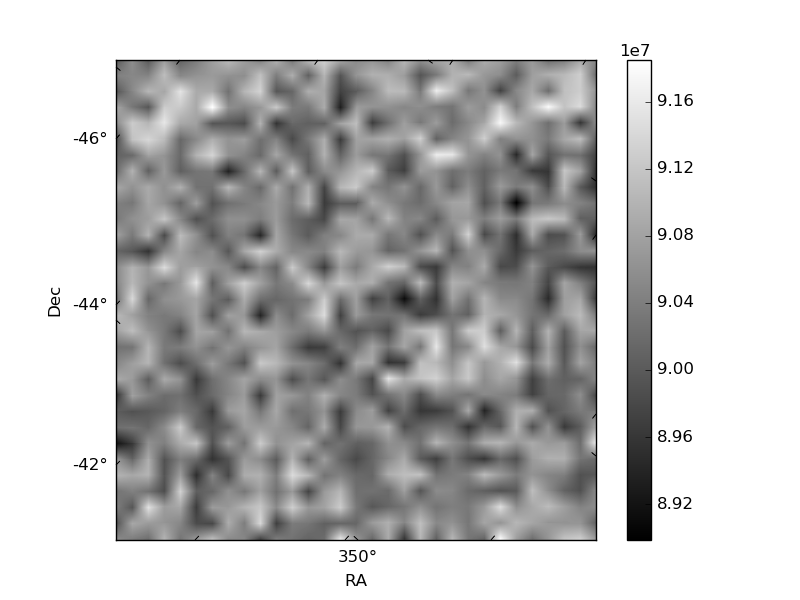
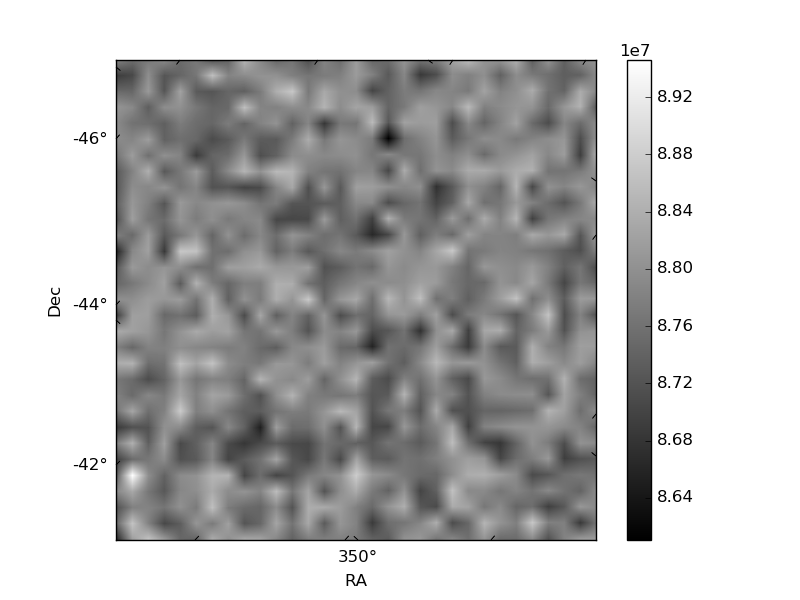
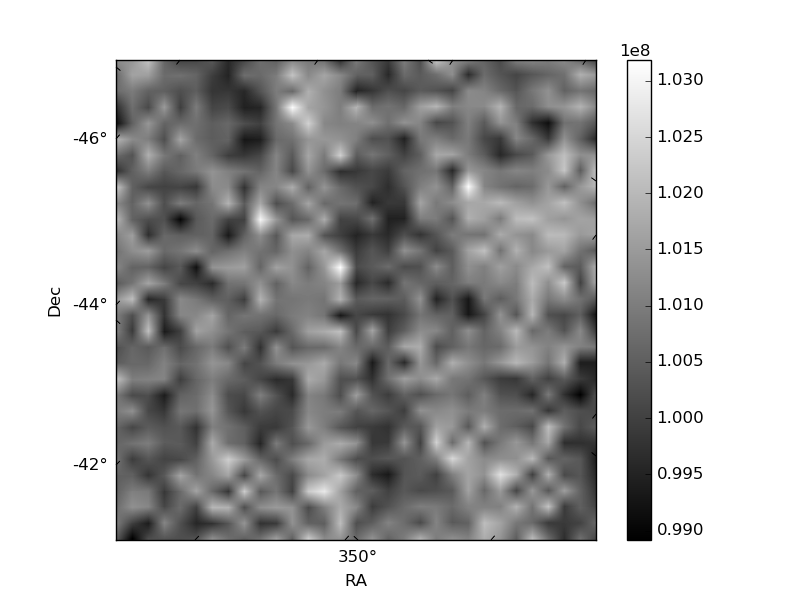
Histogram calculated using DETX and DETY for each event in the final _common_clean file
| Quadrant A | 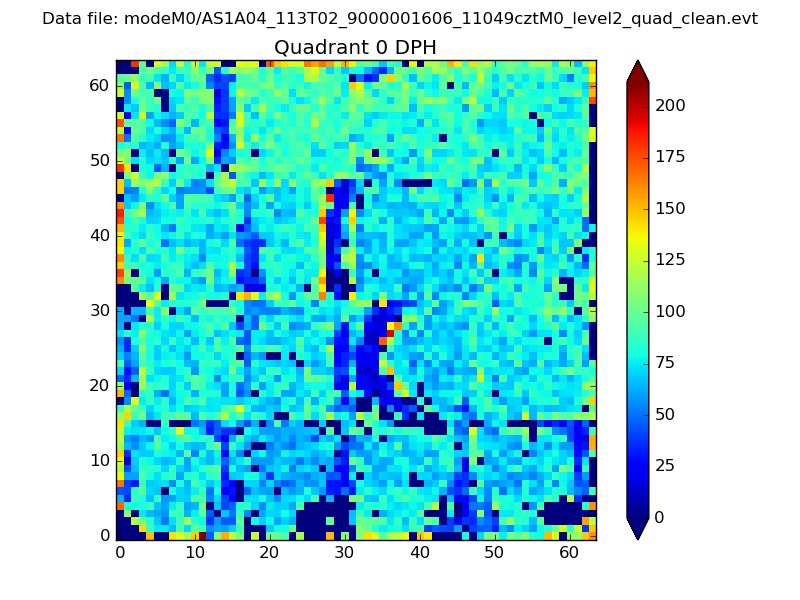 |
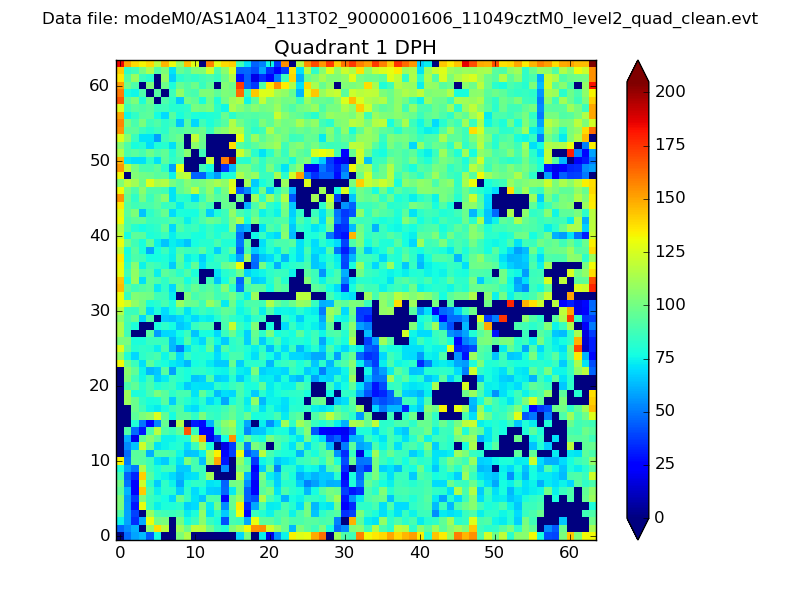 |
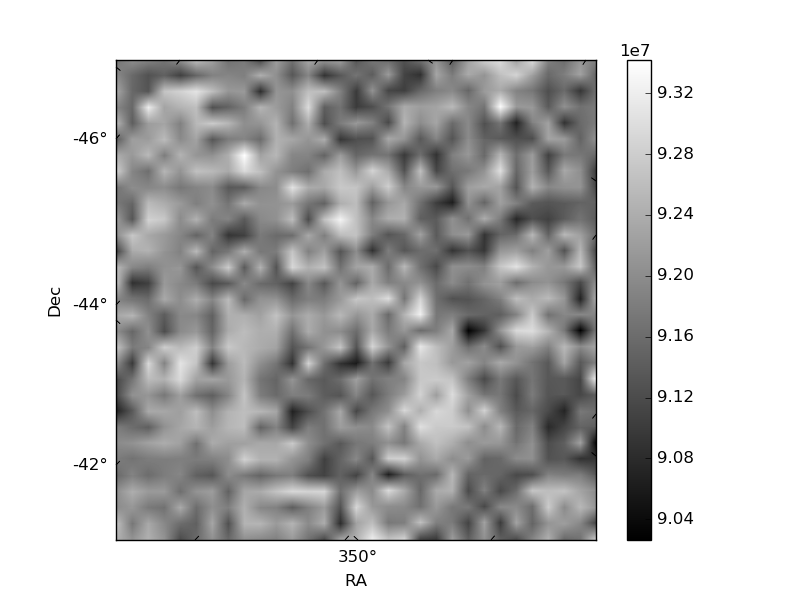
Quadrant B |
|---|---|---|---|
| Quadrant D | 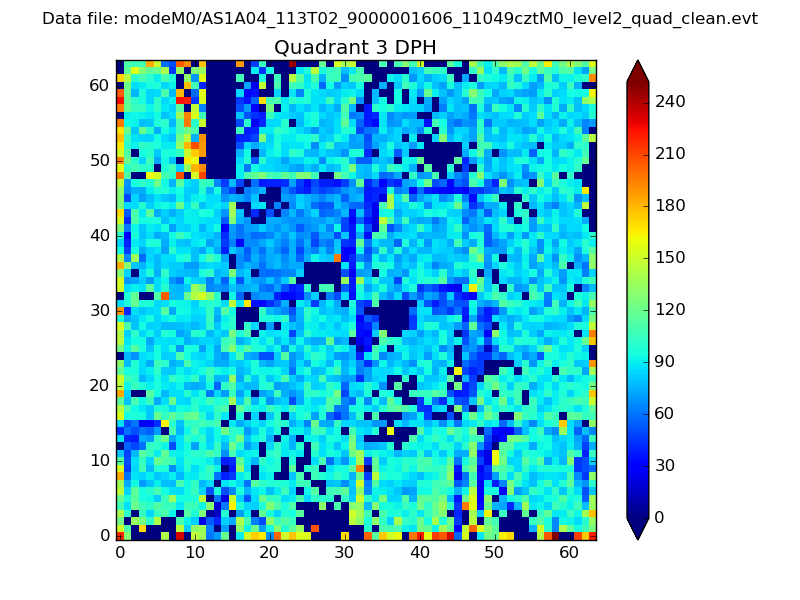 |
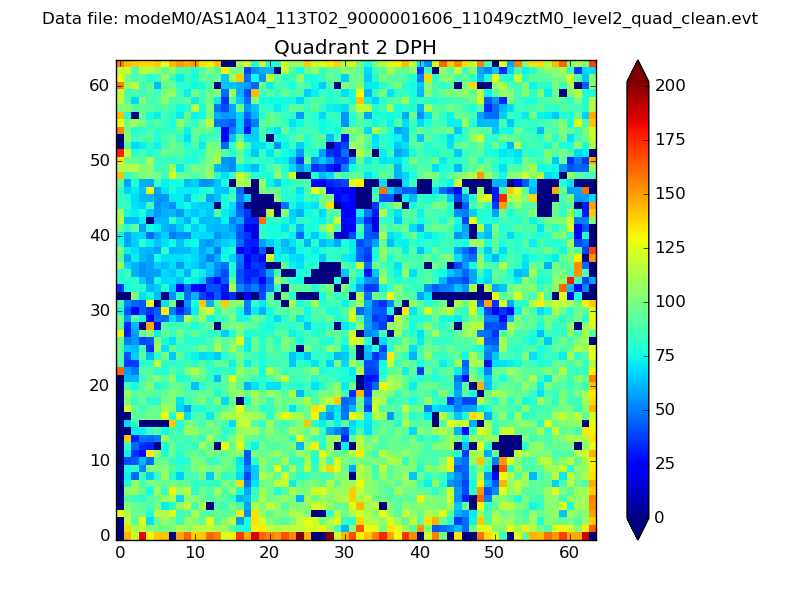 |
Quadrant C |
| Plot type | Count rate plots | Images |
|---|---|---|
| Comparison with Poisson distribution Blue bars denote a histogram of data divided into 1 sec bins. Red curve is a Poisson curve with rate = median count rate of data. |
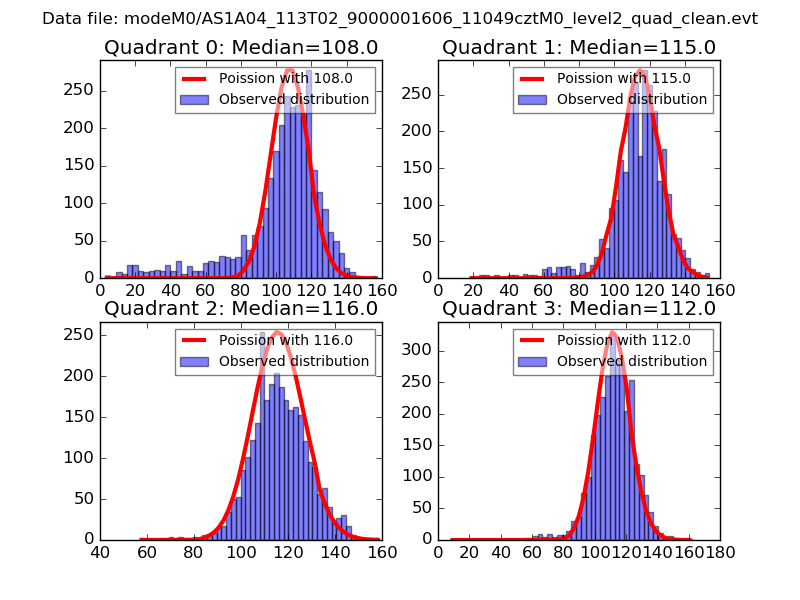 |
 |
| Quadrant-wise count rates Data is divided into 100 sec bins |
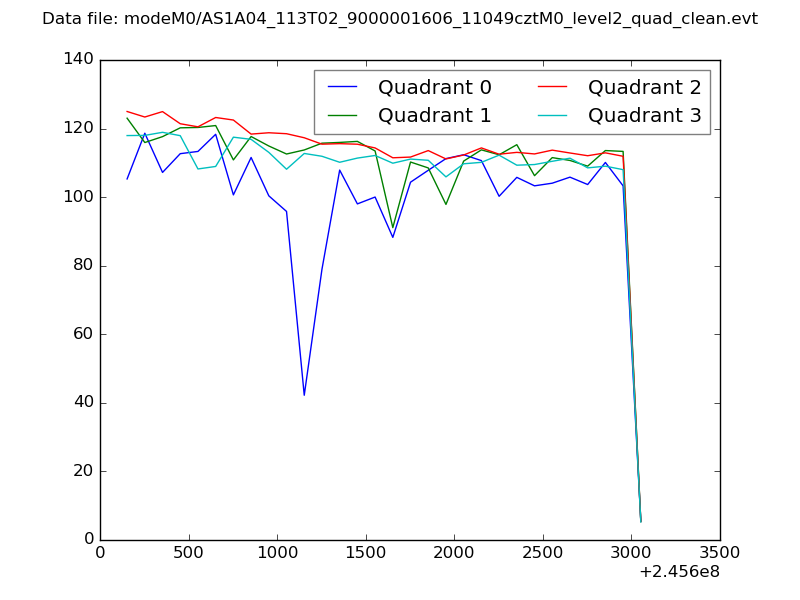 |
|
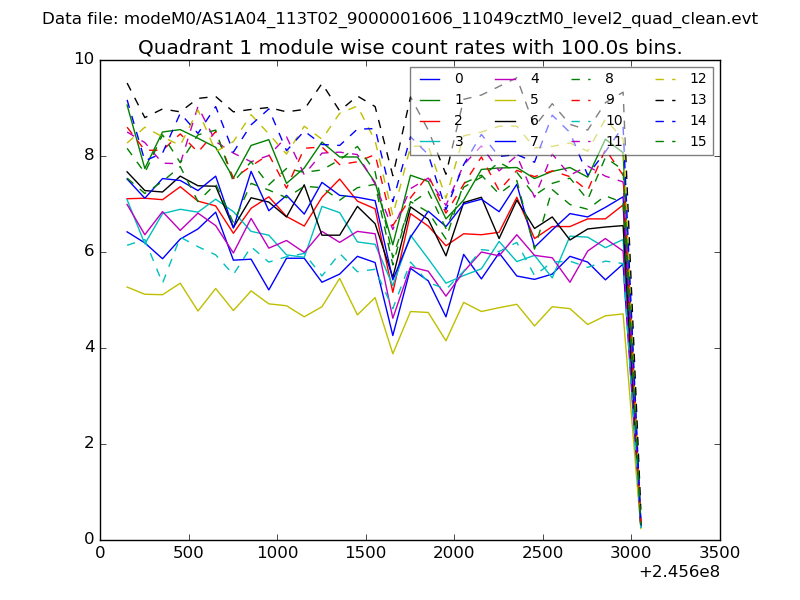
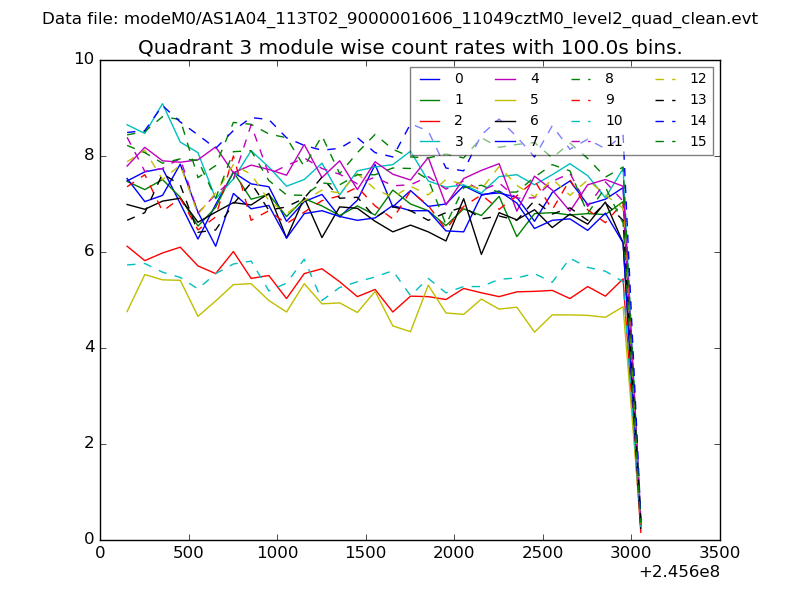
| Module-wise count rates for Quadrant A Data is divided into 100 sec bins |
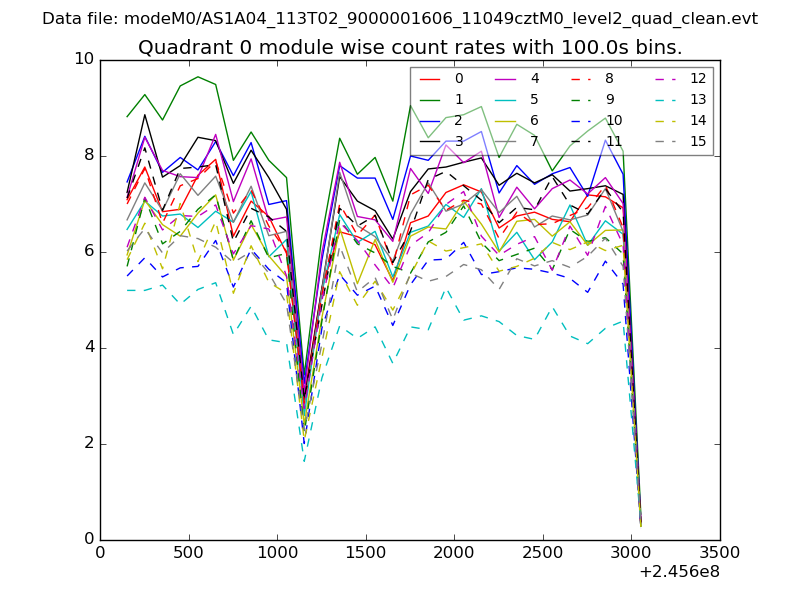 |
 |
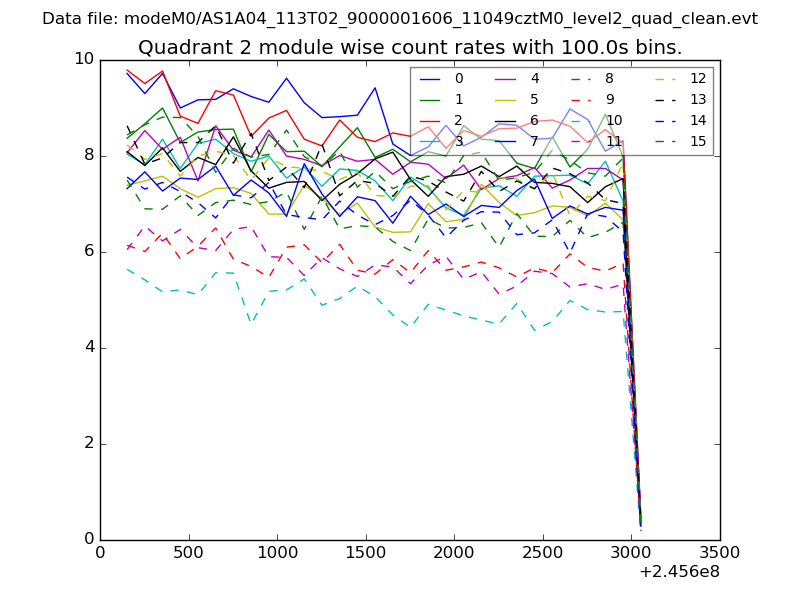
| Module-wise count rates for Quadrant B Data is divided into 100 sec bins |
 |
 |
| Module-wise count rates for Quadrant C Data is divided into 100 sec bins |
 |
 |
| Module-wise count rates for Quadrant D Data is divided into 100 sec bins |
 |
 |
| Parameter | Plot |
|---|---|
| CZT HV Monitor | 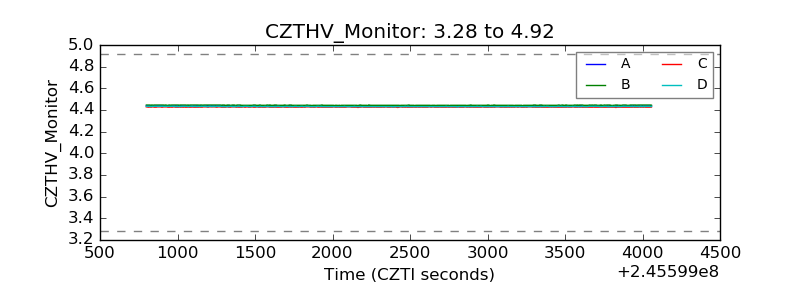 |
| D_VDD | 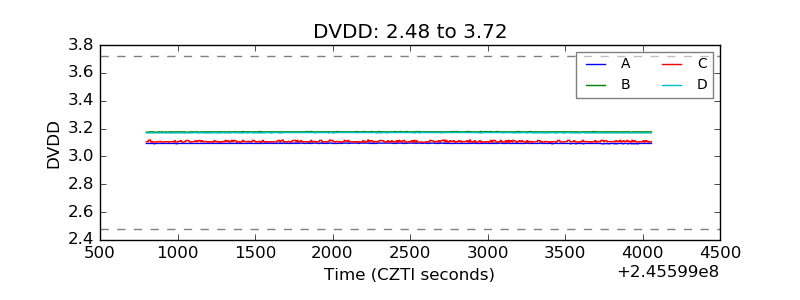 |
| Temperature 1 | 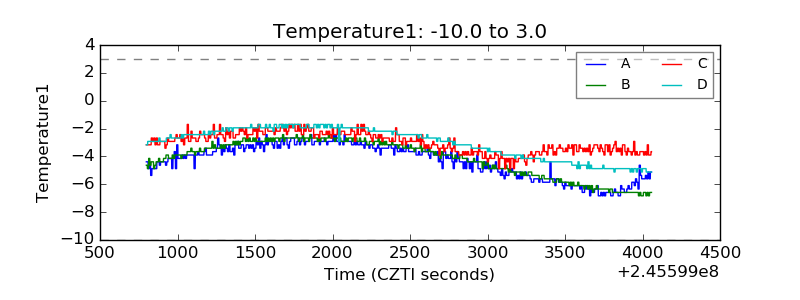 |
| Veto HV Monitor | 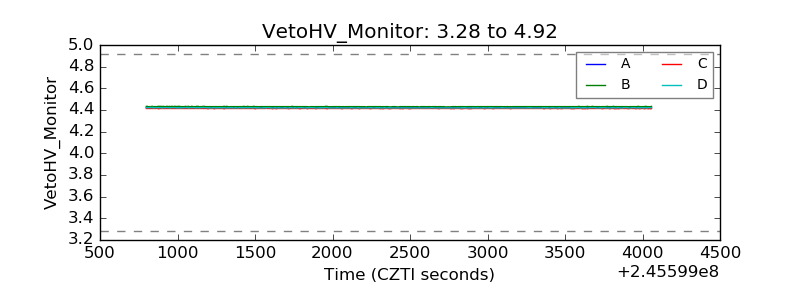 |
| Veto LLD | 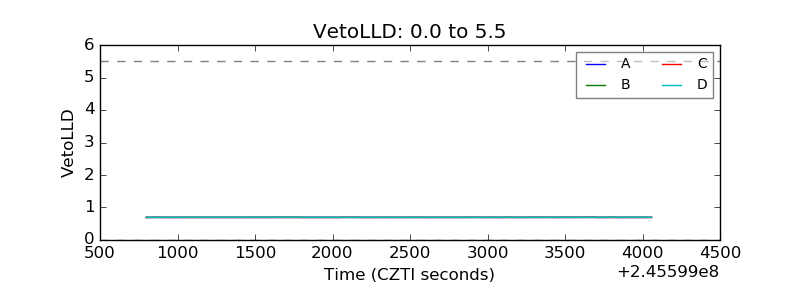 |
| Alpha Counter | 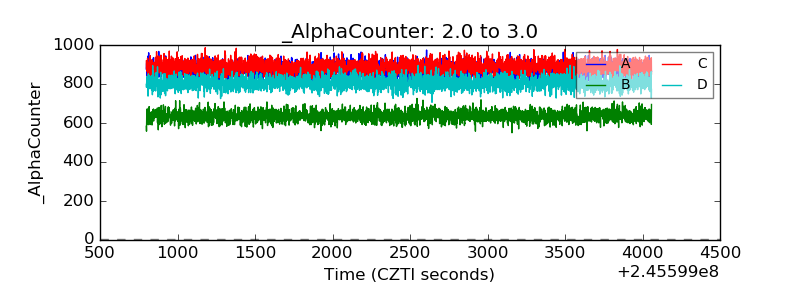 |
| _CPM_Rate | 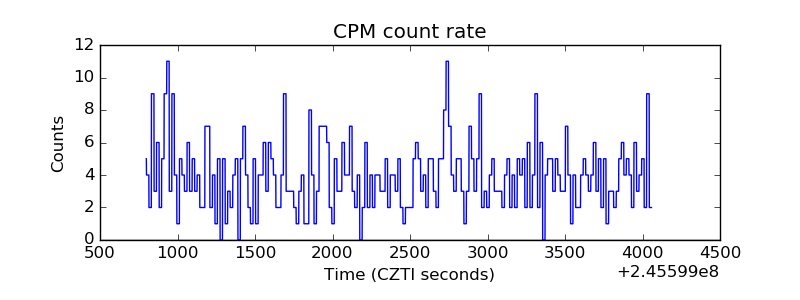 |
| CZT Counter | 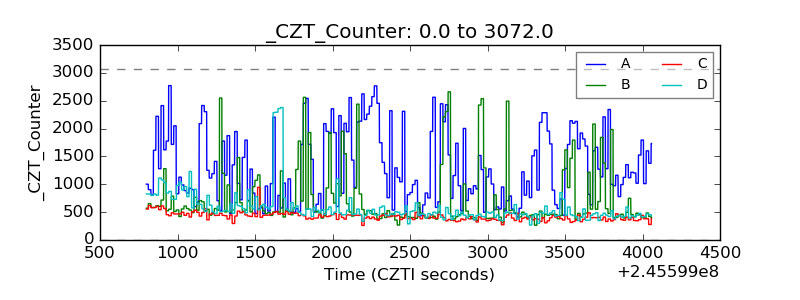 |
| +2.5 Volts monitor |  |
| +5 Volts monitor | 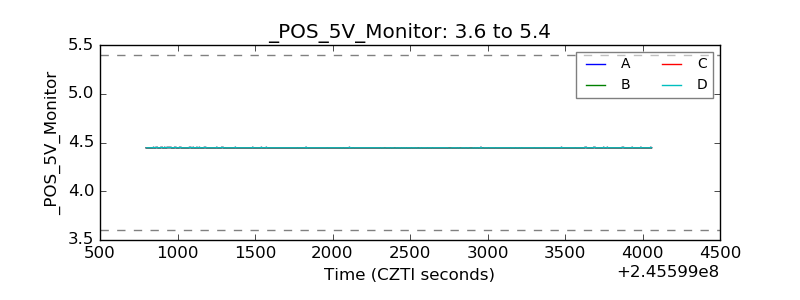 |
| _ROLL_ROT | 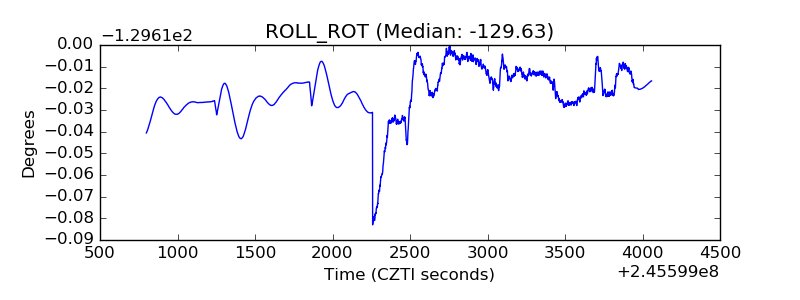 |
| _Roll_DEC | 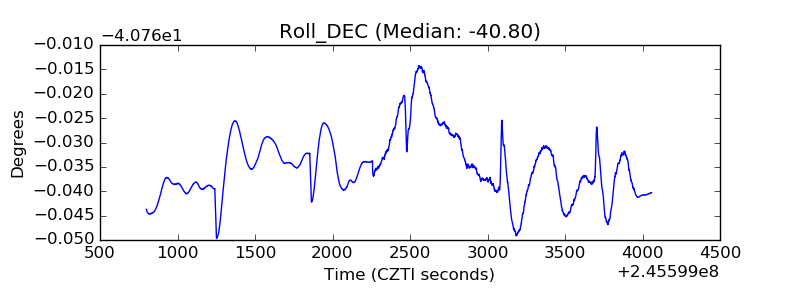 |
| _Roll_RA | 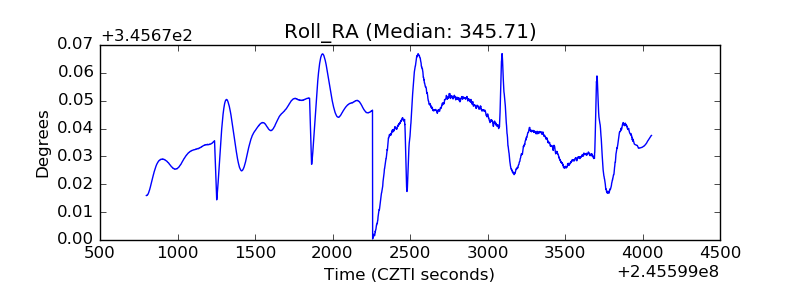 |
| Veto Counter | 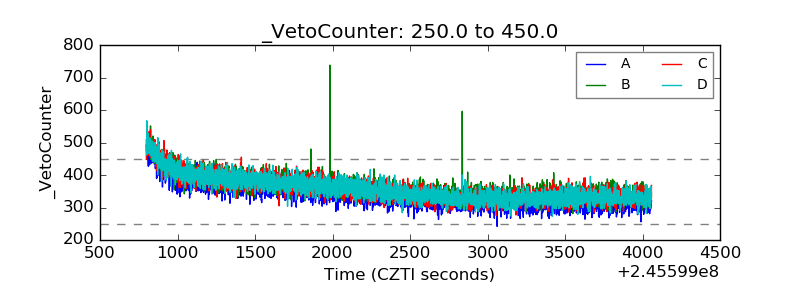 |