| Param | Original file | Final file |
|---|---|---|
| Filename | modeM0/AS1A04_130T03_9000001602cztM0_level2.fits | modeM0/AS1A04_130T03_9000001602cztM0_level2_quad_clean.evt |
| Size (bytes) | 170,032,320 | 138,326,400 |
| Size | 162.2 MB | 131.9 MB |
| Events in quadrant A | 1,003,951 | 690,742 |
| Events in quadrant B | 988,626 | 765,354 |
| Events in quadrant C | 1,029,926 | 777,788 |
| Events in quadrant D | 886,264 | 715,084 |
| Mode SS | |||
|---|---|---|---|
| Quadrant | BADHDUFLAG | Total packets | Discarded packets |
| A | 0 | 370 | 0 |
| B | 0 | 370 | 0 |
| C | 0 | 372 | 0 |
| D | 0 | 370 | 0 |
| Mode M9 | |||
|---|---|---|---|
| Quadrant | BADHDUFLAG | Total packets | Discarded packets |
| A | 0 | 26 | 0 |
| B | 0 | 26 | 0 |
| C | 0 | 26 | 0 |
| D | 0 | 26 | 0 |
| Mode M0 | |||
|---|---|---|---|
| Quadrant | BADHDUFLAG | Total packets | Discarded packets |
| A | 0 | 60253 | 0 |
| B | 0 | 49354 | 0 |
| C | 0 | 37257 | 0 |
| D | 0 | 45978 | 0 |
| Quadrant | Total seconds | Saturated seconds | Saturation percentage |
|---|---|---|---|
| A | 17859 | 1954 | 10.941262% |
| B | 17954 | 1392 | 7.753147% |
| C | 18005 | 312 | 1.732852% |
| D | 18006 | 896 | 4.976119% |
Noise dominated data is calculated using 1-second bins in cleaned event files. If a bin has >2000 counts, and if more than 50% of those come from <1% of pixels, then it is considered to be noise-dominated and hence unusable.
| Quadrant | # 1 sec bins | Bins with >0 counts | Bins with >2000 counts | High rate bins dominated by noise | Noise dominated (total time) | Noise dominated (detector-on time) | Marked lightcurve |
|---|---|---|---|---|---|---|---|
| A | 20962 | 18103 | 0 | 0 | 0.00% | 0.00% |  |
| B | 20962 | 18155 | 0 | 0 | 0.00% | 0.00% |  |
| C | 20962 | 18188 | 0 | 0 | 0.00% | 0.00% |  |
| D | 20962 | 18170 | 0 | 0 | 0.00% | 0.00% |  |
Top three noisy pixels from each quadrant. If the there are fewer than three noisy pixels in the level2.evt file, extra rows are filled as -1
| Pixel properties | Quadrant properties | ||||||
|---|---|---|---|---|---|---|---|
| Quadrant | DetID | PixID | Counts | Sigma | Mean | Median | Sigma |
| A | 14 | 188 | 1022 | 11.95 | 260 | 245 | 65.0 |
| A | 0 | 29 | 939 | 10.67 | 260 | 245 | 65.0 |
| A | 14 | 204 | 829 | 8.98 | 260 | 245 | 65.0 |
| B | 2 | 9 | 784 | 10.26 | 260 | 248 | 52.3 |
| B | 14 | 254 | 667 | 8.02 | 260 | 248 | 52.3 |
| B | 5 | 225 | 665 | 7.98 | 260 | 248 | 52.3 |
| C | 1 | 81 | 765 | 7.03 | 272 | 253 | 72.9 |
| C | 1 | 80 | 758 | 6.93 | 272 | 253 | 72.9 |
| C | 12 | 241 | 715 | 6.34 | 272 | 253 | 72.9 |
| D | 3 | 14 | 684 | 6.57 | 252 | 230 | 69.1 |
| D | 6 | 231 | 639 | 5.92 | 252 | 230 | 69.1 |
| D | 1 | 31 | 625 | 5.72 | 252 | 230 | 69.1 |
Histogram calculated using DETX and DETY for each event in the final _common_clean file
| Quadrant A |  |
 |
Quadrant B |
|---|---|---|---|
| Quadrant D | 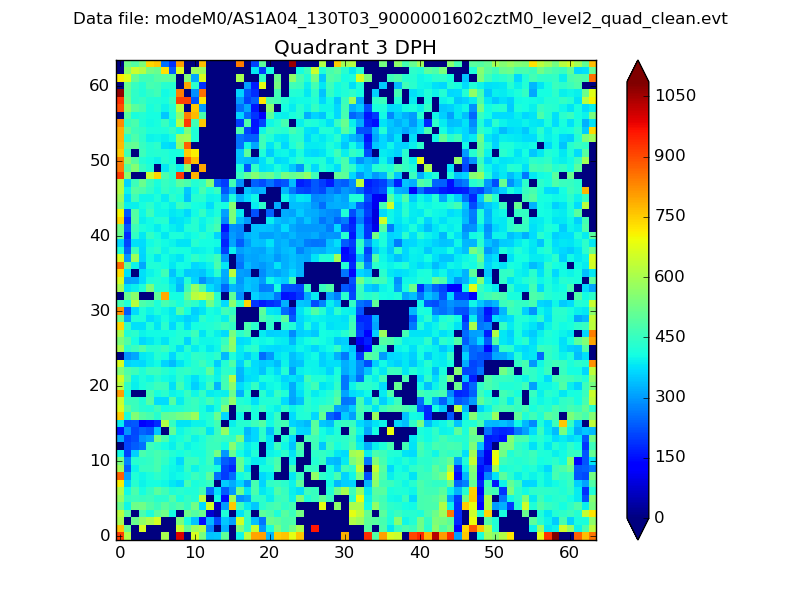 |
 |
Quadrant C |
| Plot type | Count rate plots | Images |
|---|---|---|
| Comparison with Poisson distribution Blue bars denote a histogram of data divided into 1 sec bins. Red curve is a Poisson curve with rate = median count rate of data. |
 |
 |
| Quadrant-wise count rates Data is divided into 100 sec bins |
 |
|
| Module-wise count rates for Quadrant A Data is divided into 100 sec bins |
 |
 |
| Module-wise count rates for Quadrant B Data is divided into 100 sec bins |
 |
 |
| Module-wise count rates for Quadrant C Data is divided into 100 sec bins |
 |
 |
| Module-wise count rates for Quadrant D Data is divided into 100 sec bins |
 |
 |
| Parameter | Plot |
|---|---|
| CZT HV Monitor |  |
| D_VDD |  |
| Temperature 1 |  |
| Veto HV Monitor |  |
| Veto LLD |  |
| Alpha Counter |  |
| _CPM_Rate |  |
| CZT Counter |  |
| +2.5 Volts monitor |  |
| +5 Volts monitor |  |
| _ROLL_ROT |  |
| _Roll_DEC |  |
| _Roll_RA |  |
| Veto Counter |  |