| Param | Original file | Final file |
|---|---|---|
| Filename | modeM0/AS1A04_130T03_9000001602_11031cztM0_level2.evt | modeM0/AS1A04_130T03_9000001602_11031cztM0_level2_quad_clean.evt |
| Size (bytes) | 607,435,200 | 90,025,920 |
| Size | 579.3 MB | 85.9 MB |
| Events in quadrant A | 4,618,892 | 568,054 |
| Events in quadrant B | 5,143,368 | 553,982 |
| Events in quadrant C | 3,498,347 | 568,939 |
| Events in quadrant D | 4,649,983 | 536,122 |
| Mode SS | |||
|---|---|---|---|
| Quadrant | BADHDUFLAG | Total packets | Discarded packets |
| A | 0 | 148 | 2 |
| B | 0 | 148 | 0 |
| C | 0 | 148 | 0 |
| D | 0 | 148 | 0 |
| Mode M9 | |||
|---|---|---|---|
| Quadrant | BADHDUFLAG | Total packets | Discarded packets |
| A | 0 | 21 | 0 |
| B | 0 | 21 | 0 |
| C | 0 | 21 | 0 |
| D | 0 | 21 | 0 |
| Mode M0 | |||
|---|---|---|---|
| Quadrant | BADHDUFLAG | Total packets | Discarded packets |
| A | 0 | 18547 | 33 |
| B | 0 | 19851 | 32 |
| C | 0 | 15159 | 25 |
| D | 0 | 18466 | 23 |
| Quadrant | Total seconds | Saturated seconds | Saturation percentage |
|---|---|---|---|
| A | 7164 | 304 | 4.243439% |
| B | 7164 | 667 | 9.310441% |
| C | 7163 | 225 | 3.141142% |
| D | 7165 | 458 | 6.392184% |
Noise dominated data is calculated using 1-second bins in cleaned event files. If a bin has >2000 counts, and if more than 50% of those come from <1% of pixels, then it is considered to be noise-dominated and hence unusable.
| Quadrant | # 1 sec bins | Bins with >0 counts | Bins with >2000 counts | High rate bins dominated by noise | Noise dominated (total time) | Noise dominated (detector-on time) | Marked lightcurve |
|---|---|---|---|---|---|---|---|
| A | 9343 | 7171 | 17 | 17 | 0.18% | 0.24% | 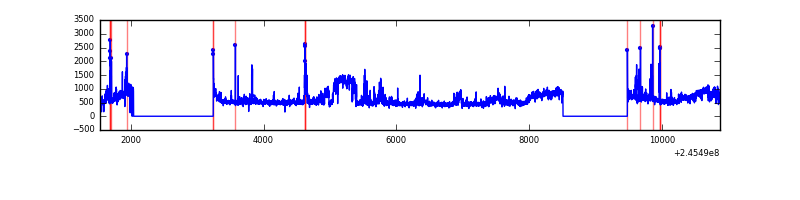 |
| B | 9343 | 7171 | 274 | 274 | 2.93% | 3.82% | 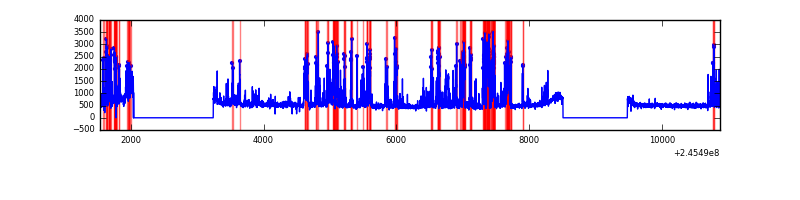 |
| C | 9343 | 7173 | 0 | 0 | 0.00% | 0.00% | 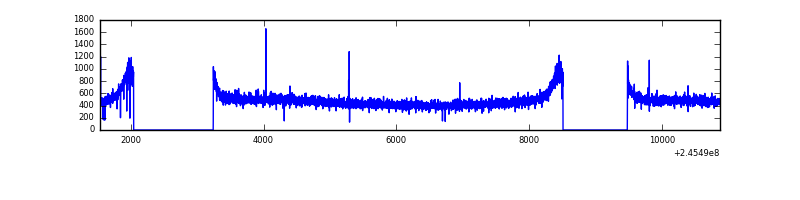 |
| D | 9343 | 7172 | 195 | 195 | 2.09% | 2.72% | 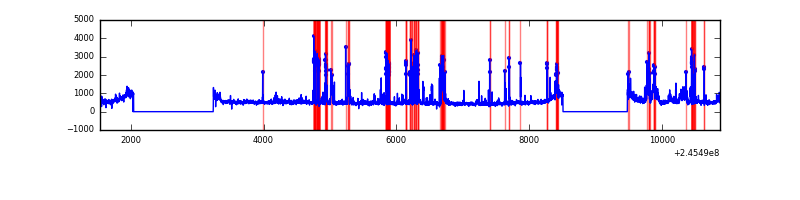 |
Top three noisy pixels from each quadrant. If the there are fewer than three noisy pixels in the level2.evt file, extra rows are filled as -1
| Pixel properties | Quadrant properties | ||||||
|---|---|---|---|---|---|---|---|
| Quadrant | DetID | PixID | Counts | Sigma | Mean | Median | Sigma |
| A | 15 | 174 | 827989 | 4453.02 | 919 | 902 | 185.7 |
| A | 8 | 5 | 221836 | 1189.5 | 919 | 902 | 185.7 |
| A | 0 | 12 | 17043 | 86.9 | 919 | 902 | 185.7 |
| B | 4 | 239 | 1481549 | 8503.22 | 899 | 877 | 174.1 |
| B | 4 | 81 | 70547 | 400.1 | 899 | 877 | 174.1 |
| B | 0 | 197 | 22496 | 124.15 | 899 | 877 | 174.1 |
| C | 13 | 61 | 6719 | 28.04 | 895 | 899 | 207.6 |
| C | 14 | 234 | 3080 | 10.51 | 895 | 899 | 207.6 |
| C | 9 | 54 | 3077 | 10.49 | 895 | 899 | 207.6 |
| D | 2 | 14 | 297472 | 1388.94 | 882 | 857 | 213.6 |
| D | 13 | 104 | 247554 | 1155.19 | 882 | 857 | 213.6 |
| D | 10 | 253 | 228130 | 1064.24 | 882 | 857 | 213.6 |
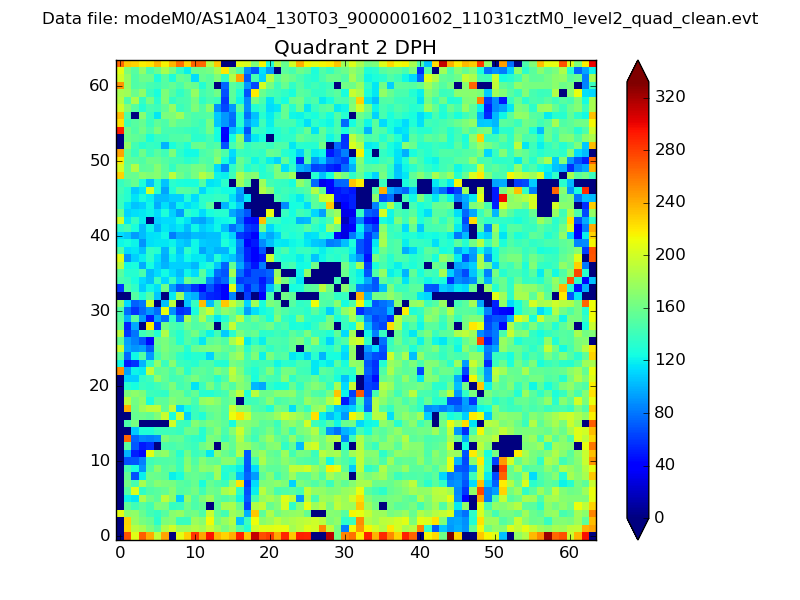
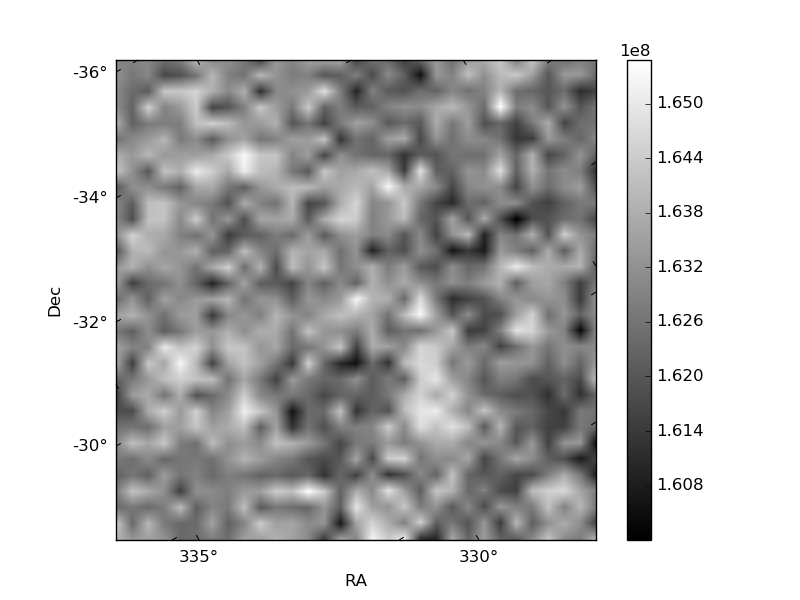
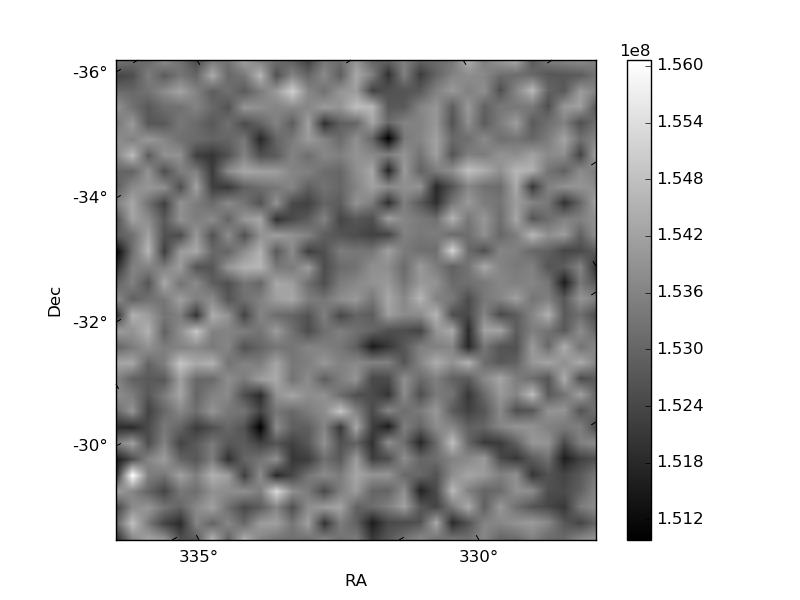
Histogram calculated using DETX and DETY for each event in the final _common_clean file
| Quadrant A | 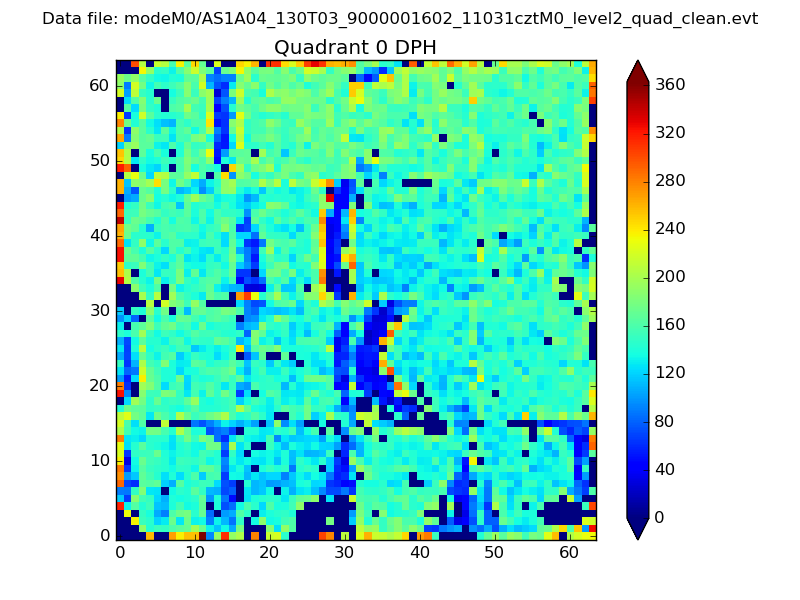 |
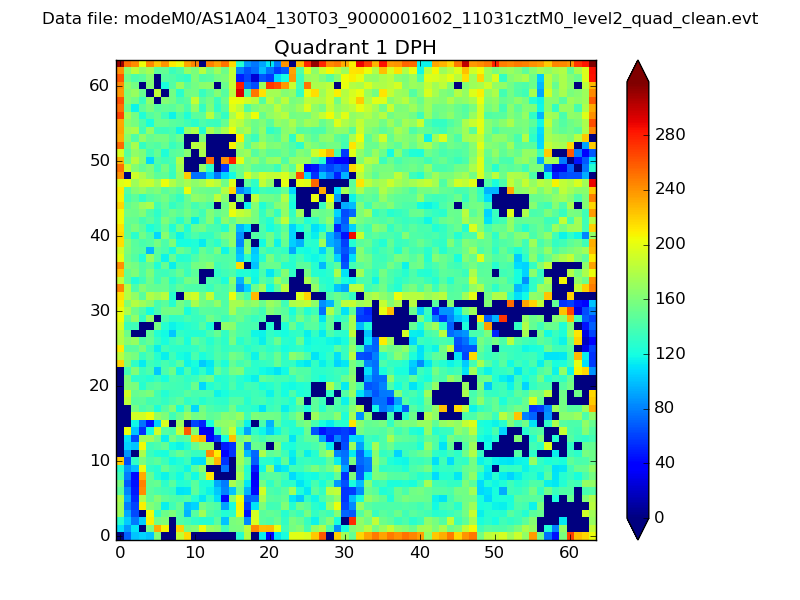 |
Quadrant B |
|---|---|---|---|
| Quadrant D | 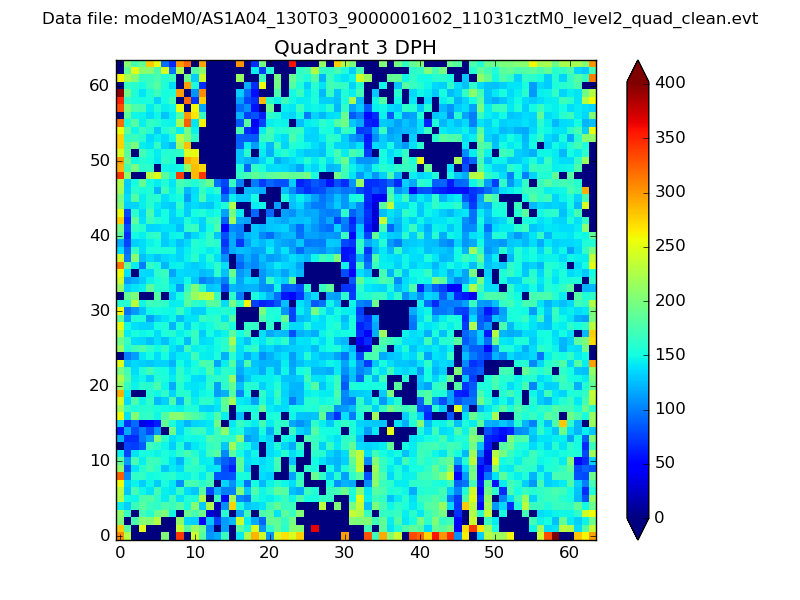 |
 |
Quadrant C |
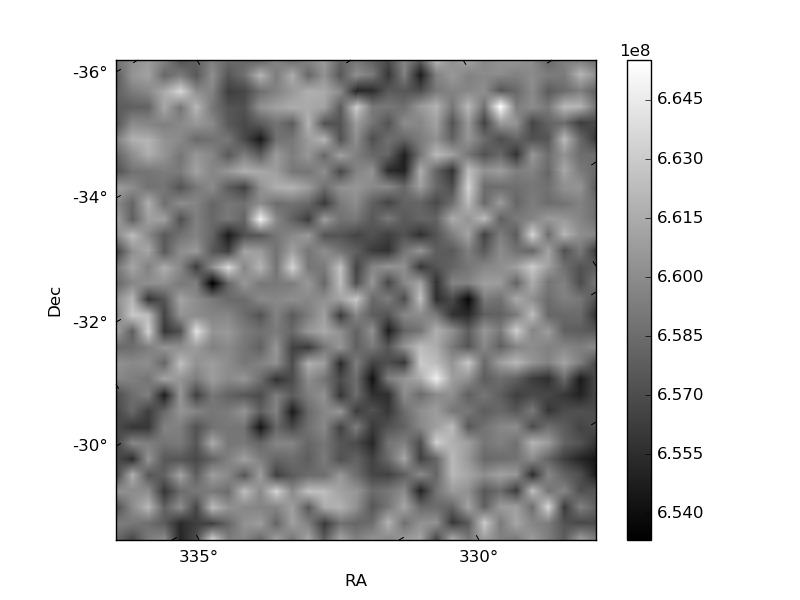
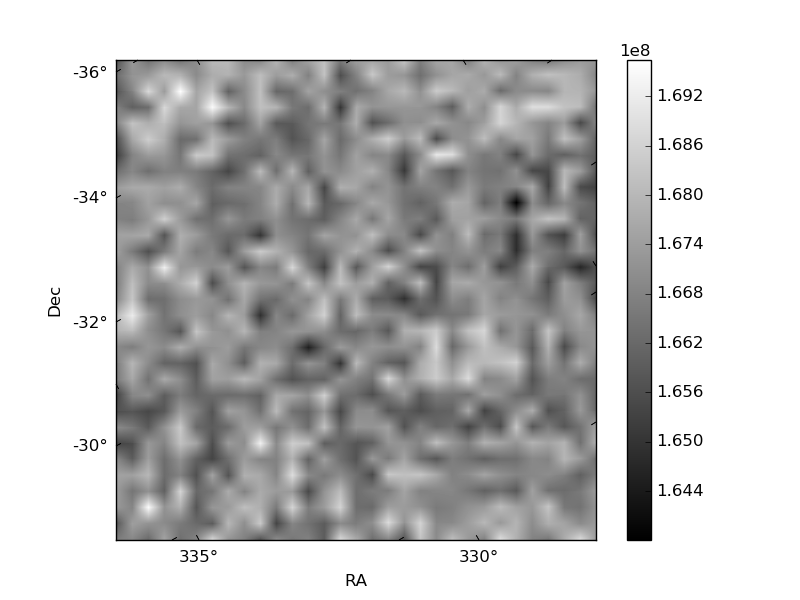
| Plot type | Count rate plots | Images |
|---|---|---|
| Comparison with Poisson distribution Blue bars denote a histogram of data divided into 1 sec bins. Red curve is a Poisson curve with rate = median count rate of data. |
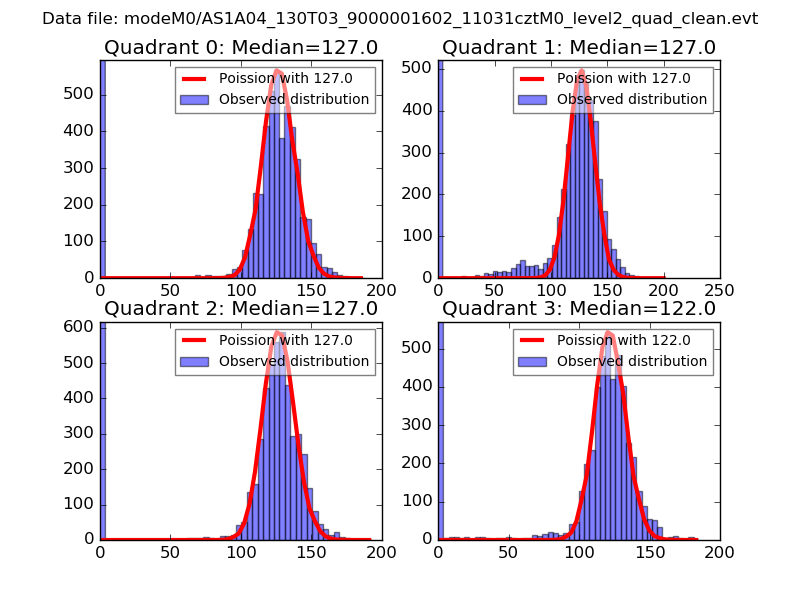 |
 |
| Quadrant-wise count rates Data is divided into 100 sec bins |
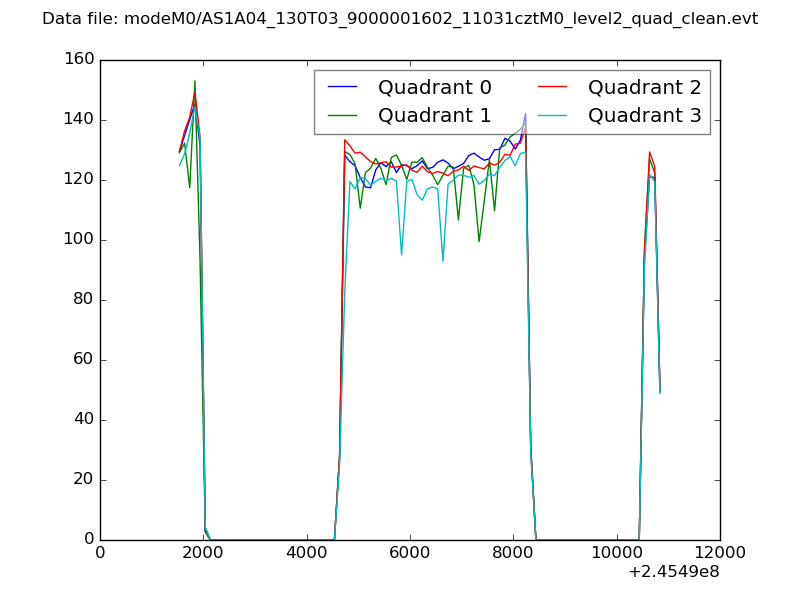 |
|
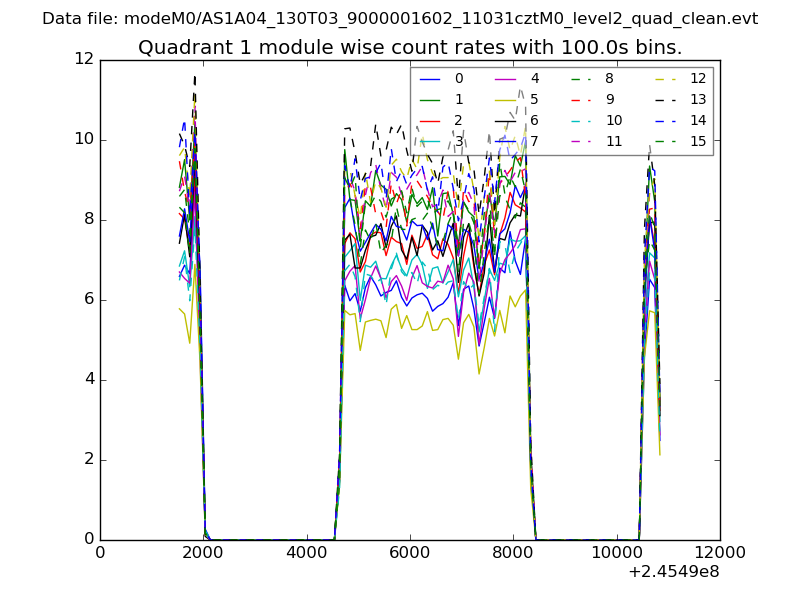
| Module-wise count rates for Quadrant A Data is divided into 100 sec bins |
 |
 |
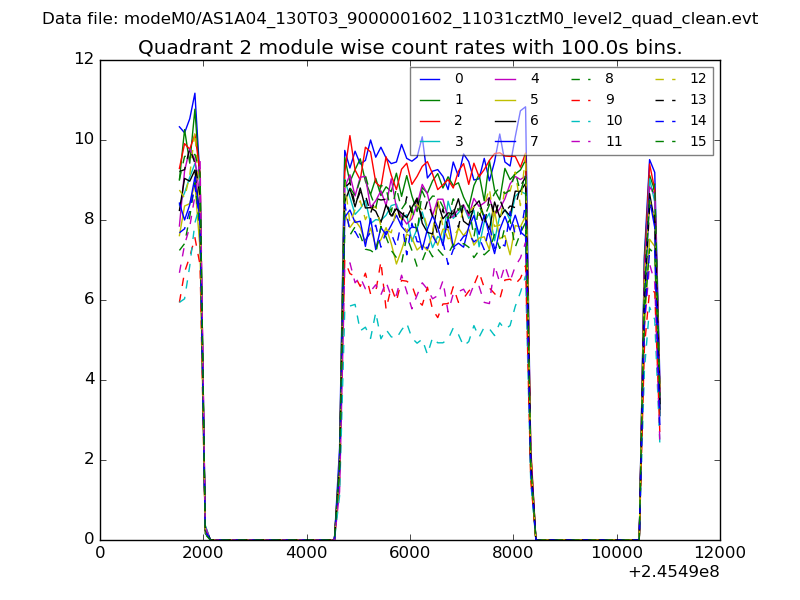
| Module-wise count rates for Quadrant B Data is divided into 100 sec bins |
 |
 |
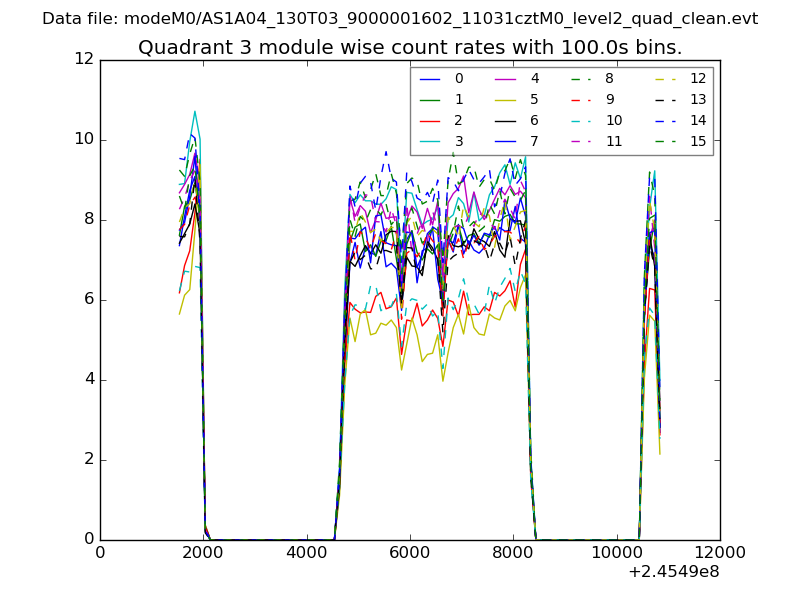
| Module-wise count rates for Quadrant C Data is divided into 100 sec bins |
 |
 |
| Module-wise count rates for Quadrant D Data is divided into 100 sec bins |
 |
 |
| Parameter | Plot |
|---|---|
| CZT HV Monitor | 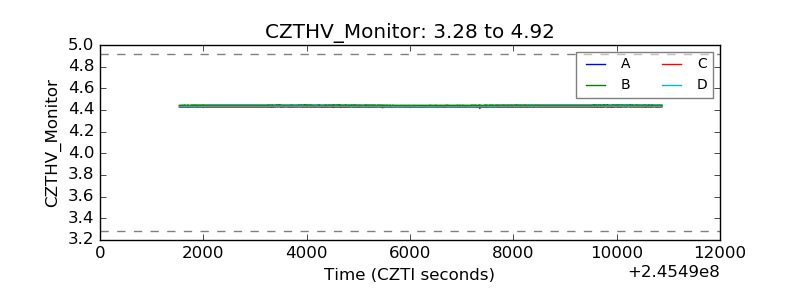 |
| D_VDD | 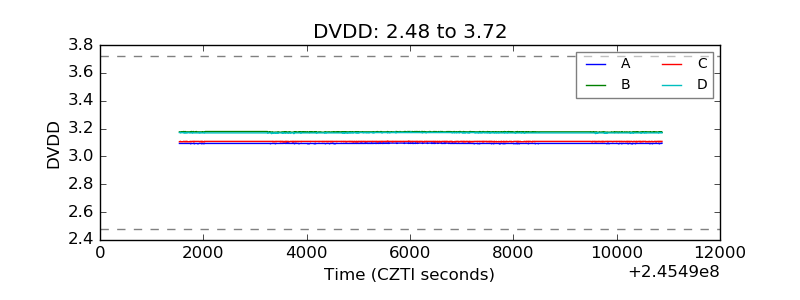 |
| Temperature 1 | 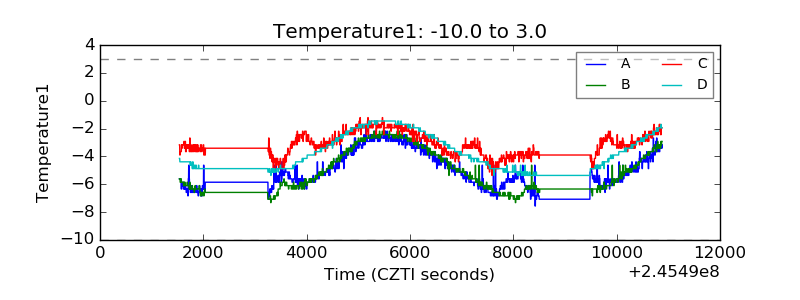 |
| Veto HV Monitor | 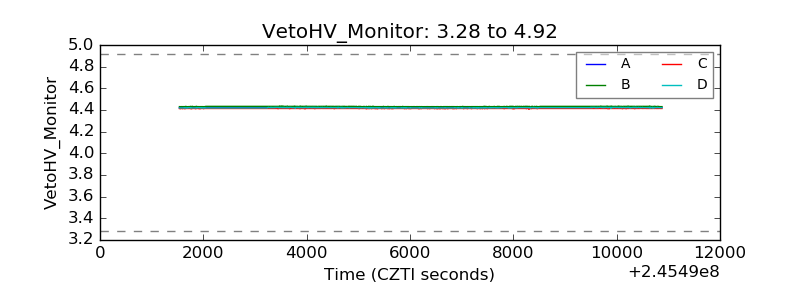 |
| Veto LLD |  |
| Alpha Counter | 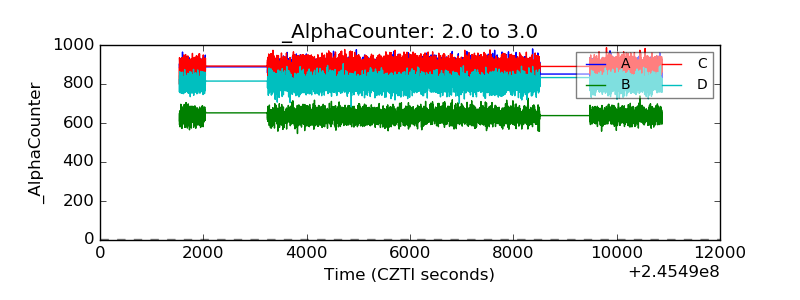 |
| _CPM_Rate | 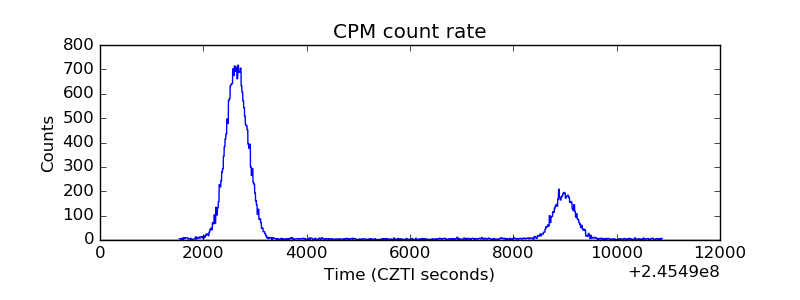 |
| CZT Counter | 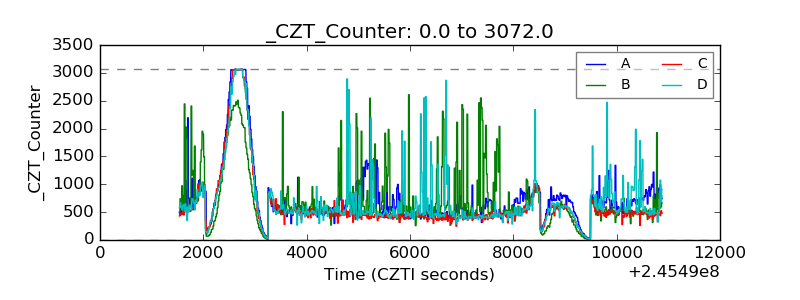 |
| +2.5 Volts monitor |  |
| +5 Volts monitor |  |
| _ROLL_ROT | 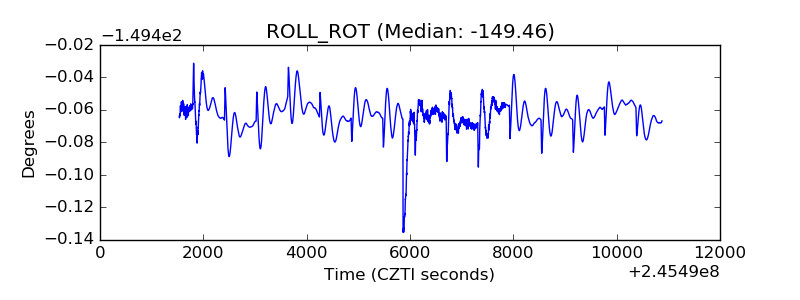 |
| _Roll_DEC | 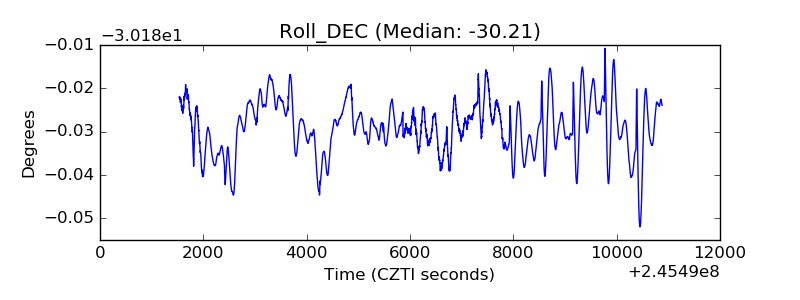 |
| _Roll_RA | 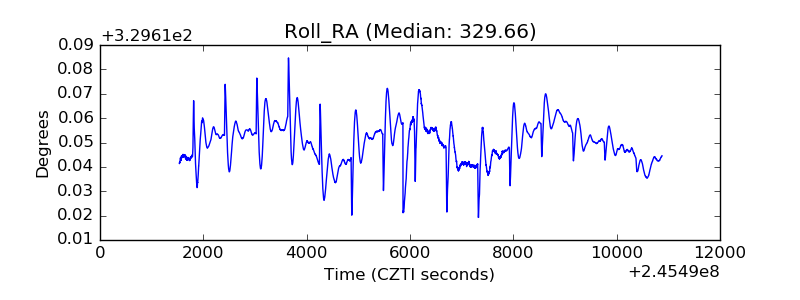 |
| Veto Counter | 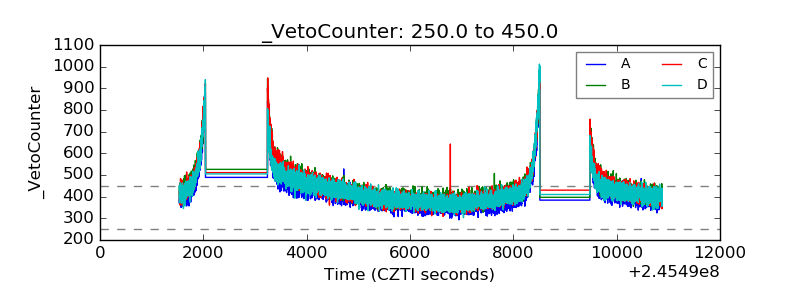 |