| Param | Original file | Final file |
|---|---|---|
| Filename | modeM0/AS1A04_130T03_9000001602_11033cztM0_level2.evt | modeM0/AS1A04_130T03_9000001602_11033cztM0_level2_quad_clean.evt |
| Size (bytes) | 768,720,960 | 109,560,960 |
| Size | 733.1 MB | 104.5 MB |
| Events in quadrant A | 9,808,124 | 644,506 |
| Events in quadrant B | 5,211,086 | 711,751 |
| Events in quadrant C | 3,471,440 | 720,903 |
| Events in quadrant D | 4,257,771 | 692,523 |
| Mode SS | |||
|---|---|---|---|
| Quadrant | BADHDUFLAG | Total packets | Discarded packets |
| A | 0 | 162 | 0 |
| B | 0 | 162 | 2 |
| C | 0 | 162 | 0 |
| D | 0 | 162 | 0 |
| Mode M9 | |||
|---|---|---|---|
| Quadrant | BADHDUFLAG | Total packets | Discarded packets |
| A | 0 | 5 | 0 |
| B | 0 | 5 | 0 |
| C | 0 | 5 | 0 |
| D | 0 | 5 | 0 |
| Mode M0 | |||
|---|---|---|---|
| Quadrant | BADHDUFLAG | Total packets | Discarded packets |
| A | 0 | 34948 | 315 |
| B | 0 | 20735 | 49 |
| C | 0 | 16156 | 47 |
| D | 0 | 17699 | 77 |
| Quadrant | Total seconds | Saturated seconds | Saturation percentage |
|---|---|---|---|
| A | 7843 | 1536 | 19.584343% |
| B | 7885 | 464 | 5.884591% |
| C | 7882 | 74 | 0.938848% |
| D | 7875 | 131 | 1.663492% |
Noise dominated data is calculated using 1-second bins in cleaned event files. If a bin has >2000 counts, and if more than 50% of those come from <1% of pixels, then it is considered to be noise-dominated and hence unusable.
| Quadrant | # 1 sec bins | Bins with >0 counts | Bins with >2000 counts | High rate bins dominated by noise | Noise dominated (total time) | Noise dominated (detector-on time) | Marked lightcurve |
|---|---|---|---|---|---|---|---|
| A | 8478 | 7892 | 1158 | 1158 | 13.66% | 14.67% |  |
| B | 8478 | 7904 | 255 | 255 | 3.01% | 3.23% |  |
| C | 8478 | 7904 | 1 | 1 | 0.01% | 0.01% | 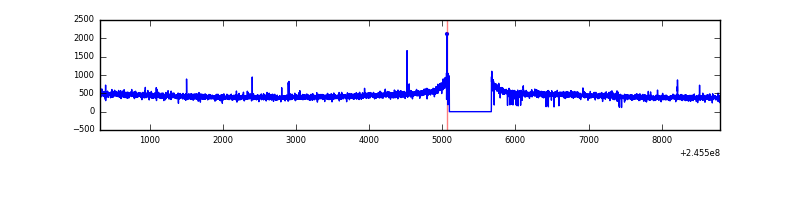 |
| D | 8478 | 7903 | 53 | 53 | 0.63% | 0.67% |  |
Top three noisy pixels from each quadrant. If the there are fewer than three noisy pixels in the level2.evt file, extra rows are filled as -1
| Pixel properties | Quadrant properties | ||||||
|---|---|---|---|---|---|---|---|
| Quadrant | DetID | PixID | Counts | Sigma | Mean | Median | Sigma |
| A | 14 | 238 | 4903900 | 27882.29 | 861 | 842 | 175.8 |
| A | 15 | 174 | 1424626 | 8096.65 | 861 | 842 | 175.8 |
| A | 8 | 5 | 143653 | 812.13 | 861 | 842 | 175.8 |
| B | 4 | 239 | 1451457 | 8340.58 | 908 | 884 | 173.9 |
| B | 3 | 189 | 104302 | 594.64 | 908 | 884 | 173.9 |
| B | 0 | 214 | 36928 | 207.25 | 908 | 884 | 173.9 |
| C | 13 | 61 | 6628 | 28.02 | 886 | 891 | 204.8 |
| C | 12 | 4 | 6296 | 26.4 | 886 | 891 | 204.8 |
| C | 14 | 234 | 4804 | 19.11 | 886 | 891 | 204.8 |
| D | 11 | 129 | 317740 | 1487.41 | 887 | 861 | 213.0 |
| D | 1 | 52 | 168879 | 788.67 | 887 | 861 | 213.0 |
| D | 8 | 195 | 134812 | 628.76 | 887 | 861 | 213.0 |
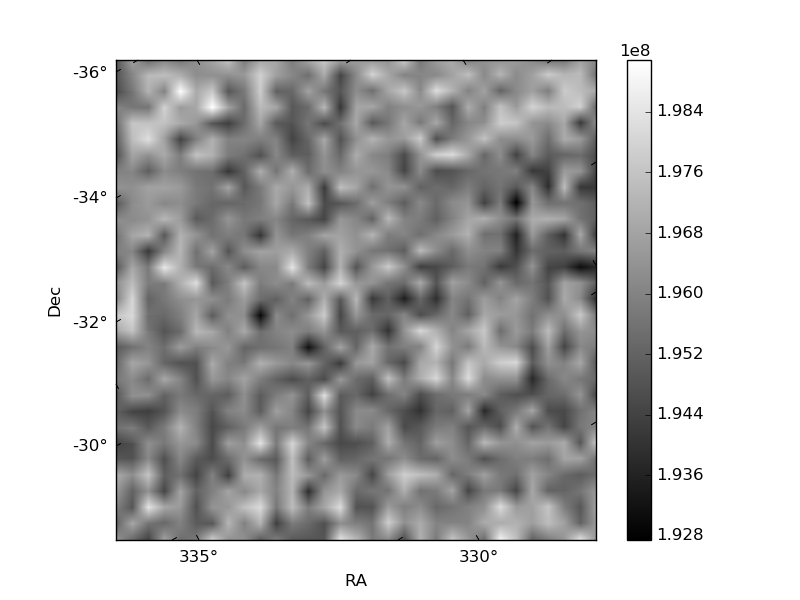
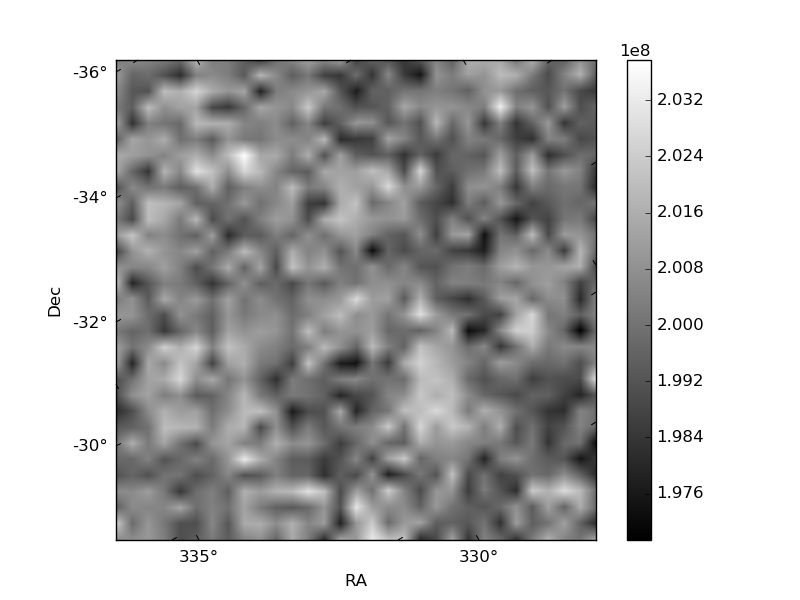
Histogram calculated using DETX and DETY for each event in the final _common_clean file
| Quadrant A | 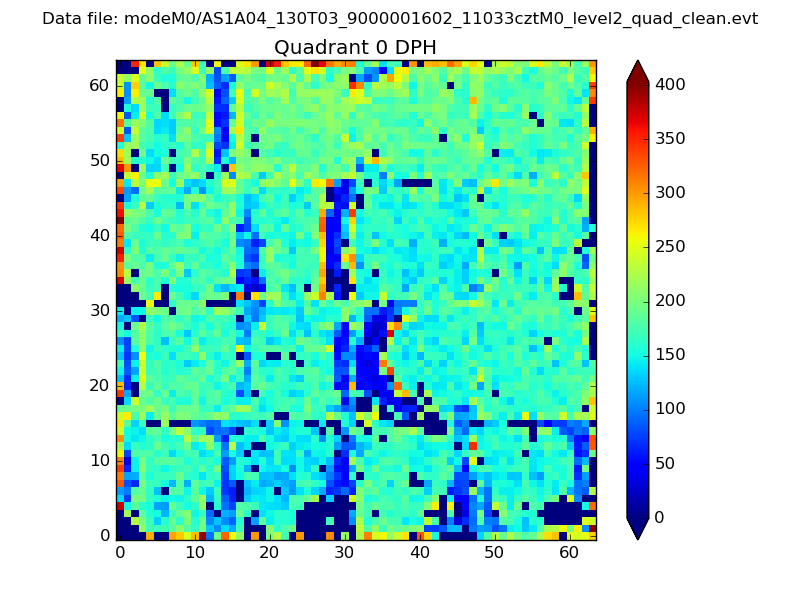 |
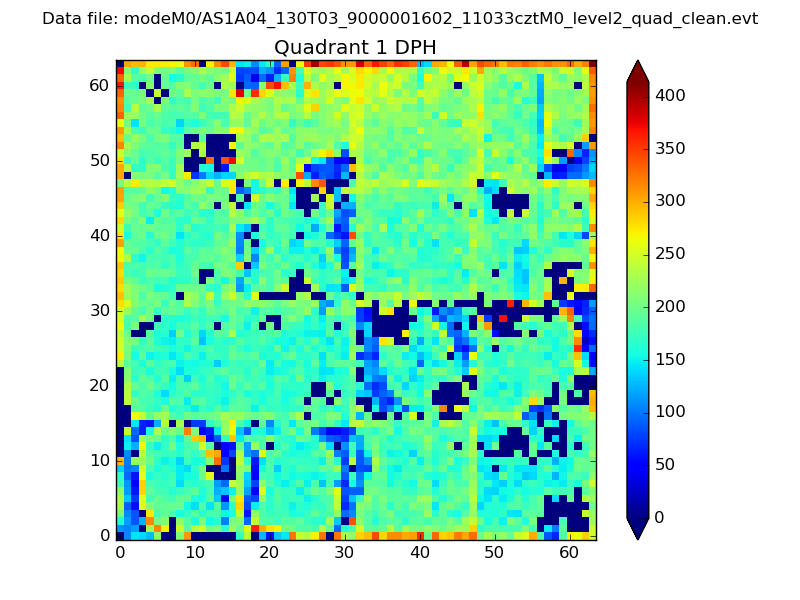 |
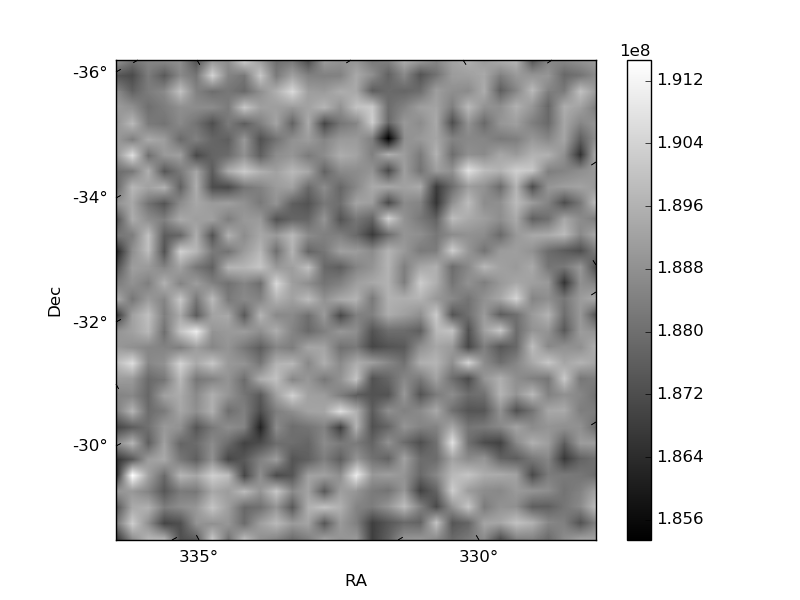
Quadrant B |
|---|---|---|---|
| Quadrant D | 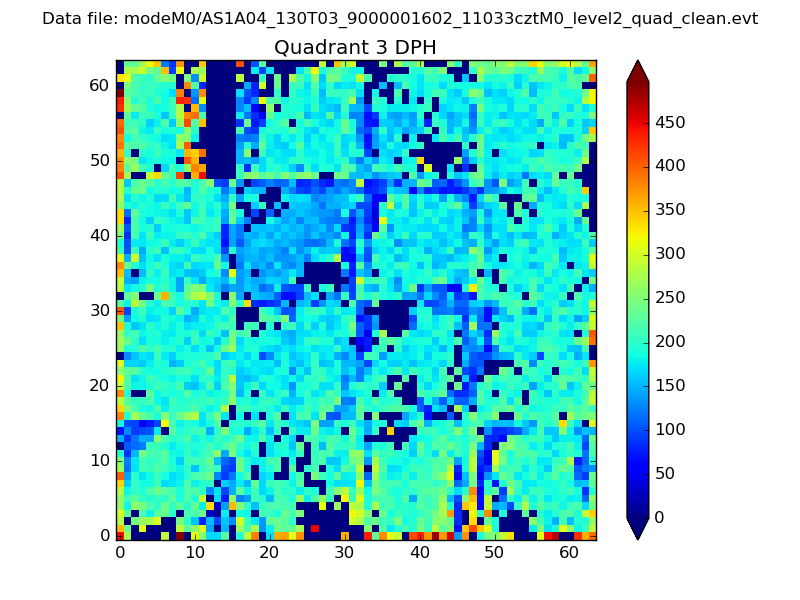 |
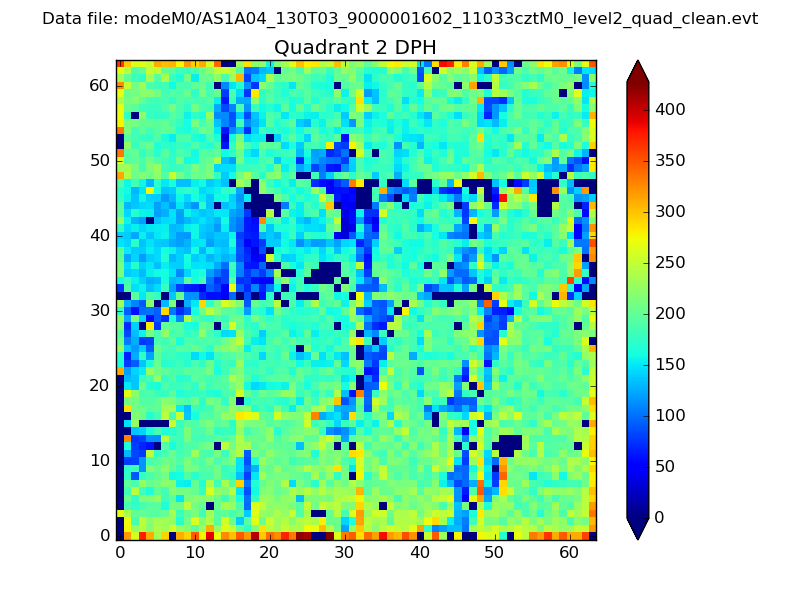 |
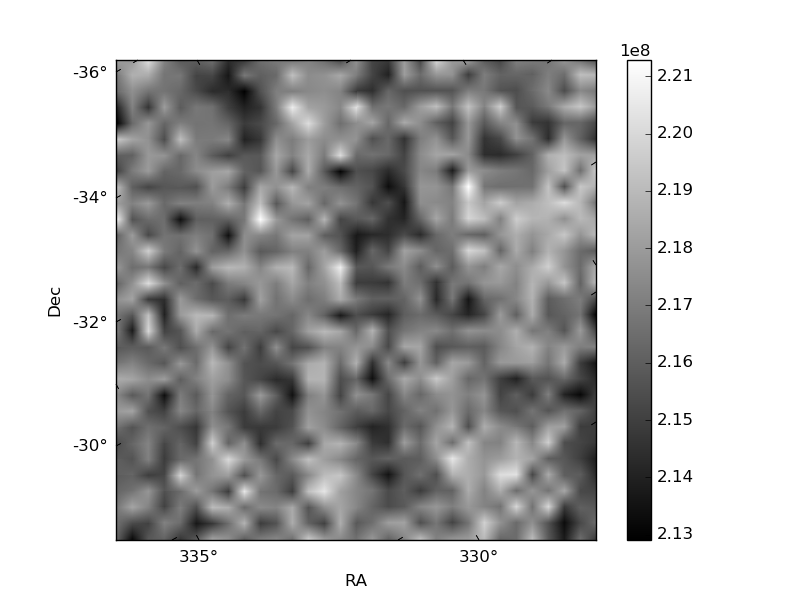
Quadrant C |
| Plot type | Count rate plots | Images |
|---|---|---|
| Comparison with Poisson distribution Blue bars denote a histogram of data divided into 1 sec bins. Red curve is a Poisson curve with rate = median count rate of data. |
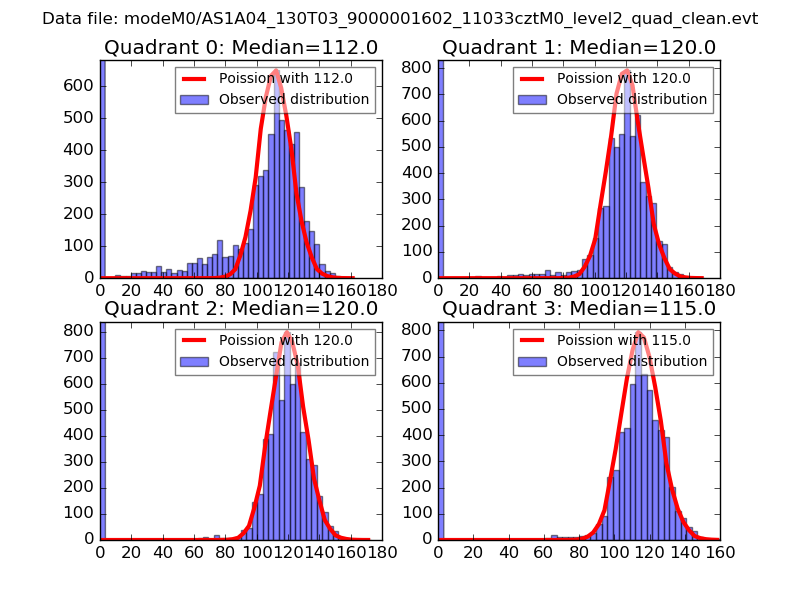 |
 |
| Quadrant-wise count rates Data is divided into 100 sec bins |
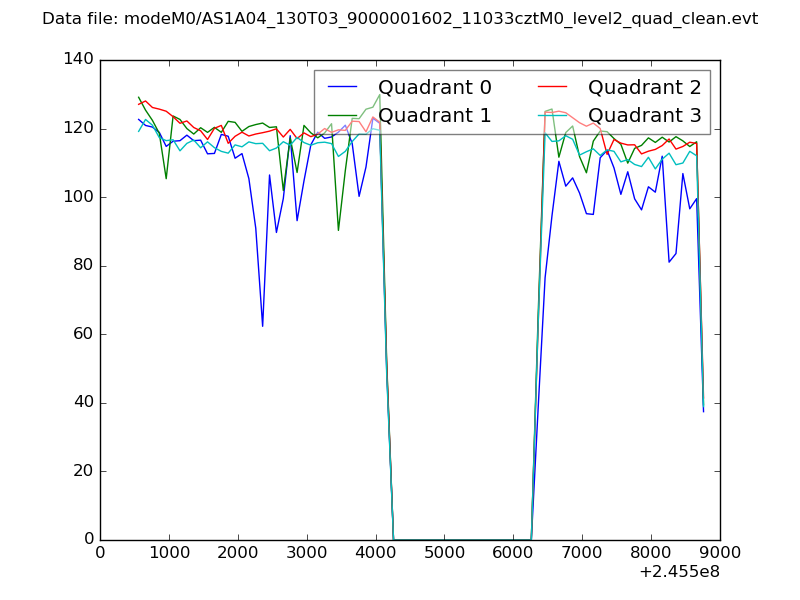 |
|
| Module-wise count rates for Quadrant A Data is divided into 100 sec bins |
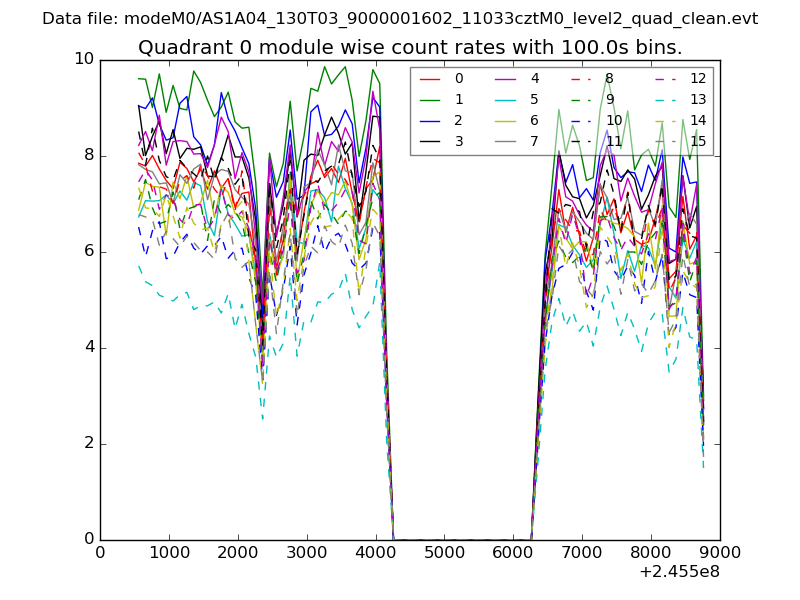 |
 |
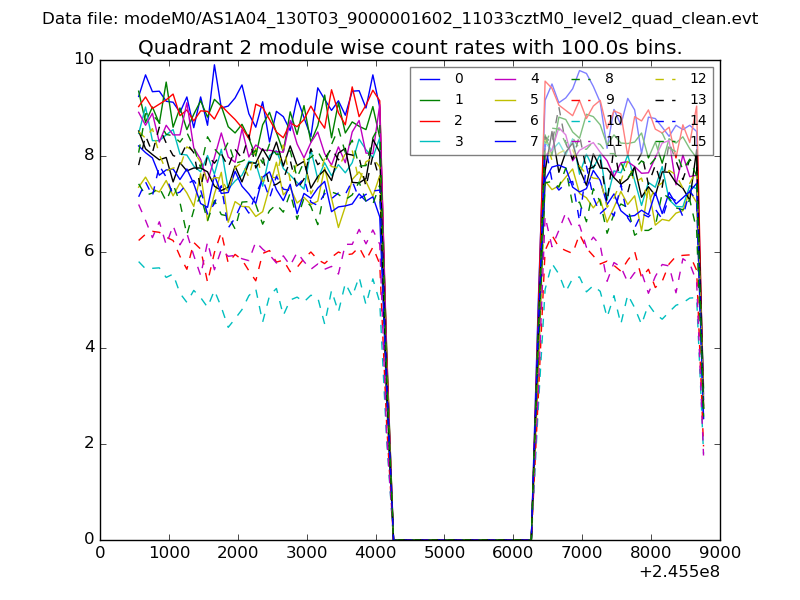
| Module-wise count rates for Quadrant B Data is divided into 100 sec bins |
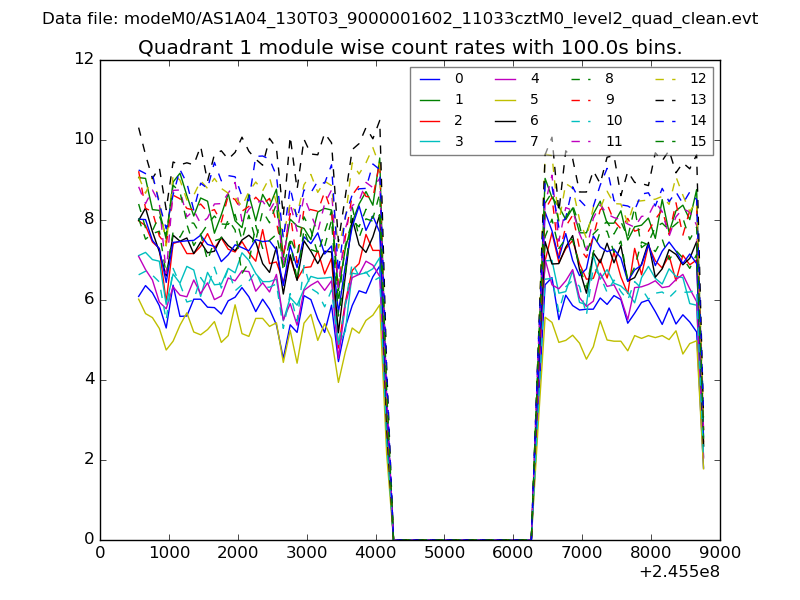 |
 |
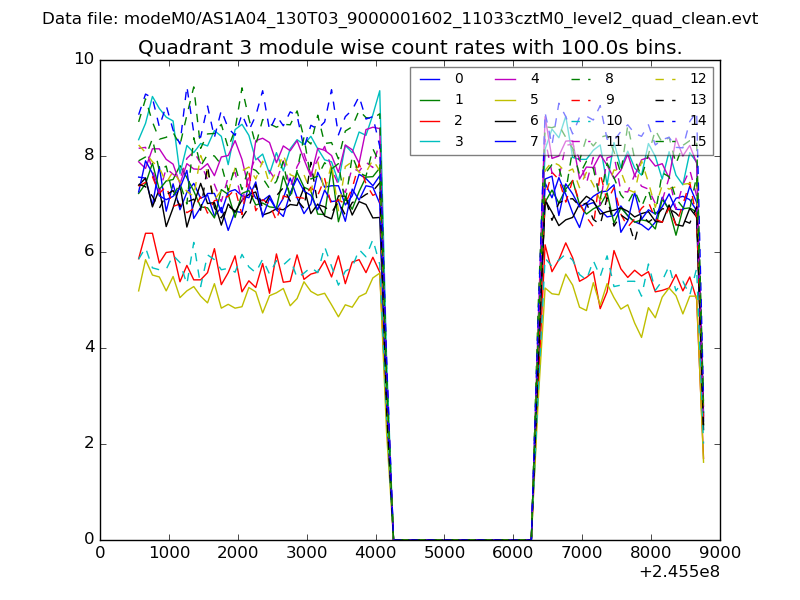
| Module-wise count rates for Quadrant C Data is divided into 100 sec bins |
 |
 |
| Module-wise count rates for Quadrant D Data is divided into 100 sec bins |
 |
 |
| Parameter | Plot |
|---|---|
| CZT HV Monitor | 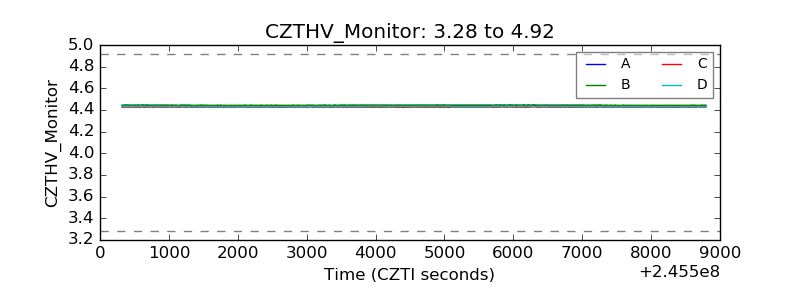 |
| D_VDD | 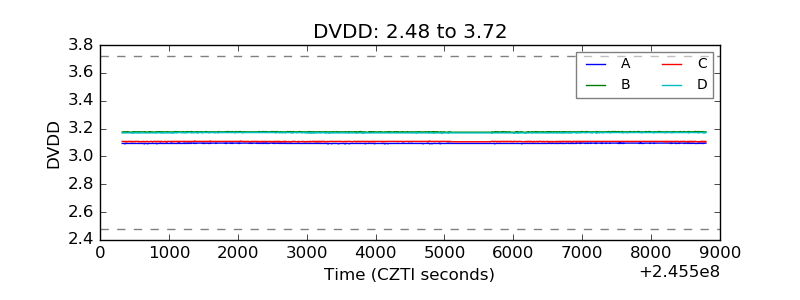 |
| Temperature 1 | 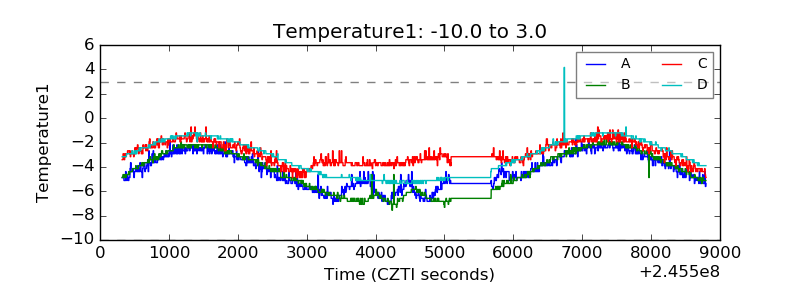 |
| Veto HV Monitor | 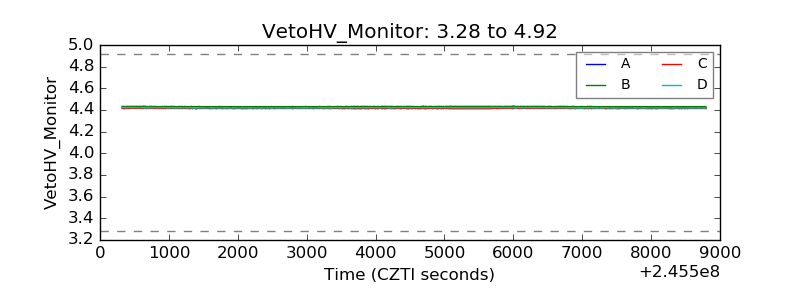 |
| Veto LLD |  |
| Alpha Counter | 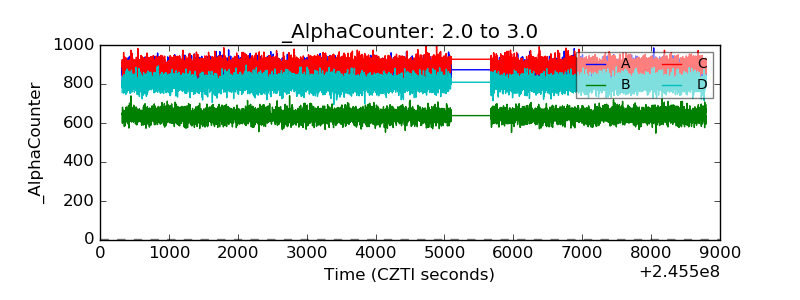 |
| _CPM_Rate | 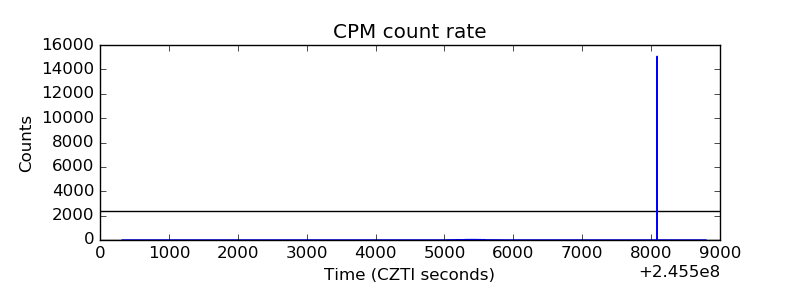 |
| CZT Counter | 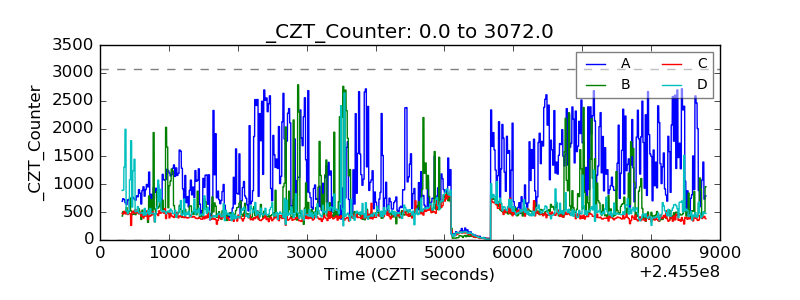 |
| +2.5 Volts monitor | 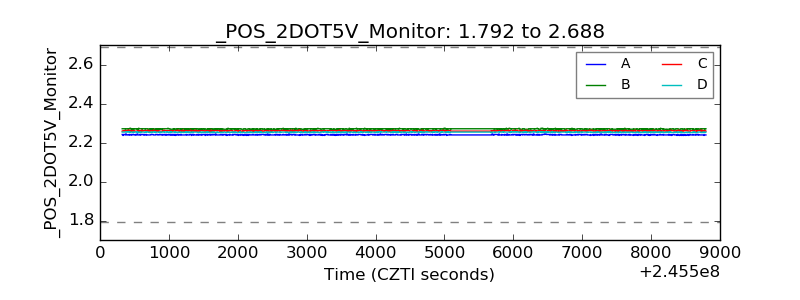 |
| +5 Volts monitor |  |
| _ROLL_ROT | 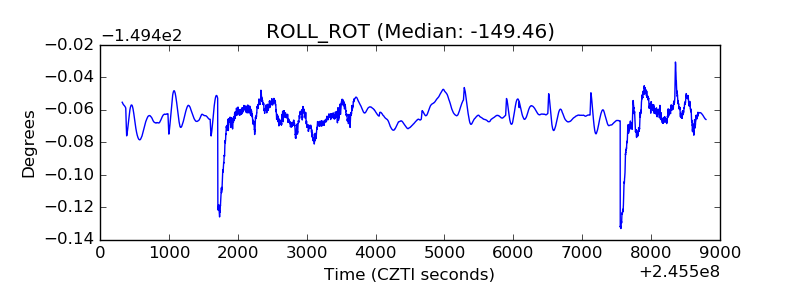 |
| _Roll_DEC | 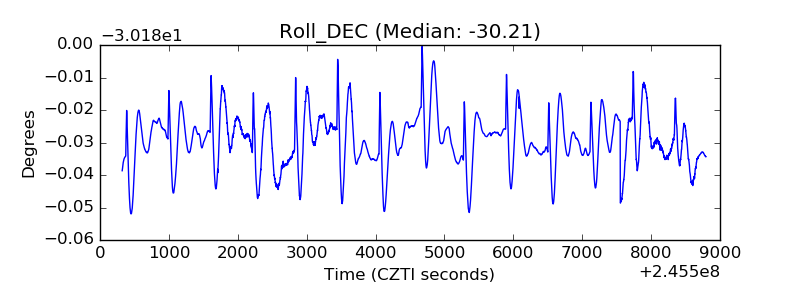 |
| _Roll_RA | 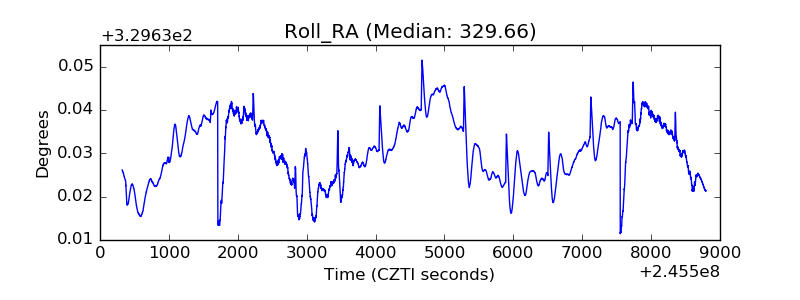 |
| Veto Counter | 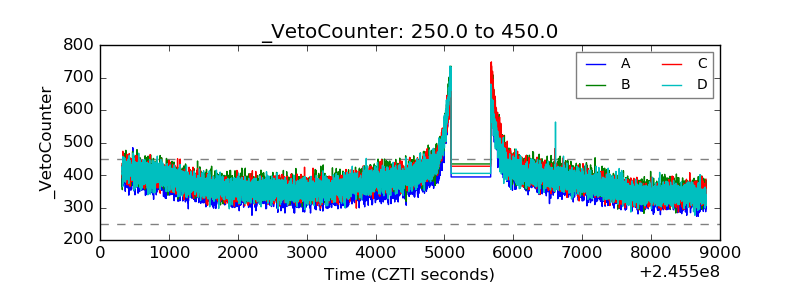 |